Fig. 8.1
Normal artery wall. Normal artery wall shows a three-layered architecture, comprising a high backscattering, thin intima, a low backscattering media, and a heterogeneous and/or high backscattering adventitia (Courtesy of Wakayama Medical University)
Table 8.1
OCT image features of vessel wall
Histology | OCT |
|---|---|
Intima | Signal-rich layer nearest lumen |
Media | Signal-poor middle layer |
Adventitia | Signal-rich heterogeneous outer lumen |
Internal elastic lamina (IEL) | Signal-rich band between intima and media |
External elastic lamina (EEL) | Signal-rich band between media and adventitia |
Plaque Characterization
Criteria for OCT plaque characterization have been previously established by investigating 357 specimens (162 aortas, 105 carotid bulbs, and 90 coronary arteries) from 90 cadavers [8]. Fibrous plaques were characterized by high scattering and homogeneous signal, fibrocalcific plaque as a signal-poor lesion or heterogeneous region with a sharply delineated border, and lipid-rich plaques by signal-poor area with diffuse borders (Figs. 8.2 and 8.3). These criteria demonstrated a sensitivity and specificity of 71–79 % and 97–98 % for fibrous plaques, 95–96 % and 97 % for fibrocalcific plaques, and 90–94 % and 90–92 % for lipid-rich plaques, respectively [8]. These results were also confirmed in other ex vivo studies, which showed even higher accuracy of evaluation for lipid-rich plaque compared to IVUS [13].
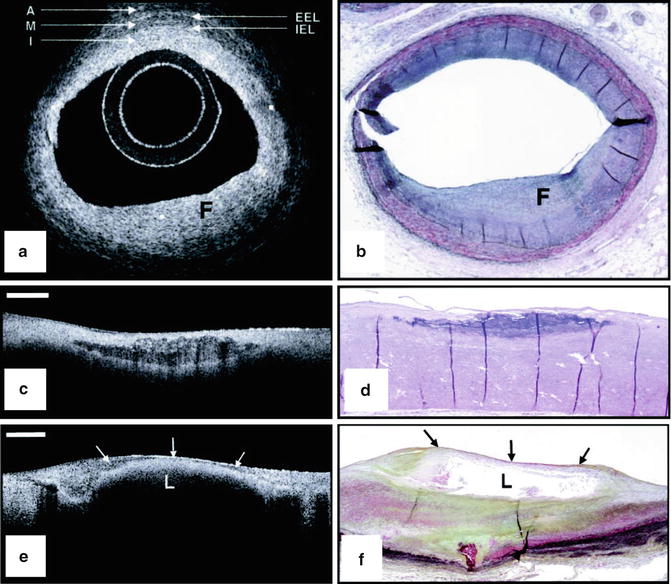
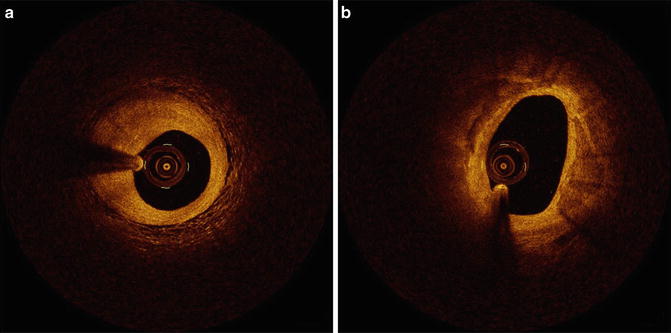

Fig. 8.2
Ex vivo OCT images of human plaques. (a) OCT image of a fibrous coronary plaque showing a homogeneous, signal-rich interior (F). An area of intimal hyperplasia is seen opposite fibrous lesion, demonstrating intima (I, with intimal hyperplasia), internal elastic lamina (IEL), media (M), external elastic lamina (EEL), and adventitia (A). (b) Corresponding histology (Movat’s pentachrome; magnification ×40). (c) OCT image of a fibrocalcific aortic plaque showing a sharply delineated region with a signal-poor interior. Bar = 500 μm. (d) Corresponding histology (H&E; magnification ×40). (e) OCT image of a lipid-rich carotid plaque showing a signal-poor lipid pool (L) with poorly delineated borders beneath a thin homogeneous band, corresponding to fibrous cap (arrows). Bar = 500 μm. (f) Corresponding histology (Movat’s pentachrome; magnification ×20) (Reprinted from Yabushita H, Bouma BE, Houser SL, Aretz HT, Jang IK, Schlendorf KH, et al. Characterization of human atherosclerosis by optical coherence tomography. Circulation. 2002;106(13):1640–5. With permission from Wolters Kluwer Health)

Fig. 8.3
In vivo coronary artery plaques. (a) Fibrous plaque. High scattering and homogeneous signal is observed. (b) Fibrocalcified plaque. Signal-poor heterogeneous region on both sides with well-delineated borders (Courtesy of Wakayama Medical University)
Macrophages
Macrophages play a key role in all phases of coronary artery atherosclerosis. It has been hypothesized that macrophages show high backscattering because they contain lipid and other cellular debris (Fig. 8.4). In a one study of 27 cadaver necrotic core fibroatheromas, OCT images were acquired and quantified using the “Normalized Standard Deviation” (NSD) parameter that measures local OCT image heterogeneity. NSD was compared to registered histologic slides that were immunohistochemically stained by CD68 [3]. A positive correlation between OCT and histologic measurement of CD68 was found (r = 0.84, p < 0.00001); a range of NSD thresholds (6.15–6.35 %) demonstrated 100 % sensitivity and specificity for differentiating caps containing >10 % CD68 staining [3].
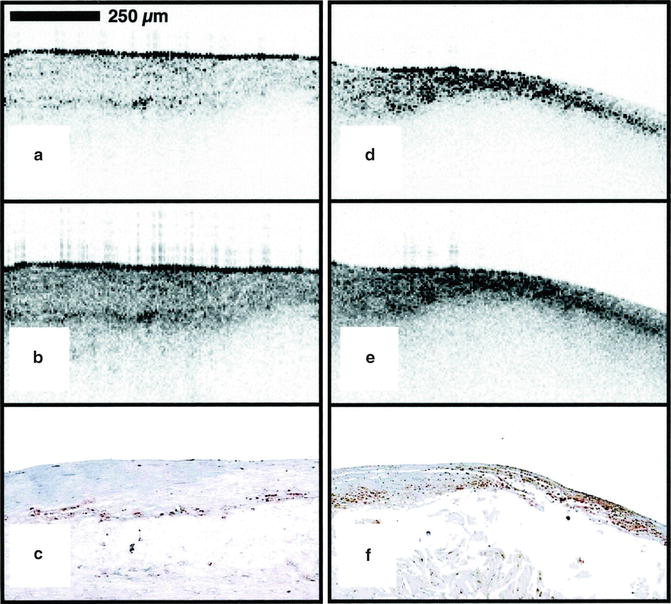

Fig. 8.4
Ex vivo OCT image of macrophages. Raw (a) and logarithm base 10 (b) OCT images of a fibroatheroma with a low density of macrophages within the fibrous cap. (c) Corresponding histology for (a) and (b) (CD68 immunoperoxidase; original magnification ×100). Raw (d) and logarithm base 10 (e) OCT images of a fibroatheroma with a high density of macrophages within the fibrous cap. (f) Corresponding histology for (d) and (e) (CD68 immunoperoxidase; original magnification ×100) (Reprinted from Tearney GJ, Yabushita H, Houser SL, Aretz HT, Jang IK, Schlendorf KH, Kauffman CR, Shishkov M, Halpern EF, Bouma BE. Quantification of macrophage content in atherosclerotic plaques by optical coherence tomography. Circulation. 2003;107(1):113–9. With permission from Wolters Kluwer Health)
Thrombi
OCT can distinguish two major types of thrombi: red and white (Fig. 8.5). The red thrombus shows high backscattering and high attenuation. In contrast, the white thrombus shows less backscattering, low attenuation, and a homogeneous signal [4]. The appearance of mixed and organized thrombi by OCT is hypothesized to be heterogeneous, but the image characteristics of organized thrombi are not well understood or validated.
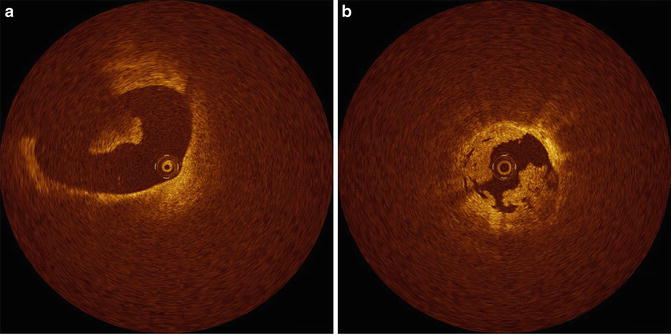

Fig. 8.5
Thrombi. (a) Red thrombus. A red thrombus with high IVOCT backscattering and attenuation is floating in the coronary artery. (b) White thrombus. White thrombus with homogeneous backscattering and low attenuation attached to coronary artery wall (Courtesy of Wakayama Medical University)
Cholesterol Crystals
Cholesterol crystals can be seen by IVOCT within atheromatous plaque, usually in combination with lipid. Cholesterol crystals appear as needle-shaped clefts on pathology and OCT demonstrates similarly shaped, linear highly scattering signals [5] (Fig. 8.6). Some investigators have suggested that cholesterol crystal might have the potential to injure the fibrous cap, leading to ACS, but to date, there are no in vivo OCT examinations or trials that test this hypothesis [14].
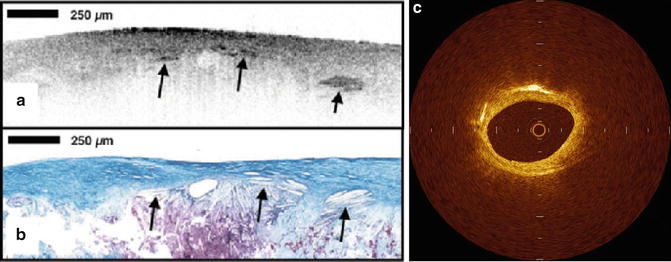

Fig. 8.6
Cholesterol crystal. OCT image (a) demonstrates oriented, linear, highly reflecting structures near the fibrous cap-lipid pool junction (arrows). Corresponding histology (b, Masson’s trichrome; original magnification ×40) demonstrated the presence of cholesterol crystals (arrows). Cholesterol crystals in vivo OCT image (c) appears as linear, highly backscattering structures within in the plaque (Reprinted from Tearney GJ, Jang IK, Bouma BE. Evidence of Cholesterol Crystals in Atherosclerotic Plaque by Optical Coherence Tomographic (OCT) Imaging. Eur. Heart J. 2003:23;1462. With permission from Oxford University Press)
Neovascularization
Vulnerable plaque is pathologically defined as a plaque with a thin fibrous cap, necrotic core, and macrophage infiltration within a fibrous cap. In addition, neovascularization in atheromatous plaque, called “vasa vasorum,” may also be related to plaque vulnerability [15]. Neovascularization is identified as regions with little or no IVOCT backscattering and are frequently observed over several frames [16] (Fig. 8.7). Although there is little histopathologic validation of IVOCT for neovascularization, a clinical OCT study demonstrates that these regions in coronary plaques correlate with the presence of thin-cap fibroatheromas (TCFA) and positive arterial remodeling [17]. More recently, it has been reported that neovascularization seen by IVOCT is strongly associated with the progression of coronary artery plaques [18].
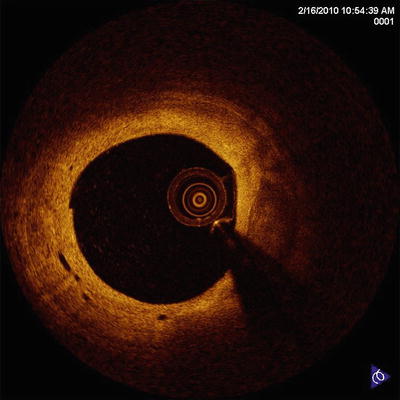

Fig. 8.7
Neovasculariza-tion. Intimal vessels are well-delineated regions or voids with low OCT backscattering (Courtesy of Wakayama Medical University)
In Vivo Studies
Detection of Vulnerable Plaques
For cardiologists, the detection of vulnerable plaques, the most common of which is the TCFA, is a key goal for predicting and preventing the course of ACS. On IVOCT assessment, TCFA has been defined by some as a plaque with ≥2 quadrants of lipid and the thinnest part of a fibrous cap measuring <65 μm. In one study, 57 patients who underwent successful percutaneous coronary intervention (PCI) were divided into three groups: acute myocardial infarction (AMI) (n = 20), ACS (n = 20), and stable angina pectoris (SAP) (n = 17). Patients with AMI and ACS demonstrated higher incidence of TCFA and thinner fibrous cap thickness compared with SAP [19].
Frequency and distribution of TCFA were also examined, and pathology reports that indicated TCFA defined by OCT were dominant in the proximal left anterior descending artery, whereas TCFA in the left circumflex artery and the right coronary artery were equally distributed [20, 21]. As with culprit lesions, TCFA in non-culprit lesions were more frequent in patients with ACS than SAP [22].
The alternative criteria of TCFA recently have been proposed by OCT consensus document [23]. An OCT-TCFA is defined as an IVOCT-delineated necrotic core with an overlying fibrous cap in which the minimum thickness of the fibrous cap is less than a predetermined threshold. The clinical significance of lipid arc dimensions was determined to be unknown and remains an area of future investigation [23].
Macrophages In Vivo
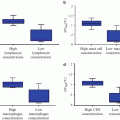
Macrophage content was investigated in vivo in a study that enrolled 49 patients undergoing PCI [24] where again patients were divided into three groups: ST-elevation myocardial infarction (STEMI) (n = 19), ACS (n = 19), and SAP (n = 11). Macrophages were measured in the caps of IVOCT-determined fibroatheroma. NSD values showed a relationship between macrophage concentrations and the various clinical presentations. Patients with unstable clinical presentation had higher concentrations of macrophages and macrophage densities correlated with white blood count, the thickness of the fibrous cap, and arterial remodeling [25, 26]. Further, macrophage density was found to be higher at cap rupture sites of culprit lesions than at non-rupture sites (Fig. 8.8). Even though these results have showed interesting relationships between macrophages and other clinical and microstructural findings, the clinical implication of NSD measurements by OCT, especially prognostic value, remains unknown.
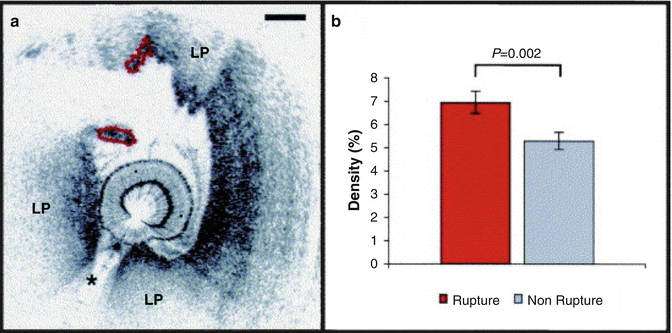

Fig. 8.8
Intracoronary OCT macrophage imaging. (a) Optical coherence tomography (OCT) image of a rupture site (outlined in red) overlying a lipid-rich plaque (LP). The asterisk symbol represents guide wire shadow. A 500 μm scale bar is seen in the top right-hand corner. (b) Bar graph representing mean macrophage density at sites of rupture, corresponding to outlined segment in panel (a), compared with the rest of the plaque. Standard error bars are represented. (Reprinted from MacNeill BD, Jang IK, Bouma BE, Iftimia N, Takano M, Yabushita H, et al. Focal and multifocal plaque macrophage distributions in patients with acute and stable presentations of coronary artery disease. J Am Coll Cardiol. 2004;44(5):972–9. With permission from Elsevier)
Acute Coronary Syndrome
New findings from clinical studies have elucidated some of the intricacies of ACS [27–30]. For example, IVOCT demonstrated that the morphologies of exertion-triggered and rest-onset ruptured plaques differ in ACS patients, and that some plaque ruptures may occur in thick fibrous caps, up to 140 μm, depending on exertion levels [27] (Fig. 8.9). Another IVOCT trial reported the differences in culprit lesion morphology between STEMI and non-ST-segment elevation acute coronary syndrome (NSTEACS). As a result, culprit lesions in STEMI showed higher incidence of plaque rupture, TCFA, and red thrombus than those in NSTEACS [28]. Patients with STEMI also had greater plaque disruption and smaller minimal lumen area than patients with NSTEM [29]. These results suggest that the indicate that morphological features at culprit lesions could relate to the clinical presentation in patients with acute coronary disease. Moreover, IVOCT revealed a relationship between lesion morphology on OCT and Braunwald classification of unstable angina pectoris (UAP). Patients with class II UAP more frequently showed plaque rupture and thrombosis formation [30]. These findings suggest that IVOCT may provide a novel means for exploring the pathophysiology of ACS in vivo.
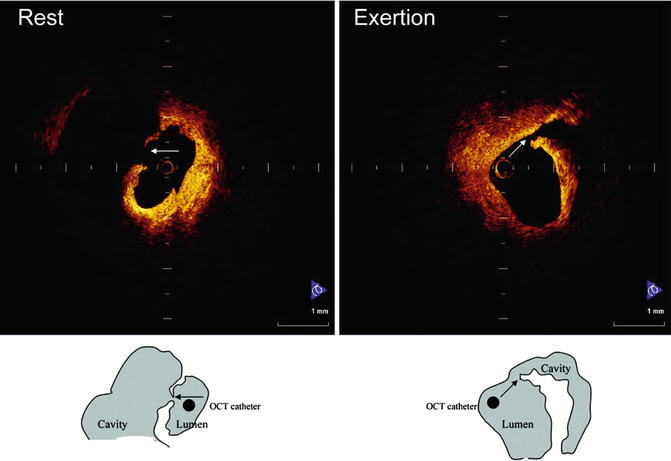

Fig. 8.9


Representative cases of plaque rupture occurring at rest or with exertion. (Left) Plaque rupture that occurred at rest. Fibrous cap was broken at the midportion, and a thin fibrous cap could be observed. (Right) Plaque rupture that occurred during heavy farm work. Thick fibrous cap was broken at shoulder of plaque (Reprinted from Tanaka A, Imanishi T, Kitabata H, Kubo T, Takarada S, Tanimoto T, et al. Morphology of exertion-triggered plaque rupture in patients with acute coronary syndrome: an optical coherence tomography study. Circulation. 2008;118:2368–73. With permission from Wolters Kluwer Health)
Stay updated, free articles. Join our Telegram channel

Full access? Get Clinical Tree


