Introduction
Current diagnostic criteria of cardiac arrhythmias are based mostly on the electrocardiogram (ECG) recorded with body surface electrodes, which register local far-field potentials generated by all cardiac myocytes. The remote body surface placement and low number of electrodes limit the information content of ECG recordings and the details in the mechanisms of arrhythmias, the regions of electrophysiologic abnormalities, and the paths of reentry that can be identified.
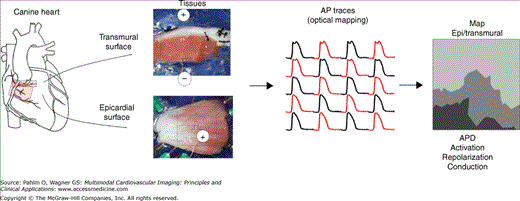
Recently, high spatial resolution optical-mapping systems have been developed and used in research laboratories to investigate the mechanisms of cardiac arrhythmias in animal models under controlled conditions.1 Optical mapping uses fluorescent dyes that are sensitive to transmembrane potential or to ion concentrations as probes, optics to collect the signal-carrying fluorescence, and photon-sensing devices (eg, camera or photodiode array) to convert fluorescence to electrical signals, which are then amplified, digitized, processed, and analyzed (Fig. 10–1). The advantages of camera-based optical-mapping systems are (1) recording high spatial resolution movies of electrophysiologic activity in cardiac muscle; (2) reporting transmembrane potential, which reflects cellular electrophysiology more directly than the extracellular field potential registered by electrode-based body surface and intracardiac mapping systems; and (3) capability of recording cytosolic ion concentrations (eg, Ca2+ transient) by using ion-sensitive fluorescent dyes. The current trend in optical mapping has been moving toward dual-camera simultaneous recording of both membrane potential and Ca2+ transient within the same view field. High spatial resolution optical mapping provides details in electrophysiologic heterogeneity, focal activation, and abnormal conduction in the heart and has contributed significantly to the insight and mechanistic understanding of cardiac arrhythmias in recent years.
Figure 10–1.
Optical mapping of electrical activity in cardiac muscle. Wedges of ventricular muscle are isolated and perfused via a branch of a coronary artery (left), stained with a voltage-sensitive fluorescent dye, and imaged on either a transmural or epicardial (Epi) surface with an optical-mapping system. Fluorescence movies of electrical activity are processed to obtain traces of action potentials (APs); distribution maps of activation, repolarization, and AP duration (APD); conduction sequences and velocity; and reentry pathways (right).
Most of the existing optical-mapping systems use a design that optically focuses the to-be-observed tissue surface onto the sensor array of a stationary camera, thus requiring direct view of the tissue surface. The mapping area can range from a single isolated cell to the entire heart, depending on the optics mounted in front of the camera. In this design, muscle contraction can change the relative position of tissue surface, introducing motion artifacts into the recorded electrophysiologic signal. The undesired motion artifacts are commonly eliminated by tissue immobilization with pharmacologic excitation-contraction uncoupling agents, such as cytochalasin D2,3 or blebbistatin,4 in isolated heart or tissue preparations. Alternative methods (eg, ratiometric imaging or signal processing) can also be used to extract useful data from signals containing motion artifacts obtained in beating hearts. In creating models for investigating the mechanisms of arrhythmias in diseased human hearts, hearts from large animals are preferred over those from small animals due to their similarities to human hearts in terms of ion currents, electrophysiologic heterogeneity, conduction phenomena, anatomy, and coronary perfusion, among other characteristics. All studies presented in this chapter were performed by using a 256-channel (16 × 16 array) optical-mapping system to record electric activity on the surface (mapping field: 19.5 × 19.5 mm2) of isolated and arterially perfused canine ventricular tissues that were stained with a membrane potential–sensitive dye, 4(beta-[2-(di-n-butylamino)-6-napathy]vinyl)pyridinium (di-4-ANEPPS).
Clinically, cardiac arrhythmias occur commonly in diseased hearts and are triggered by acute events. Although the basic theory and mechanisms of the initiation and maintenance of ventricular tachycardia (VT) have been investigated intensively (eg, early and delayed afterdepolarizations [EADs] and [DADs],5 dispersion of repolarization, reentry), their manifestation, interactions, and roles in arrhythmias in diseased hearts are less clear. This chapter presents some recent developments in understanding the mechanisms of arrhythmias in tissue models of ischemia/reperfusion; Brugada, long QT, and Andersen-Tawil syndromes; and atrioventricular (AV) nodal reentry unveiled by optical mapping in our laboratory.
Electrophysiologic Heterogeneity Across the Ventricular Wall
We used optical mapping to elucidate the functional nature of M-cell behavior in the ventricular wall. Ventricular action potentials (APs) are heterogeneous.6 The AP duration (APD) is longest in the mid myocardium and shortest in the epicardium across the ventricular free wall. Compared with the endocardium, myocytes in the epicardium have a larger transient outward current (Ito); a stronger ischemia-induced KATP current; and an AP that has a larger spike and dome morphology, more pronounced rate dependency, and a higher sensitivity to ischemia. The slow delayed rectifier K+ current, IKs, is lowest in the mid myocardium, whereas the density of the rapid delayed rectifier K+ current, IKr, is similar across the canine left ventricle wall. The heterogeneity in ion currents causes dispersion of APs and of repolarization, which normally serves a physiologic function but can be proarrhythmic when it occurs excessively or interacts with the abnormal sequence of activation in a diseased heart.
The mid myocardium in the ventricular free wall has been shown to differ significantly from the endocardium and epicardium, with exceedingly long APDs during long cycle length (CL) activation. It was postulated that a special group of mid-myocardial cells, so-called M cells, is responsible for the distinctive mid-myocardial electrophysiologic properties.6-9 The M cells have been proposed to underlie the T and U waves in ECG and play major roles in the dispersion of repolarization and in the initiation of VT.6,7 However, some studies failed to find evidence of M cells.8,10-12 Using optical mapping, we demonstrated that instead of a separate group of cells, the M-cell behavior was functional extremes of ventricular heterogeneity that became manifest under specific conditions.13 The mid-myocardial preferential prolongation of APDs also contributed to the formation of a transmurally asymmetric distribution of APDs in a tissue model of long QT syndrome14 with the shortest APD in the epicardium and longest APD in the mid myocardium, upon which epicardial but not endocardial premature stimulation can easily initiate VT.15
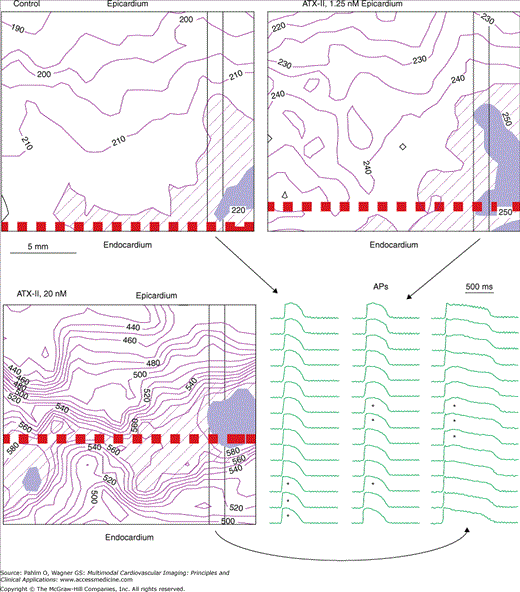
We isolated and arterially perfused wedges of canine left ventricular free wall and optically mapped APDs on their cut-exposed transmural surfaces, before and after treatment with anemone toxin II (ATX-II), which delays the inactivation of membrane Na+ current (INa). Before ATX-II, the row of recording sites having the longest mean APD (APDL layer) was in the (sub)endocardium. ATX-II prolonged APD heterogeneously (mid myocardium > endocardium > epicardium) and “moved” the APDL layer progressively from the endocardium into mid myocardium (Fig. 10–2). We detected M-cell behavior (the APDL layer located at sites other than in the endocardium and epicardium with statistical significance) in 18 wedges exposed to ≥5 nmol/L of ATX-II, but not in the other 18 wedges exposed to ≤2.5 nmol/L of ATX-II. We also repeated the same experiments in wedges isolated from the canine ventricular septum. In contrast to the ventricular free wall, none of the 22 septum wedges showed M-cell behavior under the same conditions.16,17 Therefore, M cell is a functional phenomenon in the left ventricular free wall, but not in the septum, that can become manifest under specific nonphysiologic conditions.
Figure 10–2.
Functional M-cell behavior in canine left ventricular free wall. The longest action potential durations (APDs) “moved” to deeper positions with increasing concentrations of anemone toxin II (ATX-II; 0, 1.25, and 20 nmol/L). The isochronal maps show the transmural distributions of APDs (in milliseconds) with the diagonal hatched lines and solid black highlighting the regions of longer and longest APDs. The thick dashed lines indicate the APDL (longest mean APD) layer. Selected columns of APs are displayed at lower right with asterisks indicating the longest three APDs. Endocardial pacing cycle length (CL) is 1000 ms. Mapping area is 19.5 × 17.0 mm2. The longest APDs are mostly in the (sub)endocardium during control and appeared as islands in the mid myocardium after 20 nmol/L of ATX-II. Reproduced with permission from Ueda N, Zipes DP, Wu J. Functional and transmural modulation of M cell behavior in canine ventricular wall. Am J Physiol Heart Circ Physiol. 2004;287:H2573.
Arrhythmogenesis during Acute Ischemia and Reperfusion
Acute ischemia and reperfusion are strong triggers of VT. Most ischemia-induced VTs occur during the first 10 to 15 minutes of ischemia and are due to focal activation and transmural reentry.18-20 Both the differences in the coronary blood flow between the healthy and ischemic regions and heterogeneic tissue responses to ischemia contribute to the initiation of VT. Using optical mapping, we investigated the contributions to VT by heterogeneic tissue responses to acute global ischemia. Global ischemia eliminated the heterogeneity in coronary perfusion, thus isolating the tissue responses to ischemia.
Acute ischemia suppresses excitability faster in the epicardium than endocardium, increasing transmural dispersion of excitability in the ventricular wall.18,21 Ischemia also slows conduction after a transient initial increase. The rapidly changing transmural dispersion of tissue excitability and velocity of conduction form a proarrhythmic substrate in which reentry can be initiated, sustained, and then abolished during acute global ischemia and reperfusion.
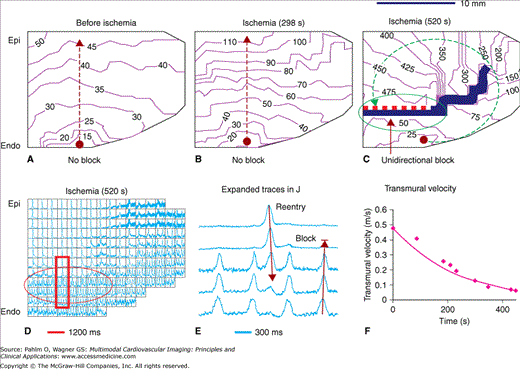
We induced global ischemia and optically mapped APs on the transmural surfaces of 36 isolated wedges of canine left ventricular free wall. Before ischemia, the transmural response of the tissues was 1:1 to endocardial pacing (CL = 300 ms). Ischemia increased the transmural gradient of the refractory period, which blocked conduction unidirectionally and initiated reentry and VT after 535 ± 146 seconds (31 wedges). Multiple zones of responsiveness (1:1, 2:1, and 4:1) to endocardial pacing developed after 570 ± 165 seconds of ischemia (34 wedges). Further ischemia inactivated the epicardium and eliminated reentry and VT in 24 wedges. Therefore, heterogeneic prolongation of the refractory period and conduction slowing by early ischemia provided a proarrhythmic substrate in which reentry and VT could be induced by rapid endocardial activation (Fig. 10–3).
Figure 10–3.
Unidirectional block of conduction at the transmural gradient of refractory period by endocardial stimulation during acute global ischemia. Activations were recorded on a cut-exposed transmural surface of a wedge of isolated canine left ventricular free wall that was perfused through an included diagonal branch of the left anterior descending coronary artery. Acute global ischemia was created by halting perfusion. The times of ischemia are indicated in the subtitles. The conduction sequences (A-C) from the endocardial sites of pacing (the black dots; cycle length [CL] = 300 ms) are shown as isochrone lines (at the times indicated by the numbers in milliseconds) moving along the directions of the thin dashed arrow-headed lines. The thick solid line and the line with one dashed side and one solid side in C indicate full block and unidirectional block of conduction, respectively. Grids in the action potential mosaic (D) separate the signals (1.2 seconds, normalized) from neighboring sensors. The framed traces in D are shown in E with an expanded time scale. The transmural velocity of conduction (F) is calculated from two recording sites with 11 mm of separation along a transmural line passing through the site of pacing. Epi and Endo indicate the epicardium and endocardium, respectively. Transmural conduction from the endocardial site of pacing at the CL of 300 ms was blocked in the mid myocardium in C and D by the longer refractory period. However, activation conducted along the opposite direction (toward the endocardium) penetrated the line of unidirectional block in C and D, until it collided with the refractory period of another activation initiated by the continued endocardial pacing. Reproduced with permission from Wu J, Zipes DP. Transmural reentry during global acute ischemia and reperfusion in canine ventricular muscle. Am J Physiol Heart Circ Physiol. 2001;280:H2719. See also Moving Image 10–3.
Unidirectional block of conduction at the transmural gradient of refractory period by endocardial stimulation during acute global ischemia.
Play Video
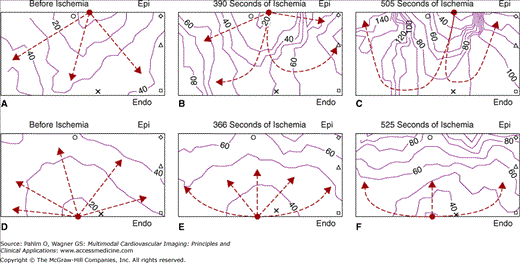
In contrast to endocardial pacing, epicardial pacing initiated reentry during acute ischemia by a different mechanism.20 The transmural gradient of sensitivity to ischemia caused decremental conduction to occur first in the epicardium. At this time, epicardial stimulation failed to conduct laterally along the rim of epicardium and, instead, conducted to the more excitable endocardium, then laterally along the rim of endocardium, and finally reentered the subepicardium (in 9 of 18 wedges after 719 ± 399 seconds of ischemia). In contrast, endocardial stimulation applied right before or after the above epicardial stimulations initiated activation that conducted rapidly along the rim of endocardium, then slowly from the endocardium toward the epicardium without initiating reentry (Fig. 10–4). In addition to these mechanisms of reentry initiation after several minutes of ischemia, we also showed that a transient prolongation of APD during the first 2 minutes of ischemia contributed to arrhythmogenesis, especially when combined with delayed INa inactivation by ATX-II.22
Figure 10–4.
Unidirectional block of the epicardially initiated activation and transmural asymmetry in conduction during acute global ischemia. The isolated ventricular wedge and the recording area were similar to those in Fig. 10–3. The wedge was stimulated alternately between the epicardium (Epi) and endocardium (Endo) at the red-dotted sites. Ischemia depresses tissue excitability more rapidly in the epicardium than in endocardium. After 505 seconds of ischemia (C), the epicardial-initiated activation penetrated the ventricular wall transmurally while failing to conduct laterally along the epicardium, and then conducted laterally in the endocardium and mid myocardium and reentered the epicardium. Endocardial stimulation, applied 525 seconds after ischemia (F), initiated activation that spread quickly along the endocardium, then transmurally to the epicardium without reentry. Therefore, ischemia-induced transmural gradient of excitability provided the substrate for reentry during epicardial stimulation. The recording area is 10 (transmural) by 18 (along the epicardium) mm2. Reproduced with permission from Wu J, Zipes DP. Transmural reentry triggered by epicardial stimulation during acute ischemia in canine ventricular muscle. Am J Physiol Heart Circ Physiol. 2002;283:H2006. See also Moving Image 10–4.
Unidirectional block of the epicardially initiated activation and transmural asymmetry in conduction during acute global ischemia.
Play Video
After 25 minutes of ischemia, the majority of the epicardium and mid myocardium was inexcitable, whereas the endocardium was still excitable during endocardial pacing. Reperfusion restored the perfusion flow uniformly. However, the recovery of tissue excitability was faster in the subendocardium and mid myocardium than in the deeply depressed subepicardium. During the first minute of reperfusion, the reappearance of excitability in the subepicardium was associated with APDs that were much longer than in the subendocardium. The transmural differences in reperfusion recovery produced an initial steep transmural gradient of APD, which was progressively reduced during further reperfusion. Unidirectional block of conduction, focal activations, and reentry occurred during the first minute of reperfusion. Sustained VT and ventricular fibrillation occurred after 93 ± 49 seconds of reperfusion (in two of the eight wedges reperfused at a quarter of the preischemia flow rate).
We concluded that transmural heterogeneity in the tissue responses to ischemia contributed to arrhythmogenesis during acute ischemia by providing steep transmural gradients of excitability and refractory period in which unidirectional block and reentry could occur easily. Transmural heterogeneity in reperfusion recovery contributed to reperfusion VT by providing a steep transmural gradient of APD and by promoting focal activation. The clinical implication is that the heterogeneic tissue responses provide a proarrhythmic substrate in which reentry appears to be a predominant mechanism of ventricular arrhythmias during and after global ischemia.
Spontaneous Arrhythmias in Tissues Recovered from Ischemia
Using optical mapping, we demonstrated a potential mechanism of arrhythmias in postischemia ventricular tissue. It is well known that myocardial ischemia can induce persistent proarrhythmic remodeling even after sufficient reperfusion. We investigated mechanisms of postischemia arrhythmogenesis in 10 isolated wedges of canine left ventricular free wall.23 Among the 10 wedges, 8 recovered well with return of both APD and velocity of conduction back to normal after 40 minutes of ischemia and 60 minutes of reperfusion. Subsequent perfusion with ATX-II (20 nmol/L) prolonged APDs significantly, induced EADs in all of the recovered wedges, and induced spontaneous VTs in seven of the eight recovered wedges. Focal EADs and reentry were responsible for 73% and 18% of the activations, respectively, in the VTs (Fig. 10–5). Changes in the EAD foci and conduction pathways altered the contour of the transmural ECG during VT. In comparison, a control group of eight ischemia-free wedges had less APD prolongation, less dispersion of repolarization, and no EADs or VT after the same ATX-II treatment. The exaggerated APD responses to ATX-II indicated a low repolarization reserve24 in the postischemia wedges, which provided a proarrhythmic substrate. Therefore, a brief period of ischemia, even after sufficient reperfusion recovery of AP and conduction velocity, can persistently suppress repolarization reserve with arrhythmic consequences. Clinical implications of this study would be that patients recovered from an episode of ischemia have an increased risk of arrhythmic episodes, which can be triggered easily by an APD-prolonging event.

