Fig. 10.1
Development and progression of osteoarthritis
The subchondral region bone plate is located deep to the articular surface, separated only by a thin layer of calcified articular cartilage (Fig. 10.2). When there is loss of the overlying cartilage, as in osteoarthritis, the subchondral bone is directly exposed to the stresses across the joint with subsequent trabecular collapse, flattening and eburnation (Fig. 10.3). Cartilage loss is discussed in greater detail in Chap. 3 and the Outerbridge classification of cartilage loss is outlined (see Table 3.5). The subchondral regions in areas of lower stress become increasingly vascularized. This stimulates endochondral ossification with new bone formation, osteophytes (Fig. 10.4). They are usually marginally growing as an extension of the joint margin. New bone formation may also occur centrally in areas of full cartilage loss and appear as new bone formation at the cortical surface, often with an irregular margin.
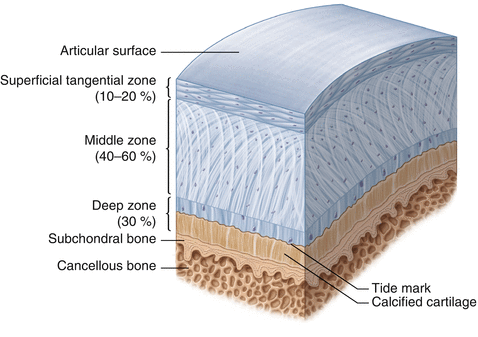
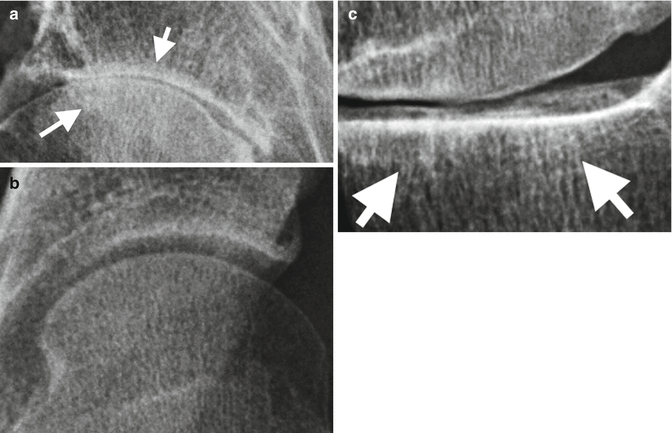
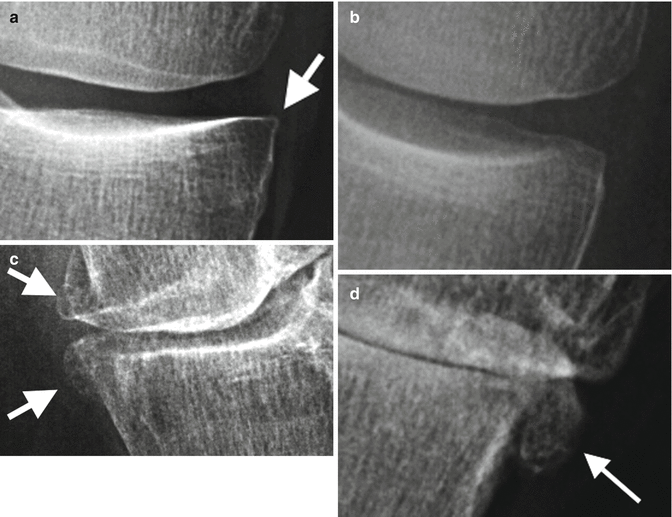
Fig. 10.2
Cartilage layers and subchondral bone
Fig. 10.3
Eburnation (arrows) on radiograph, (a) magnified AP subchondral region hip joint demonstrating increased subchondral sclerosis on both sides joint, (b) normal example for reference, (c) similar sclerosis secondary to degenerative disease medial tibiofemoral joint space
Fig. 10.4
Osteophyte on radiograph, (a) early osteophyte formation medial margin of the medial tibial plateau, (b) normal example for reference, (c) moderate and (d) large osteophytes (arrows)
Subchondral cysts develop between the deformed trabeculae in areas of eburnation (Fig. 10.5). They are of variable size. The overlying cortex may be intact or may have a focal defect allowing communication of the cyst with the joint space. Prominent subchondral cyst formation raises possibility of underlying crystal disease. Joint space loss has long been attributed to cartilage thickness; however, in the knee, meniscal degenerative changes can also contribute to narrowing. Marked joint space narrowing is seen in advanced disease (Fig. 10.6).
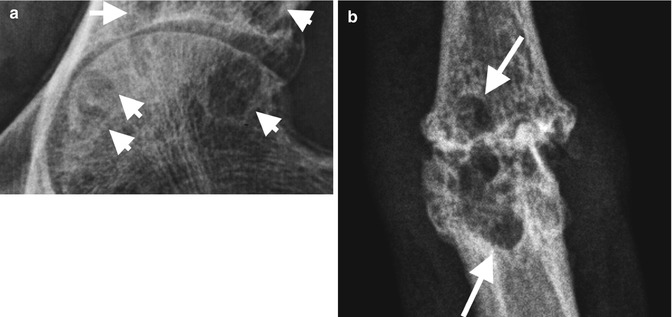
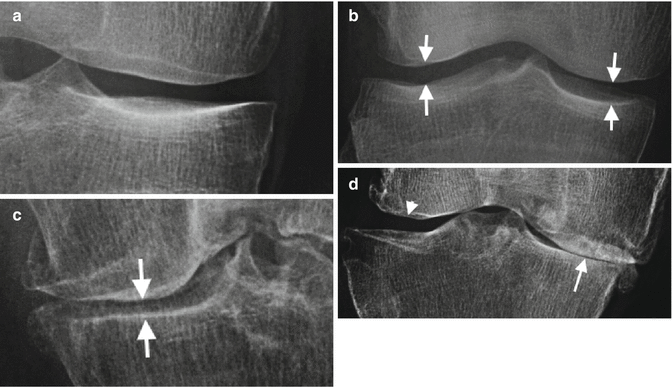
Fig. 10.5
Subchondral cysts (arrows) on radiographs, (a) well-defined subchondral lucencies with well-defined sclerotic margins in a degenerative hip joint (normal example for reference, see Fig. 10.3b), (b) large subchondral cysts in a degenerative PIPJ hand
Fig. 10.6
Joint space (arrows) loss on radiographs. (a) Mild medial tibiofemoral joint space loss, (b) normal example for reference, (c) moderate to severe, and (d) severe, almost complete, joint space loss medially; note maintained lateral tibiofemoral joint space (arrowhead). True joint space loss is best assessed on standing for weight-bearing joints
On radiographs eburnation is noted as subchondral sclerosis and may demonstrate flattening and collapse of its surface. Osteophytes are noted as new bone forming at the periphery of the joint space. Subchondral cysts are variable in size, have a thin sclerotic margin, and may demonstrate communication with the joint space, e.g., intra-articular gas may extend into the cyst. The overlying cortex is usually intact or demonstrates a focal defect. Occasionally it may be difficult to differentiate a subchondral cyst from an erosion if there is collapse of the cyst overlying cortical margin. Subchondral cysts are however associated with joint space loss, subchondral sclerosis, and osteophytosis. Additional studies other than radiographs are rarely required, and the above changes however can be detailed on other imaging modalities when performed for alternative indications.
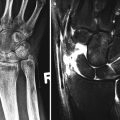
CT demonstrates exquisite detail of subchondral changes as described in the above radiographic findings; however, it is rarely required in the assessment of OA. CT is occasionally used for assessment of intra-articular loose bodies and residual bone mass, e.g., glenoid, prior to joint replacement (Fig. 10.7).
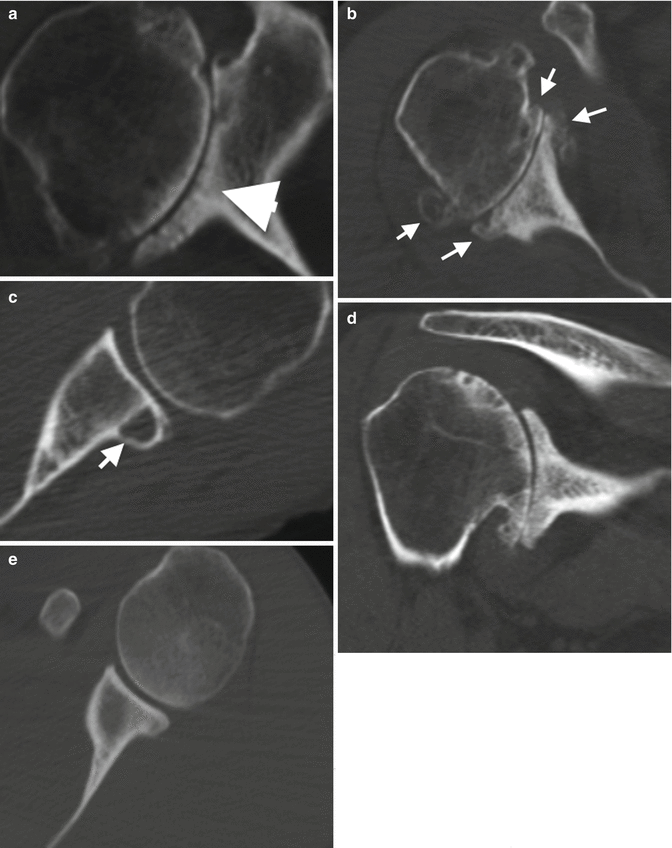
Fig. 10.7
CT secondary degenerative joint disease on the right shoulder. (a) Subchondral sclerosis/eburnation (arrowhead); (b) moderate osteophytosis (arrows); (c) subchondral cyst glenoid with well-defined sclerotic margins (arrow); (d) reformatted coronal image with joint space loss, subchondral sclerosis, osteophytes, and subchondral cysts; (e) normal axial CT for reference
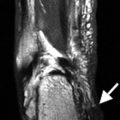
Subchondral sclerosis on MRI is of low SI on both T1- and T2-weighted sequences. Subchondral cysts may contain proteinaceous material or joint fluid if they communicate with the joint and are of high SI on T2 and usually low SI on TI. MRI is the gold imaging standard in assessing cartilage. Cartilage abnormalities include changes in signal intensity, fibrillation cartilage surface, fissuring eventually extending full-depth cartilage, and areas of full-thickness cartilage loss (Fig. 10.8). These are often the sites of associated subchondral cyst formation and bone marrow edema. MRI of joints also allows visualization of the soft tissues including ligaments, capsule, synovium, and bone marrow changes. It should be stressed however that although MRI is useful in detecting lesions that are not possible with radiographs, they may not add to the clinical picture when plain radiographs demonstrate osteoarthritic changes. Further imaging beyond radiographs in clinical practice should be considered when the results will affect the management of the patient.
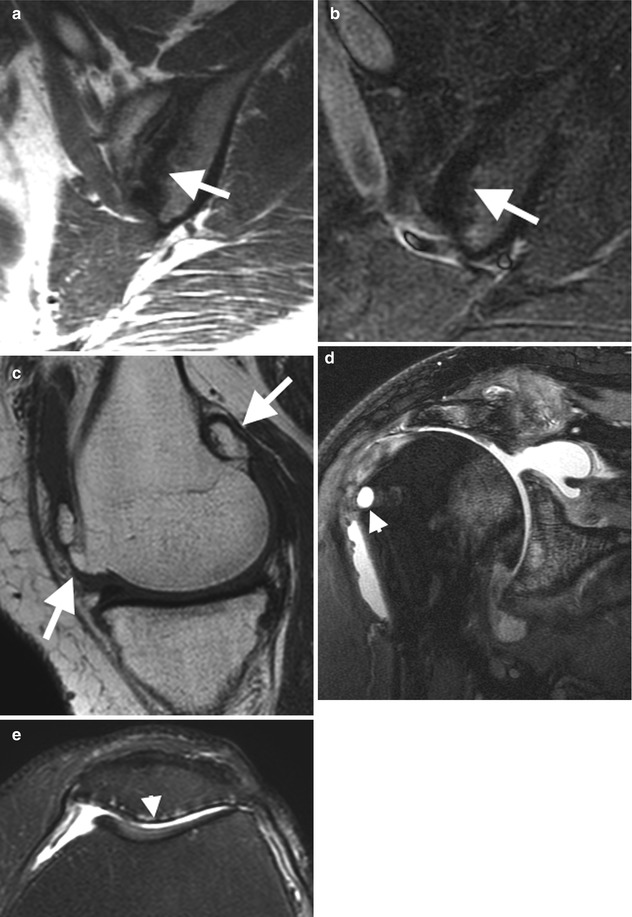
Fig. 10.8
MRI degenerative disease. (a) Subchondral sclerosis (low SI on all imaging sequences) left sacroiliac joint in patient with osteitis condensans ilii (OCI) with subchondral low signal (arrows) on Cor T1 and (b) Cor T2FS. (c) Moderate osteophytosis in medial femoral condyle on sagittal T1 (arrowheads), (d) rotator cuff arthropathy on the right shoulder with joint space loss, complete cartilage loss, subchondral bone marrow edema, and early subcortical cyst formation on Cor T2FS (arrowhead) low SI sclerotic rim on the greater tuberosity, (e) cartilage loss, full-thickness patellar aspect patellofemoral joint (arrowhead) with mild subchondral edema
There is an array of studies using MRI as a semi- and quantitative imaging tools in the assessment of osteoarthritis. These studies are focused predominantly on the knee, hand, and hip. The required high-resolution imaging required for detailed cartilage review is mainly confined to research studies at this time due both to the extended time required to acquire and interpret these sequences and whether these sequences affect clinical management beyond currently performed sequences. Ultrasound is used predominantly for assessment of joint fluid and synovitis. Ultrasound can also demonstrate associated changes such as joint space loss, cartilage thinning and loss in the periphery of superficial joints, cortical irregularity, and osteophytosis. Nuclear medicine is generally not indicated.
The description of osteoarthritis will be subdivided into primary OA of large and small joints with typical examples provided.
Osteoarthritis: Small Joints
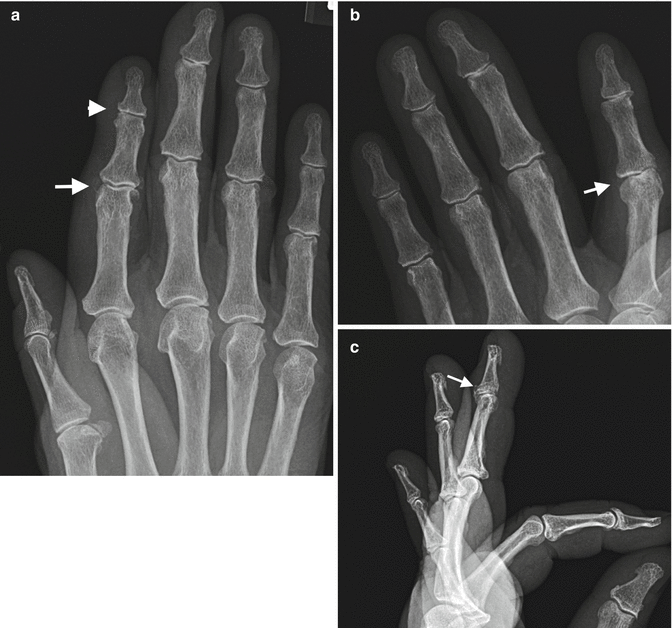
Osteoarthritis of the hand will be used to demonstrate the typical changes within small joints. The proximal and distal interphalangeal joints and the first carpometacarpal joint are the most commonly affected small joints. The PIP and DIP joints may demonstrate a symmetrical appearance in joints involved and the degree of osteoarthritis (Fig. 10.9). Localized bony outgrowths from the DIP and PIP joints are termed Heberden’s and Bouchard’s nodes, respectively. The joint spaces are narrowed with subchondral sclerosis. There may be mild radial or ulnar subluxation. Metacarpophalangeal joint involvement occurs usually in the presence of more advanced disease at the PIP and DIP joints. If disease is predominantly at the MCP joints, then one should consider alternative underlying pathology such as CPPD arthropathy and hemochromatosis.