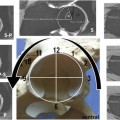
Fig. 12.1
Eight-year-old boy with right hip Legg–Calvé–Perthes (LCP). Coronal T1-weighted (a) and coronal water-sensitive (b) images of the hips demonstrate collapse of the right capital epiphysis with decreased SI centrally (arrows) compatible with necrosis. The proximal metaphysis demonstrates mild bone marrow edema. (c) Sagittal water-sensitive image clearly demonstrates a large cyst within the anterior aspect of the metaphysis (arrow)
Fat-Suppressed T1-Weighted Imaging
In the early stages of osteonecrosis, the marrow is of high SI, following the signal characteristics of fat and blood. Since the high SI most likely reflects stagnant blood, fat-suppressed T1-weighted images are valuable in detecting bone ischemia [23]. With ischemia, the SI will continue to be elevated even after fat suppression.
Perfusion Imaging
Static
Gadolinium-enhanced imaging is important in the diagnosis of ischemia at several stages of disease. In patients with unexplained hip pain, normal radiographs and normal or unclear unenhanced MR images, gadolinium-enhanced imaging can demonstrate lack of enhancement. The significance of this absent perfusion in a child is unclear, as it may indicate early LCP or an effusion with increased intrasynovial pressure interfering with epiphyseal perfusion (Fig. 12.2). In children with established osteonecrosis, gadolinium-enhanced imaging can demonstrate the pattern of epiphyseal reperfusion. When the femoral head is revascularized through the physis, the physeal neovascularity induces ossification and thus physeal bony bridging. Thus, transphyseal revascularization is related to a poor outcome [24, 25].
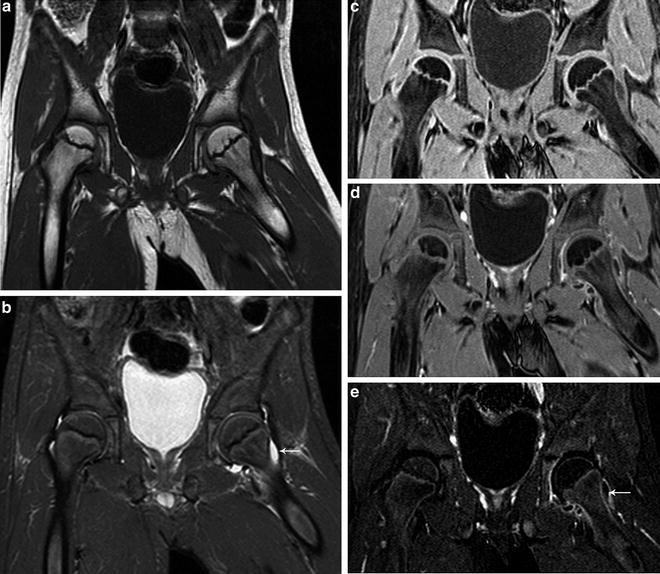
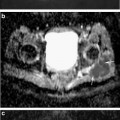
Fig. 12.2
Seven-year-old boy with left hip pain. (a) Coronal T1-weighted image of the pelvis shows normal bone marrow signal with fatty SI of the capital epiphyses which are rounded. (b) Coronal water-sensitive image shows a small left hip effusion (arrow) with normal bone marrow SI. Coronal T1-weighted fat saturated (c), T1-weighted contrast-enhanced (d), and subtraction views (e) show decreased perfusion of the left capital epiphysis with synovitis (arrow)
In adults, decreased bone marrow perfusion can be associated with increasing age and greater content of fatty marrow. Most of the gadolinium enhancement is attributed to the accumulation of focal inflammatory infiltrates, fibrocystic repair, and viable granulation tissue surrounding the necrotic areas [26, 27].
Dynamic
Dynamic contrast-enhanced MRI (DCE-MRI), although not routinely performed, may be useful to demonstrate the blood flow in bone marrow. In the initial phase of femoral head ischemia, there is constriction of arteries and decrease of blood flow. This is followed by reactive hyperemia and vasodilation that is associated with increased blood flow, which leads to increased intramedullary pressure, resulting in hip pain. Recent work by Chan et al. [28] has demonstrated that there is delayed perfusion of the femoral head with an increase in peak enhancement that correlates with the progression of the severity of osteonecrosis. This increase in peak enhancement with delayed perfusion of the proximal femur is attributed to an increase in the exchange rate between the extracellular space and the intertrochanteric plasma due to vascular stasis [29]. In symptomatic hips without abnormal SI on conventional T1-weighted and T2-weighted sequences, dynamic contrast is useful as it can demonstrate a delayed time-to-peak enhancement pattern, which can progress to early osteonecrotic changes evident on routine MRI sequencing on follow-up studies.
Diffusion-Weighted Imaging
Although very early epiphyseal ischemia briefly restricts diffusion, most patients with proximal femoral osteonecrosis present at a stage where there is cellular wall breakdown and increased diffusion. Therefore, the findings of epiphyseal osteonecrosis are better appreciated on apparent diffusion coefficient (ADC) mapping. Perfusion and diffusion convey a different degree of information over time regarding osteonecrosis. Whereas perfusion is initially decreased and later abnormally increased, diffusion increases rapidly and remains elevated throughout the disease [30]. There has also been interest in the metaphyseal changes that accompany LCP. In this disease, increased metaphyseal diffusion is associated with transphyseal reperfusion and increased risk of growth arrest [25, 31].
Staging of Osteonecrosis by MRI
It is imperative to accurately stage early lesions so that appropriate therapy can preserve the integrity of the hip joint [2]. The size of the osteonecrotic lesion inconsistently correlates with the patient’s severity of pain. There are many classification systems for staging femoral head osteonecrosis based on the conventional radiography/or MR appearance [32]. With conventional radiography, the most critical point in detecting osteonecrosis is the loss of the spherical surface of the femoral head. Other significant features are the size of the osteonecrotic region and the location of the lesion [4]. MRI is an extremely valuable modality in the evaluation of the early, pre-collapse stages and has many advantages over conventional radiography including its multiplanar imaging capability, ability to directly image the bone marrow, effectively evaluate the articular cartilage, and accurately assess the osteonecrotic head in relation to the acetabulum [4].
While Ficat and Arlet developed one of the first classification systems for femoral head osteonecrosis based on the conventional radiographic appearance [29], one of the earliest MR imaging classifications, developed by Mitchell et al., classified osteonecrosis based on the type of tissue that the ischemic bone resembles [17, 18]. In the earliest stage (class A), the signal resembles fat with hyperintensity on T1-weighted and intermediate signal on T2-weighted images. Class B demonstrates changes of hemorrhage with increased SI on T1 and T2-weighted images. The next stage (class C) shows fluid signal with hypointensity on T1-weighted and hyperintensity on T2-weighted sequences (Fig. 12.3). The most advanced stage (class D) exhibits signal characteristics of fibrous tissue with hypointensity on all sequences. This system was adapted into the University of Pennsylvania staging system [33], one of the most widely used classification systems [32]. The University of Pennsylvania classification system defines seven precise stages utilizing both conventional radiographs and/or MRI to characterize lesion size (Table 12.1). Using this system, a group of investigators from the Association Research Circulation Osseous (ARCO) developed subsequent classification models; however, there is no widely accepted osteonecrosis classification system at this time.
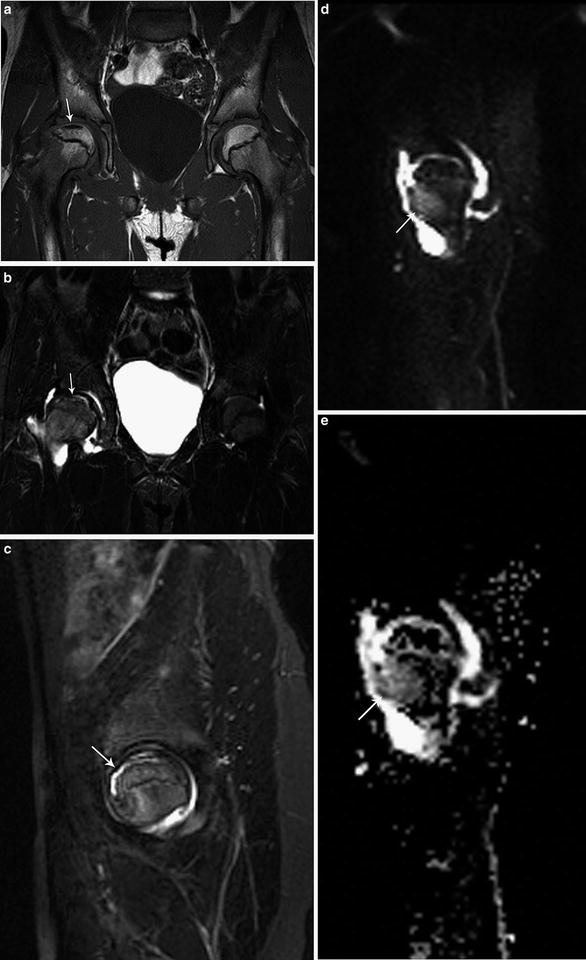
Fig. 12.3
Ten-year-old gymnast with right hip pain. (a) Coronal T1-weighted image of the pelvis demonstrates flattening of the right femoral head with linear subchondral SI. The left hip is normal. (b, c) Coronal and sagittal water-sensitive images show diffuse bone marrow edema with focal linear subchondral SI compatible with Class C changes. There is a moderate, reactive joint effusion. (d, e) Sagittal diffusion-weighted and ADC images demonstrate a region of increased diffusion within the anterior aspect of the proximal femoral metaphysis (arrows) which is associated with transphyseal reperfusion and increased risk of growth arrest in a child
Stage | Criteria |
|---|---|
0 | Normal radiograph, bone scan, and magnetic resonance images |
I | Normal radiograph. Abnormal bone scan and/or magnetic resonance images |
A: Mild (<15 % of femoral head affected) | |
B: Moderate (15–30 % of femoral head affected) | |
C: Severe (>30 % of femoral head affected) | |
II | Cystic and sclerotic changes in femoral head |
A: Mild (<15 % of femoral head affected) | |
B: Moderate (15–30 % of femoral head affected) | |
C: Severe (>30 % of femoral head affected) | |
III | Subchondral collapse without flattening (crescent sign) |
A: Mild (<15 % of femoral head affected) | |
B: Moderate (15–30 % of femoral head affected) | |
C: Severe (>30 % of femoral head affected) | |
IV | Flattening of femoral head |
A: Mild (<15 % of surface and <2 mm of depression) | |
B: Moderate (15–30 % of surface and 2–4 mm of depression) | |
C: Severe (>30 % of surface and >4 mm of depression) | |
V | Joint narrowing or acetabular changes |
A: Mild | |
B: Moderate | |
C: Severe | |
VI | Advanced degenerative changes |
Considerations Related to Specific Pathologies
Osteonecrosis During Treatment of Developmental Dysplasia of the Hip
The treatment of severe developmental dysplasia of the hip is based on immobilizing the hip in abduction. A reduced, stable femoral head continues to remodel the acetabulum. Unfortunately, maintaining the head in significant permanent abduction results in avascular necrosis in more than 20 % of cases. Since treatment in spica casts is often done before the appearance of the proximal femoral ossification center, MR imaging focuses on detecting abnormal blood flow to the cartilaginous femoral epiphysis. Immediately after placement of the spica cast, gadolinium-enhanced MR imaging can determine whether the femoral head is perfused. A normal pattern reveals enhancement of the vascular canals of the epiphyseal cartilage and of the primary spongiosa of the metaphysis [34, 35] (Fig. 12.4). A patchy pattern of enhancement appears not to have a predictive value for subsequent osteonecrosis. A global significant decrease or total absence of enhancement of the femoral epiphysis, however, is associated with a tenfold increase in the odds of developing avascular necrosis [36] (Fig. 12.5). The signal characteristics of the epiphyseal cartilage on T1-weighted and water-sensitive sequences do not change appreciably with early ischemia, and therefore contrast enhancement is necessary for early detection of ischemia.
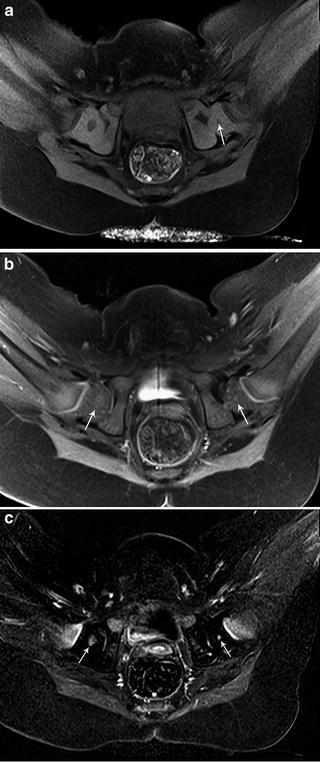
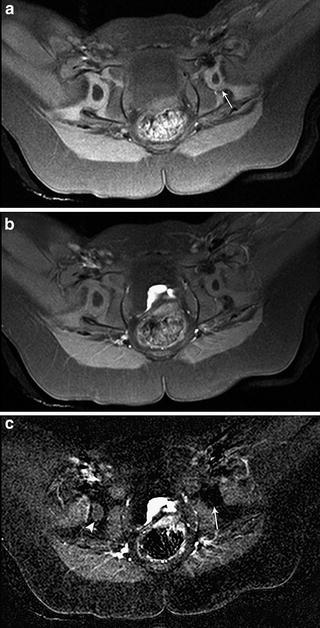
Fig. 12.4
Six-month-old girl with developmental dysplasia of the left hip status post closed reduction and SPICA cast placement with immediate MR imaging. (a) Axial T1 fat-saturated image shows a small left femoral head with shallow acetabulum. The left femoral ossification center (arrow) is smaller than the right. The right hip is normal. (b) Axial T1 fat-saturated post-gadolinium image shows symmetric enhancement of both ossification centers (arrows). (c) Axial subtraction images demonstrate symmetric enhancement of both femoral head ossification centers (arrows). Epiphyseal vessels can be seen as linear regions of enhancement within the cartilage of both femoral epiphyses
Fig. 12.5
Thirteen-month-old girl with developmental dysplasia of the left hip status post closed reduction and SPICA cast placement with immediate post-reduction MR imaging. (a) Axial T1 fat-saturated image shows a small left femoral head within a shallow acetabulum (arrow). The right hip is normal. (b) Axial T1 fat-saturated post-gadolinium image shows asymmetric appearance of the ossification centers with decreased SI on the left. (c) Axial subtraction images demonstrate non-enhancement of the left femoral head ossification center (arrow). No epiphyseal vessels are seen within the cartilage of the left femoral epiphysis. Normal enhancement of the right femoral head ossification center is present (arrowhead). The patient was subsequently recasted
MRI is performed in the supine position with a large multichannel flex coil placed over the spica cast. A complete perfusion protocol after closed hip reduction and SPICA cast placement includes coronal T2-weighted fat-suppressed images, axial T1-weighted fat-suppressed before administration of contrast, and axial and coronal postcontrast T1-weighted fat-suppressed images. Subtraction views are constructed in the axial plane. Images should be acquired as soon as possible after closed reduction (optimally within a 6 h period) to allow for manipulation or removal of the cast, if necessary. If the study is performed relatively soon after administration of general anesthesia, most infants are usually still sedated enough to comply with the MRI study. In addition, immobilization from SPICA cast placement further reduces the potential for motion artifact. No additional sedatives are needed to perform the study. Acquisition of the images requires approximately 20–25 min.
For open reductions, coronal T2-weighted fat-suppressed and axial T1-weighted fat-suppressed images are sufficient. We do not routinely evaluate perfusion with gadolinium-enhancement in these cases as it is expected that the surgical manipulation of the hip will alter the enhancement pattern of the femoral head.
Legg–Calvé–Perthes Disease
Most children presenting with LCP have abnormalities on MR imaging at presentation, even if the radiographs are normal. Four prognostic indicators in LCP include extent of osteonecrosis, lateral extrusion, physeal involvement, and metaphyseal abnormalities [37, 38]. Physeal abnormalities and metaphyseal cysts are believed to indicate subsequent growth disturbances and are predictors of poor outcome. In a study using multivariate analysis, the probability of subsequent growth arrest was 100 % when both epiphyseal and metaphyseal abnormalities were present, 75 % when only physeal interruption was present and 50 % when only metaphyseal cystic changes were detected [39]. Changes of LCP should not be confused with a femoral epiphyseal notch, a normal variant seen within the developing ossific femoral epiphysis [15]. The femoral epiphyseal notch is located along the vertex of the epiphysis and contains normal-thickness epiphyseal and articular cartilage with normal epiphyseal marrow SI (Fig. 12.6).
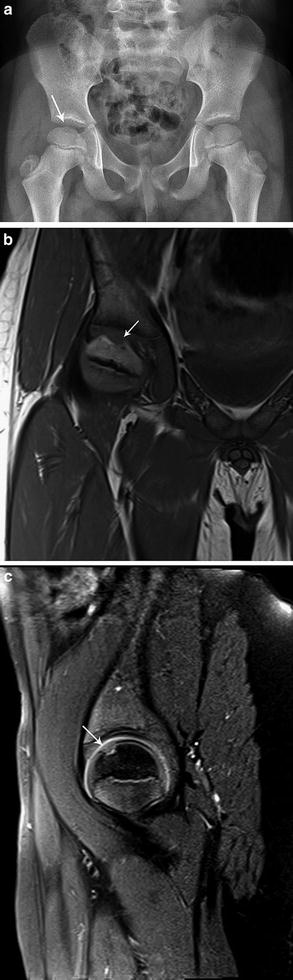
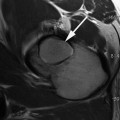
Fig. 12.6
Seven-year-old boy with right hip pain. (a) AP radiograph of the pelvis shows subtle lucency along the vertex of the right femoral head. (b) Coronal T1-weighted images show normal signal within the epiphysis with a notch at the vertex with intermediate SI compatible with cartilage (arrow). (c) Sagittal intermediate-weighted image shows normal bone marrow SI within the epiphysis and demonstrates normal thickness cartilage along the femoral head (arrow). No abnormality was seen within the right hip
An MRI protocol to evaluate for LCP should include images of both hips in order for the asymptomatic hip to serve as a control. MR imaging of the pelvis is best performed with the patient in a supine position. Children less than 7 years of age generally require sedation while older patients are much more likely to tolerate the MRI examination without medication. A body array coil or a cardiac coil is recommended and 3.0 T imaging is optimal. Precontrast and postcontrast images in several planes with contrast subtraction views in both the coronal and sagittal planes allows for evaluation of perfusion defects [24]. Coronal T1-weighted, and coronal fat-suppressed T1-weighted and T2-weighted images enable evaluation of the SI and morphology of the proximal femoral epiphysis as well as allowing for depiction of the relationship of the femoral head with respect to the acetabulum. Labral abnormalities, acetabular deformities, and joint fluid also can be assessed on coronal sequences. Sagittal T1-weighted fat-suppressed images are obtained to evaluate for the full extent of epiphyseal and metaphyseal involvement, particularly since abnormalities may be located very anteriorly within the epiphysis and metaphysis and therefore poorly evaluated on coronal images. In addition, sagittal precontrast T1-weighted images allow for creation of subtraction views postcontrast administration. Axial T2-weighted fat-suppressed imaging may be added to allow for more detailed evaluation of the hip musculature and pelvic anatomy. We acquire diffusion imaging in the sagittal oblique plane, which allows differentiation between epiphyseal and metaphyseal abnormalities while decreasing the susceptibility artifacts encountered during coronal and sagittal DWI (Fig. 12.7). Imaging acquisition should take approximately 35 min.
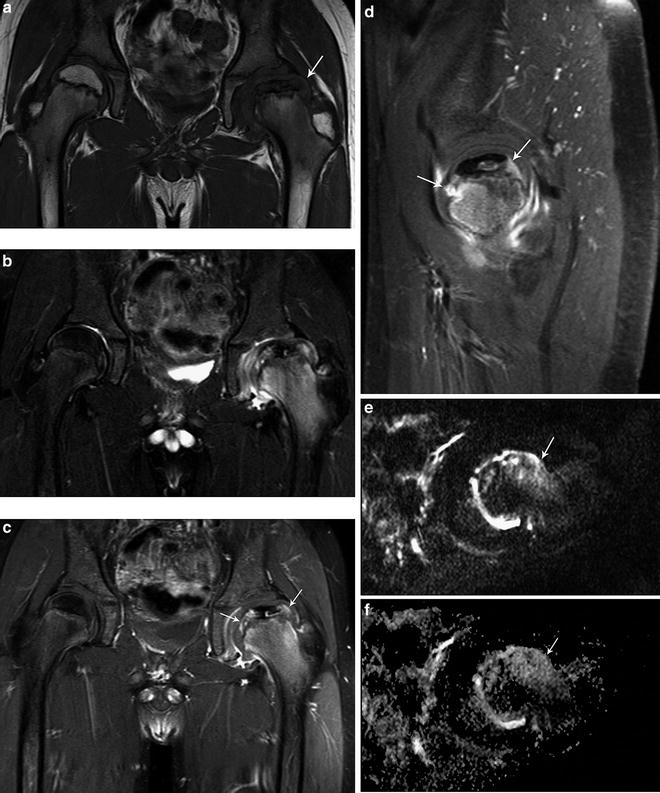
Fig. 12.7
Ten-year-old boy with left LCP disease. (a) Coronal T1-weighted image of the pelvis shows collapse of the capital epiphysis with central necrosis and lateral extrusion of the femoral head (arrow). The right hip is normal. (b) Coronal water-sensitive image demonstrates bone marrow edema within the proximal left femur with central necrosis and joint effusion. (c, d) Coronal and sagittal T1-weighted fat-suppressed postcontrast images demonstrate the full extent of metaphyseal changes with increased perfusion surrounding the region of the epiphyseal necrosis (arrows) and enhancement within the proximal metaphysis. Sagittal oblique diffusion (e) and ADC (f) images show increased diffusion within the anterior aspect of the proximal left femoral metaphysis (arrows) inferring a poor prognostic outcome
Slipped Capital Femoral Epiphysis and Acute Trauma
Osteonecrosis is a serious complication of slipped capital femoral epiphysis (SCFE) and the incidence of osteonecrosis varies depending on the stability and severity of the slip as well as the intervention employed [40]. The unstable slips, in which the patient is unable to bear weight, demonstrate the highest incidence of subsequent osteonecrosis. Radiographs and MR images demonstrate increasing collapse and loss of height of the epiphysis. MR imaging after pinning is limited by metallic artifact.
An acute Salter–Harris type 1 fracture of the proximal femoral epiphysis almost always results in avascular necrosis. Unlike SCFE, there is no time for the vessels along the femoral neck to adapt to the displacement of the head, and the femoral epiphyseal blood supply is usually interrupted acutely.
Septic Arthritis
Septic Arthritis occurs more often in infants, with most cases presenting in the first 5 years of life. The accumulation of joint fluid results in a rapid increase in intra-articular pressure. This leads to decreased epiphyseal perfusion (Fig. 12.8). In two series of children with septic arthritis [12, 41


Related posts:

Stay updated, free articles. Join our Telegram channel
Full access? Get Clinical Tree
