Fig. 24.1
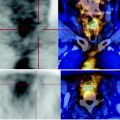
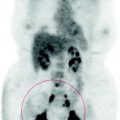
The PET shows high basal metabolism of glucose, multiple peritoneal nodules evident in the pelvis, on the surface of the liver and spleen, due to recurrence from illness (a). Follow up after chemotherapy (b) shows the incomplete response to treatment with persistent vitality of a peritoneal malignant nodule in the left obturatory region and a small mass adherent to the medial aspect of the spleen. Three months after chemotherapy, PET-CT showed a net progression of the disease (c)

Fig. 24.2
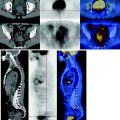
CT-PET performed before chemotherapy (a) shows peritoneal carcinomatosis with multiple nodules with high metabolism, some pelvic, other splenic adherent to the surface. At the scan done 3 months after chemotherapy, the CT-PET (b) shows the recovery of metabolic and morphological pathology in the same districts reported on previous examination

Fig. 24.3
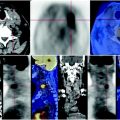
CT before chemotherapy shows two hypodense nodules at the falciform ligament in the II–III hepatic segment, that PET shows to have elevated glucose consumption


