DIFFUSE PARENCHYMAL DISEASES OF THE LIVER Ishan Kumar, Ashish Verma The hepatic parenchyma is the site for multiple essential, interrelated, and complex metabolic activities to assimilate nutrients, detoxify the body, and synthesize vital molecules such as enzymes, hormones, cofactors and essential components of the coagulation pathway. The chemical reactions involved in each of these activities pose a threat to the hepatocytes, which may be damaged leading to the initiation of reparative processes. Further, the liver, being a highly vascular organ with multiple metabolic activities, is liable to be involved in many systemic vascular and metabolic disorders. On one hand, such changes cause healing of the tissue injury, but on the other hand, lead to diffuse parenchymal changes, which may result in suboptimal functioning of the organ. Such a condition is labelled as ‘diffuse liver disease’ and includes (a) diseases caused due to storage of certain chemical products of such chemical reactions labelled as ‘storage disorders’, (b) diseases caused due to reduction of blood flow to the organ, (c) parenchymal injury due to stasis of bile at various levels in the pathway due to varied causes, and (d) involvement of liver in systemic or organ-based inflammatory disorders. The mainstay of diagnosis of diffuse liver diseases is the detection of alterations in the biochemical parameters in blood indicative of liver function, which however is nonspecific to various aetiologies. The diffuse liver diseases in children are quite different from those in the adult population and constitute mainly of congenital or inherited metabolic and vascular diseases as opposed to diseases of acquired aetiologies in the latter population. The gross and microscopic pathological changes are accordingly different in the paediatric population and may be utilized to add specificity to the biochemical indicators as far as aetiological diagnosis is concerned. The invasive and potentially hazardous sampling mandated for histological evaluation of liver parenchyma has been replaced by an array of imaging modalities in recent times. The present chapter presents a review of the currently available imaging modalities (viz. cross-sectional imaging modalities such as ultrasonography, computed tomography [CT] and magnetic resonance [MR] imaging) for evaluation of diffuse liver diseases along with the pertinent imaging features and guidelines for their rational use in various indications. Also a short review of certain key technical and technological details is included. Jaundice and hepatomegaly are the most common clinical manifestations of liver disease. Anorexia is a nonspecific sign, often present in acute or chronic liver disease. Jaundice is a sign of increased bilirubin content in the blood, that can exist in four forms: (i) unconjugated bilirubin bound to albumin, (ii) unbound unconjugated bilirubin, (iii) conjugated bilirubin and (iv) δ fraction. Direct fraction includes both conjugated bilirubin and δ bilirubin. Conjugated hyperbilirubinemia is due to decreased excretion by liver or biliary tract obstruction. Pruritus, spider angioma on face and neck, ascites, portal hypertension, botchy palmer erythema, subcutaneous xanthoma, gastrointestinal (GI) variceal bleed, encephalopathy, renal dysfunction and pulmonary involvement are manifestations of advanced cirrhosis. Evaluation of total serum bilirubin and its fractional analysis into indirect (unconjugated) and direct (conjugated and δ fraction) bilirubin helps to distinguish between elevation caused by haemolysis and that due to hepatic dysfunction or biliary obstruction. Elevations in alkaline phosphatase (ALP), 5′ nucleotidase, and γ-glutamyl transpeptidase (GGT) levels are an indicator of biliary obstruction. However, it should be noted that normal growing children have significant elevations of serum ALP activity. AST (aspartate aminotransferase) and ALT (alanine aminotransferase) are significantly raised in acute hepatitis. ALT rise disproportionate to AST rise is seen in viral hepatitis. A predominant rise in AST is seen in echovirus infection, various metabolic diseases or alcohol-induced hepatitis. These aminotransferases are also elevated in NAFLD/NASH. ALT/AST rise is less marked in chronic liver disease. PT-INR, serum albumin levels can evaluate the hepatic synthesis function. Hypoalbuminemia suggests a bad prognosis. γ-Globulin is elevated in autoimmune hepatitis (AIH). Alpha-fetoprotein is raised in hereditary tyrosinemia or hepatic neoplasms. Indications of liver biopsy in the paediatric age group include neonatal cholestasis, metabolic liver disease, NAFLD, congenital hepatic fibrosis, abnormal biochemical liver tests of unknown aetiology, intestinal failure associated liver disease, acute liver failure and liver tumours. Although biopsy of children and infants is considered a safe procedure, due to incidences of shock, the North American Society for Pediatric Gastroenterology and Nutrition (NASPGHAN) has recommended liver biopsy in children not to be necessarily performed as outpatient procedures. Sonography-guided percutaneous liver biopsy has been reported to be safer, more efficient, more comfortable and only marginally more expensive than blind biopsy. The use of coaxial technique, determination of the number of passes and use of track embolization were at the discretion of the interventional radiologists. In cases of uncorrected PT-INR elevation, transjugular liver biopsy can be performed. Ultrasound (US) is a valuable tool in the diagnosis and management of diffuse liver diseases. It provides useful information about the size, surface, parenchymal architecture, biliary channels and blood flow of the liver. US examination of the liver is performed in the supine position with a convex (5–7.5 MHz) probe. High-frequency (7.5–12 MHz) linear transducers can be used in young infants because of their small size. US examination can be completed with the colour Doppler technique and US elastography, if needed. CT protocol typically requires image acquisition during the multiple phases with a slice thickness of 5 mm or less and a pitch ranging from 1 to 1.5. Contrast injected is 2 mL/kg through manual or mechanical injection. The arterial phase begins at 10–15 seconds and the portal phase is at 20–40 seconds after contrast injection. Equilibrium phase is obtained at 3 minutes, when needed. MRI protocol to evaluate paediatric liver chiefly includes free-breathing sequences, due to the challenge offered by an inadequate breath-hold in these patients. Due to the same reason, motion insensitive single-shot HASTE sequences or motion insensitive T1-weighted spoiled GRE single-shot sequences are also widely utilized in paediatric MR examinations. In slightly older children with a relatively uniform breathing pattern, external trigger signals from a breathing belt, or navigator techniques may be used to overcome motion artefacts from breathing. T1- and T2-weighted turbo spin-echo (TSE) sequences and T2-weighted single-shot sequences in axial and coronal planes are initially acquired to evaluate the anatomy and screen for pathologies. This is followed by a gradient echo (GRE) images to examine vascular structures. Multiecho images with T1-weighting can be acquired to evaluate the fat content of lesions. Contrast-enhanced MRI with intravenous injection of gadolinium (Gd)-based contrast agent is performed as routine in cases with suspected portal hypertension or in any associated suspected neoplastic lesion. This is usually clubbed with MRA for vascular mapping. Arterial phase and portal phase should be acquired 10–15 seconds and 20–30 seconds, respectively after the start of contrast agent injection. GRE T1-weighted sequence should be repeated continuously four or five times to include achieve all phases of liver perfusion. Finally, steady-state imaging should be performed in the equilibrium phase (3 minutes) using T1-weighted and T1-weighted fat-suppressed imaging sequences. MRI contrast media should be administered with caution after evaluation of eGFR, and is safer than the iodinated contrast media needed for CT scan examination, and is hence preferred. Liver size measurement is commonly obtained in one of the two ways (a) an anterior to the posterior measurement of the liver in the midclavicular line, (b) a dome-to-tip longitudinal measurement of the liver in the midclavicular line. Table 9.8.1.1 provides suggested upper limit values of liver and spleen length for various paediatric age groups. Despite advances in 3D US, volume measurements of liver size have not been incorporated in the routine clinical practice because it is time-consuming, requires considerable skill and technically difficult fusion of multiple 3D sweeps. Nonalcoholic fatty liver disease (NAFLD) is referred to as triglyceride accumulation in hepatocytes and encompasses a broad range of clinicopathological entities ranging from simple steatosis, steatohepatitis to cirrhosis. Its worldwide reported prevalence is approximately 2.6%–10% in the general paediatric population and as high as 38% of obese children under the age of 19 years. In India, the reported prevalence is as high as up to 22% in the general paediatric population and up to 45% in obese and overweight children. Hepatic steatosis currently is the most common cause of chronic liver disease in paediatric patients. Table 9.8.1.2 highlights the causes of hepatic steatosis in paediatric age group. The pattern of injury is similar to alcoholic liver disease. Nonalcoholic steatohepatitis (NASH) constitutes a subset of NAFLD, ranging from simple steatosis to inflammation and fibrosis. NASH in children has two distinct histological subtypes. Type 1 NASH resembles adult subtype with macrovesicular steatosis, lobular inflammation, and ballooning degeneration and perisinusoidal fibrosis. Type 2 NASH shows steatosis with portal fibrosis and is present in younger children with increased severity of obesity. ALT can be normal in 20% of the patient with NAFLD and liver biopsy is the gold standard for diagnosis as well as a semiquantitative assessment of disease severity. In clinical practice, the diagnosis and monitoring of NAFLD largely rely on ultrasonography. Grade I fatty liver refers to diffusely hyperechoic parenchyma with a well-visualized diaphragm (Fig 9.8.1). Bright liver with loss of periportal echogenicity and indistinctly visualized vessels is referred to as grade II and blurring of the diaphragm is classified as grade III fatty liver. Limitations of the US are lack of objective quantification and diminished sensitivity in cases where biopsy-proven steatosis ratio is less than 30%. Moreover, hepatic fibrosis and inflammation in cases of NASH are sonographically indistinguishable from simple steatosis. Contrast-enhanced US can diagnose the presence of fibrosis in NAFLD, which is evident from the decreased accumulation of microbubbles in the liver parenchyma. The distinction between hepatic steatosis and fibrosis is important clinically, as fibrosis can progress to cirrhosis if left untreated. US elastography has emerged as a promising technique to screen the children with NAFLD to look for ongoing steatohepatitis/fibrosis. Transient elastography is the most popular elastography technique which has shown excellent accuracy in the adult population with chronic hepatitis. However, its accuracy in NAFLD is significantly lower and the data of effectiveness in the paediatric population is limited. Acoustic radiation force impulse imaging (ARFI) has been shown to have a good correlation with AST/ALT ratios in obese children with NAFLD. An ARFI elastography value of >1.19 m/s predicts NASH-related hepatic changes in these patients while a value >1.75 m/s is suggestive of cirrhosis. Another study on shear-wave elastography has shown a high correlation in paediatric NAFLD patients with biopsy-proven hepatic fibrosis. A value of >5.1 kPa strongly predicts the presence of fibrosis whereas a value of >6.7 kPa is suggestive of stage ≥F2 fibrosis (Brunt scoring system). CT is a common modality utilized for assessment of hepatic pathologies, however is seldom used for assessment of NAFLD because of the risk of ionizing radiation. On noncontrast CT, liver attenuation <40 HU or hepatic attenuation 10 HU lesser than that of the spleen is considered as a sign of steatosis. Recent literature advocates the utilization of MRI in the evaluation of NAFLD. Fat imparts high signal intensity to the liver parenchyma on T1-weighted spin-echo MR images while it is mildly hyper- to hypointense on T2-weighted images. Conventional spin-echo imaging is relatively insensitive to mild-to-moderate fatty infiltration of the liver. The most commonly employed technique for detection of steatosis is chemical shift imaging (Dixon technique or dual-echo method) which utilizes two sets of gradient-echo images of the liver, that is in-phase and out-of-phase. On in-phase echo-time, water and fat signals add whereas, on out-of-phase echo-time, water and fat signals cancel each other. In nonfatty livers, the signal intensity of the liver parenchyma is unchanged between in- and opposed-phase images whereas a fatty liver shows a notable reduction of signal intensity on the opposed-phase images. Iron deposition in the liver can interfere with the assessment of steatosis. MR spectroscopy has been one of the most reliable techniques for the evaluation of hepatic steatosis (Fig 9.8.1.2). Protons in water molecules resonate at 4.7 ppm while that in triglyceride molecules resonate predominantly at 1.3 ppm. Other smaller lipid peaks can be obtained at 0.9, 2.0, 2.2 and 5.3 ppm. In a healthy nonfatty liver no triglyceride peak should be present. The presence of fat can allow measurement of area under water peak versus area under fat peaks to procure hepatic fat fraction. Proton density fat fraction (PDFF) measurement by MRI is another promising objective technique for quantification of steatosis in the paediatric patient. PDFF is the ratio of the density of mobile fat protons and the total density of protons including that from triglycerides and mobile water. Magnetic resonance elastography (MRE) is suggested as a noninvasive tool to evaluate liver stiffness that correlates with the degree of fibrosis. The technique is based on measuring the propagation of shear waves through liver parenchyma. A cut-off value for liver stiffness of 2.27 kPa has been suggested to predict Ludwig grade 2 or higher fibrosis. The technique depends on measuring the propagation of shear waves through the hepatic parenchymal fibrosis and differentiation of low-grade fibrosis from high-grade and also it may be feasible to distinguish steatosis from steatohepatitis. Success rate and accuracy of MRE is higher than US-based transient elastography. Cirrhosis is referred to as diffuse end-stage chronic liver disease characterized histologically by fibrosis and nodular regeneration, along with the disorganization of liver architecture. Although various underlying aetiology can lead to cirrhosis in children (Table 9.8.1.3), the most common causes in India are posthepatitic cirrhosis, Wilson’s disease (WD), AIH, biliary cirrhosis, biliary atresia and other metabolic diseases. In 5%–15% cases, the cause of cirrhosis may remain undetermined and is known as cryptogenic cirrhosis. Imaging is central to the diagnosis and management of children with cirrhosis (Fig 9.8.1.3). The role of imaging extends from diagnosis of cirrhosis to identification of complications and detection and characterization of nodules in cirrhotic liver. The imaging findings consist of changes in liver morphology, parenchyma and contour of the liver, vascular changes including portal hypertension, liver nodules and other complications of cirrhosis. Cirrhosis can lead to volume redistribution, which can be evaluated using either the US, CT, or MRI. Signs of early cirrhosis are atrophy of the segment IV, evident on imaging by increased fat segment IV and portal vein and between segment IV and left lobe. Signs of advanced cirrhosis are atrophy of the right lobe and segment IV with compensatory hypertrophy of left lobe and caudate lobe and fatty expansion of GB fossa. In some patients, a sharp notch is seen in the posterior surface of the liver (segment VI/VII). Some aetiology of cirrhosis may have different patterns of volume redistribution such as atrophy of left lobe and posterior segments in primary sclerosing cholangitis, diffuse hypertrophy in primary biliary cirrhosis, and absence of caudate hypertrophy in WD. The US can detect changes in liver segmental volumes based on linear measurements. C/RL (caudate/right lobe) ratio >0.65 calculated by comparing the transverse length of caudate and right lobe at the portal bifurcation, is a sign of cirrhosis. CT/MRI-based segmental volumetric analysis can reflect the morphological changes more effectively. Liver parenchyma in children appears as isoechoic to hypoechoic compared to the renal cortex in the US. The neonatal liver may reveal a bright echotexture. Hyperechoic parenchyma is seen in the fatty liver or liver fibrosis. Cirrhosis is seen as coarse and heterogeneous parenchyma. The liver surface in normal children appears as a hyperechoic, straight and regular line. The liver surface with diffuse irregularity or nodular surface is present in cirrhosis. CT and MRI in frank cirrhosis can reveal heterogeneous parenchyma along with the irregular surface. Diagnosis of early cirrhosis and fibrosis cannot be reliably made by the US where parenchyma may appear within normal limits. Similarly, CT and conventional MR sequences are also insensitive in early cirrhosis although early fibrosis can be seen as T1 hypointense/T2 hyperintense areas on MR and may show subtle enhancement. These T2 hyperintensities can be present as perilobular bands, perivascular cuffing, bands surrounding regenerative nodules, patchy fibrotic areas, or diffuse reticulation (honeycomb pattern). The role of US elastography and MR elastography is increasing in paediatric liver diseases for the detection of fibrosis and early cirrhosis and has been discussed in the previous section. US examination should be complimented with Doppler of the portal vein and hepatic veins if US features are suspicious of cirrhotic or fibrotic changes. The diameter of the portal vein increases with age. The mean diameter of the portal vein is 3.5 mm in children <5 years, 6.3 mm in 6–12-year old children, and 7–11 mm in >12-year-old children. Portal vein diameter is increased in portal hypertension; however, no reliable age-dependent cut-off values exist for the PV diameter in the diagnosis of portal hypertension in paediatric patients. Peak portal vein velocity in the paediatric age group is usually above 20 cm/s in a nonfasting child (15 cm/s in term neonate) along with some respiratory undulation. Peak portal vein velocity <16 cm/s in the paediatric age group is suggestive of portal hypertension. In term neonates, the values are above 15 cm/s. An increase in pulsatility of the portal vein (PI < 0.5) suggests portal hypertension. Reversal of portal vein flow (hepatofugal flow), presence of periportal collaterals or portal cavernoma, umbilical vein recanalization and various other collaterals are other signs of portal hypertension. Hepatic veins should be evaluated to rule out Budd–Chiari syndrome. CT or MR portal venography can comprehensively assess the extent and anatomical location of portosystemic collateral vessels in children with liver cirrhosis. Four groups of collateral channels can be identified: (a) periportal collaterals and portal cavernoma, (b) collaterals draining into SVC, that is left gastric vein (coronary vein), short gastric vein, oesophageal and paraoesophageal collaterals, (c) collaterals draining into IVC such as paraumbilical vein and abdominal wall collaterals, splenorenal and gastrorenal collateral, (d) mesenteric, retroperitoneal and haemorrhoidal collaterals. Various nodules can be seen in the cirrhotic liver including regenerative nodules, dysplastic nodules and HCC. The US is not sensitive in identifying these nodules and high-frequency linear-array transducer can contribute to their detection. CT and preferably MR can be used to characterize these nodules. Table 9.8.1.4 summarizes the imaging findings of these nodules on CT and MRI. It should be noted that HCC is rare in young children although it has been reported in children younger than 5 years in progressive familial intrahepatic cholestasis (PFIC) and Byler disease, biliary atresia. Recognizing the need for paediatric-specific guidelines for standardized interpretation and reporting CT and MR, ACR – LI-RADS (Liver Imaging Reporting and Data System) committee has convened the Pediatric LI-RADS Working Group in 2017. Hepatorenal fibrocystic diseases (HRFCDs) are developmental abnormalities of the liver and portobiliary system with associated fibrocystic degeneration of the kidneys. HRFCDs belong to the larger group of disorders collectively referred to as ‘ciliopathies’ a term describing the group of disorders affecting primary cilia which are an organelle present within the cholangiocytes. The ciliopathies in the liver is manifested as ductal plate malformation. Ductal plate is the embryonic precursor of the intrahepatic bile ducts and their abnormal development leads to cyst formation and alteration in portal venous development. Two major disorders are included in these malformations: (i) congenital hepatic fibrosis (affecting small intrahepatic ducts) and (ii) Caroli’s disease (affecting larger ducts). A combination of the CHF and CD is known as Caroli’s syndrome. Liver function test results in DPM may remain normal or be only modestly elevated. Few of congenital cystic liver pathologies are not associated with ciliopathies, such as autosomal-dominant polycystic liver disease (ADPLD) and portal fibrosis associated with congenital disorder of glycosylation (CDG) type Ib. Tables 9.8.1.5 and 9.8.1.6 innumerate the renal diseases and syndromes associated with ciliopathies. Carbohydrate-deficient glycoprotein syndrome type 1b Renal–hepatic–pancreatic dysplasia Oral–facial–digital syndrome type I US is the first-line modality, which can detect the distinctive morphological features of CHF that includes left lobe (segments II and III) hypertrophy, normal or hypertrophies segment IV, and atrophied right lobe. Preservation of the volume of the left medial segment is a feature that distinguishes CHF from cirrhosis resulting from viral hepatitis. The US can also detect changes in parenchymal echotexture, presence of splenomegaly, and can identify the evidence of cystic disease in the kidneys. Portal hypertension is one of the common presenting features of CHF despite normal hepatic lobular architecture and normal hepatic function. Application of the Doppler technique can detect the features of portal hypertension and cavernomatous transformation of the portal vein which can be present in up to 50% of the cases of DPM. The portal vein shows abnormalities in its ramification pattern with numerous, hypoplastic branches which are closely spaced, referred to as ‘pollard willow’ pattern. Studies have also shown enlarged hepatic artery and regenerative nodules in the arterialized hepatic parenchyma. In cases of Caroli’s syndrome, the US can easily identify cystic lesions or dilated intrahepatic bile ducts and can detect the stones in the ducts. Intraductal bridging (echogenic septa) can be seen traversing the dilated biliary duct lumen. Occasionally, the US can identify small portal venous branches surrounded by dilated biliary duct. Because of the absence of risks of ionizing radiation, US is the modality of choice in these children for long-term follow-up. CT can comprehensively demonstrate the morphological changes of CHF. Segmental computer-aided volumetric analysis of the hepatic parenchyma can identify the volume distribution with higher accuracy compared to the US. CT can also detect the parenchymal changes with higher sensitivity than the US. CT in these patients shows heterogeneously enhancing liver parenchyma, volume changes, and complete vascular mapping of the abdomen in cases of portal hypertension, identifying the portosystemic collaterals. Periportal cuffing can be identified on CT, indicative of periportal fibrosis. In Caroli’s disease, CT shows segmental and noncontinuous, saccular or fusiform dilatation of intrahepatic biliary radicals with the central enhancing dot representing portal vein branches (Fig 9.8.1.4). CT can identify the communication of the cyst with IHBD, differentiating them from PCLD. CT can also better detect the complications of CD such as cholangitis abscesses and cholangiocarcinoma. Seven per cent of the patients of CD can develop cholangiocarcinoma. MRI and MRCP seem to be a sensitive method for revealing biliary and renal abnormalities associated with congenital hepatic fibrosis and CD, even when sonography findings are normal (Fig 9.8.1.5). The parenchymal changes and heterogeneous architecture along with periportal fibrosis can be demonstrated on T2-weighted images, revealing hyperintensity along the portal vein and its branches. Regenerative nodules can be identified on T2-weighted and contrast-enhanced MRI. MRCP can delineate the communication between the cystic lesions and the biliary tree in cases of CD. Contrast-enhanced MRI can aid in the detection of complicating malignancies which can have a wide range of radiological appearances such as focal hepatic mass, intraductal mass, or biliary stricture. Multiplanar capability of MRI can enable its utility for preoperative planning in the affected children obviating the need for invasive preoperative cholangiogram to demonstrate the anatomy of the biliary tree. The differential diagnosis of Caroli’s disease is ADPLD, Von Meyerberg complex, choledochal cyst, sclerosing cholangitis, recurrent pyogenic cholangitis and peribiliary cysts. PCLD is seen on imaging as more than 20 round and smooth cysts without any communication with the biliary tree. Biliary hamartoma (Von Meyerberg complex) are seen as multiple/unique round uniform small cysts measuring 1–3 mm located close to portal tracts. Recurrent pyogenic cholangitis presenting with intra- and extrahepatic biliary dilatation is the most difficult diagnosis to exclude on imaging, however, the presence of saccular dilatation favours the diagnosis of Caroli’s disease. It should be noted that up to 20% of the cases of Caroli’s disease may have associated extrahepatic bile duct dilatation mimicking choledochal cyst and Caroli’s disease may even coexist with choledochal cyst. The presence of diffuse fusiform dilatation of the extrahepatic duct with less than 3 cm diameter combined with the characteristic intrahepatic ductal findings may help differentiate patients with Caroli’s disease from patients with a choledochal cyst associated with intrahepatic biliary dilatation. Routinely 1–2 mg of iron is absorbed by the intestine in a healthy child. Iron is recycled by extravascular haemolysis in the liver to meet the required amount (25 mg) in the spleen and bone marrow through Kupffer cells. Excess iron is bound to ferritin and hemosiderin in the hepatocytes. Excess iron in the body may be deposited in the liver, spleen, lymph nodes, pancreas, kidneys, pituitary, myocardium and GI tract. Up to 10–20 mg of excess iron does not cause tissue damage, in which case the term haemosiderosis is applied. Functional and structural impairment of the tissues occurs if the iron load (50–60 g) exceeds the compensatory mechanisms. In these cases, the term hemochromatosis is applied. Primary hemochromatosis is a genetic disorder occurring through mutation in the HPE gene which causes increased absorption of iron through the intestine. The secondary nongenetic form is more common and is caused due to multiple blood transfusions (transfusional haemosiderosis) in haematological disorders such as myelodysplastic syndrome, aplastic anaemia, beta-thalassemia major (transfusion haemosiderosis). Prolonged and excessive iron deposition can lead to endocrine abnormality, cardiac failure and liver parenchymal disease. Liver biopsy was considered as a reference standard for the detection and quantification of iron overload in hepatic parenchyma. However, it is largely replaced by radiological techniques because of the invasive nature and small size of sampled tissue while doing a single-site biopsy. The US cannot detect the features of iron overload in the liver parenchyma; however, it can be useful in detecting the complications of iron overload such as cirrhosis, hepatocellular carcinoma (HCC) or features of portal hypertension. CT scan is also of limited utility in hemochromatosis. Attenuation of >65 HU (15–130) with low attenuation of hepatic vessels relative to liver parenchyma on noncontrast CT is suggestive of iron overload, however can also be seen in WD, glycogen storage disorder, long-term amiodarone administration. MRI is the primary radiological modality used for diagnosis of iron distribution, quantification and monitoring of treatment response in liver iron overload (Fig 9.8.1.6). Various MRI techniques have been devised for iron overload estimation. This technique compares the signal intensity of liver parenchyma with the signal intensity of paraspinal muscles, which are assumed to be unaffected by iron content. GRE sequences are obtained with TR of 120 ms, flip angle 200, and varying TE of 2, 4, 9, 14 and 20 ms. Three ROIs of 1–2 cm are drawn in liver parenchyma and one on each paraspinal muscles. Liver iron concentration can then be obtained using a free online calculator provided by the University of Renne. Images are obtained with TR 2500 ms, flip angle 900 and variable TE of 6, 9, 12, 15, 18 ms. The images can be used to draw automated ROI covering the right lobe of the liver (excluding vessels) in the largest area and a T2 map of the same images can be generated. The technique quantifies the T2 shortening due to proton exchange between bulk water and exchangeable protons in ferritin. T2* takes into account the contributions of the T2 (1/R2) effects and the microscopic inhomogeneities introduced in (B0) by the hemosiderin clusters. For T2* measurement single breath-hold multiecho GRE sequences with TR of 25 ms, flip angle of 20 degrees, TEs every 0.25 ms from 0.8 to 4.8 ms are obtained. R2 * (1/T2*) values can be generated with ROI drawn from a single midhepatic section by drawing an ROI following the boundaries of the liver and excluding hilar vessels. Liver iron concentration can be obtained using a formula: [Fe] = 0.202 + 0.0254 R2*. This technique detects the enhancement in the local magnetic field caused due to ferritin or hemosiderin using a 3D breath-hold multiecho GRE sequence with the use of chemical shift–encoded water/fat separation, T2*/R2* mapping, and B0 field mapping. A quantitative susceptibility map of the parenchyma is generated. A local relative susceptibility value (ΔB0) is obtained drawing ROI which is expressed in parts per million (ppm), related to local iron deposition. With the ongoing research, stress is being placed upon the multiparametric quantitative MR imaging protocol which includes MR elastography (for fibrosis), multiecho chemical shift–encoded GRE to measure proton-density fat fraction (for steatosis quantification) and R2* relaxometry (for iron overload estimation). Hepatic iron overload has been shown to predispose to the development of HCC in the younger age group. The detection of HCC in the setting of iron overload is less difficult on T2-weighted sequences because the presence of iron behaves like a nonspecific contrast medium, such as superparamagnetic iron oxide (SPIO). However, care should be taken while evaluating these lesions, which may appear like hepatic cyst or haemangioma. Any nodule detected in these patients should be evaluated and characterized by the use of intravenous gadolinium contrast. The liver processes various metabolic processes of the body and hence it can be affected by multiple inherited metabolic disorders. The affection of the liver in these disorders may be in the form of hepatomegaly, cholestasis, acute liver failure or hepatic encephalopathy. WD is an autosomal recessive disorder of copper metabolism, first described in 1912 by Samuel Kinnier Wilson. The primary defect is a genetic abnormality located at chromosome 13 and q14.3, coding for copper-transporting P-type ATPase. An average diet contains 3–5 mg copper, 40% of which is absorbed in the upper GI tract and which is almost completely excreted in bile. The genetic defect leads to abnormality in this excretory function that leads to copper accumulation in the liver and other organs and tissues including brain and cornea. Liver disease in WD can range from asymptomatic transaminasemia, acute or chronic hepatitis, fulminant hepatic failure, and cirrhosis. WD can be misdiagnosed as AIH because both can result in similar autoantibodies. Imaging findings of liver manifestations can be categorized into four groups: (i) morphological changes, (ii) parenchymal changes, (iii) perihepatic changes, (iii) other findings. On CT, copper deposition in the liver may present with increased attenuation of the hepatic parenchyma, however, associated hepatic steatosis can decrease the overall attenuation which is within normal limits in most of the patients. Contrast-enhanced CT can show hypodense as well as hyperdense nodules and surface irregularity. The disappearance of hyperdense nodules has been documented after penicillamine therapy. Various MRI features of liver disease in WD has been described in the literature that includes (a) T1 hyperintense/T2 hypointense nodules (2 mm to 1 cm), (b) T1 hypointense nodules, (c) multiple hyperintense septae leading to ‘honeycomb pattern’, (d) high-intensity septa, (e) absence of parenchymal changes on MR. 31P MR spectroscopy of the liver in WD can show elevated phosphomonoester (PME) resonance and reduced phosphodiester (PDE) resonance, which have been shown to normalize after penicillamine and vitamin K therapy. Gaucher disease (GD) results from a deficiency of lysosomal enzyme β-glucocerebrosidase leading to the accumulation of ‘Gaucher cells’ in various organs. Imaging can help in the detection and characterization of liver infiltration, hepatomegaly, fibrosis, cirrhosis, iron deposition and HCC, all of which are associated with GD. On imaging, hepatosplenomegaly is the hallmark of GD (Fig 9.8.1.7). Recent literature recommends the utilization of CT or MRI over the US for volumetric assessment of liver and spleen sizes in GD with the expression of liver volume as multiples of normal volume (MN). Weight-based formula is used for calculation of liver and spleen volumes: normal liver volume (mL) = 25 × weight (in kg) ; and normal spleen volume (mL) = 2 × weight (in kg). A target liver volume of 1–1.5 MN and a spleen volume of 2–8 is aimed by the therapeutic regimens. On MRI, low ADC of liver and spleen indicates greater infiltration and worse prognosis, with ADC values correlating with chitotriosidase levels. Fibrosis can be detected and quantified using US shear-wave elastography, MR elastography, and nonimaging–based transient elastography. Studies have indicated the presence of liver iron deposition in GD due to associated hyperferritinemia, which can be quantified using R2* relaxometry. Hepatic nodules can be identified on imaging on GD. Most commonly these nodules represent a focal accumulation of Gaucher cells and are known as ‘Gaucheroma’. These lesions are hyperechoic on the US, hypoattenuating on CT, T1 hypointense/T2 heterogeneous nodules on MRI. These lesions do not merit biopsy; however, care should be taken to identify the lesions suspicious for HCC, that is large, irregular, hypoechoic, hypervascular lesions, which mandate further evaluation by multiphasic contrast CT or MRI. Besides the liver, evaluation of abdominal imaging should attempt to detect changes in spleen and visualized bones. GD in the spleen can manifest with splenomegaly, fibrosis, nodules, subcapsular infarcts and splenic necrosis. Osseous features of GD are osteopenia, osteonecrosis, pathological vertebral fractures and Erlenmeyer flask deformity. These are a group of disorders caused by defects in metabolism or storage of glycogen which broadly present with hepatic, myopathic, cardiac or other manifestations. GSD type I (Von Girke disease) presents with hepatic involvement. The US in these patients shows hyperechoic liver parenchyma because of fatty replacement and glycogen deposition. CT shows variable attenuation because hepatic attenuation is increased by glycogen and decreased by steatosis. There is a well-known association with GSD and hepatic tumours such as adenoma, focal nodular hyperplasia and HCC (rare). Adenomas are the most common tumours in GSD which show variable echogenicity. These lesions may contain fat, haemorrhage, or rarely dystrophic calcifications. A fat component can be detected using chemical shift MRI. These lesions should be monitored serially and malignancy should be suspected in case of rapid growth. α1-Antitrypsin deficiency is a rare autosomal recessive disorder that can cause chronic severe paediatric liver disease. In infants, this disorder can have a presentation similar to biliary atresia or idiopathic neonatal hepatitis. Moreover, scintigraphy cannot distinguish between biliary atresia, because similar to atresia, it can show uptake by hepatocytes and absence of biliary excretion due to paucity of lobular biliary ducts. The US in the neonatal period can help distinguish between the two, as it shows normal gallbladder and hepatic parenchyma. Older children may show imaging evidence of hepatic fibrosis or cirrhosis. MR elastography in this disorder is accurate for identifying fibrosis with a cut-off value of >3 kPa predictive of fibrosis. Various systemic illnesses can present with liver disease. The table summarizes the hepatic manifestations of various systemic liver diseases. TABLE 9.8.1.7 Paediatric diffuse liver diseases though forming a small subset of overall morbidity in children pose a formidable challenge for diagnosis as most cases present at a relatively early age. Imaging in these cases aims to make an aetiological diagnosis and rule out any associated complications, as the initial diagnosis is usually established by the biochemical analysis of liver function. Screening sonography usually forms the initial screening modality with MRI being the next stop problem-solving modality. CT scan has taken a back seat in current practice due to radiation exposure and the need to inject iodinated contrast media, both of which can be obviated by MRI. The former modality however remains essential in case an interventional procedure to treat portal hypertension is contemplated or percutaneous sampling from areas difficult to access by sonography is to be done. With the availability of an array of imaging modalities, it remains essential for an imaging expert to be clear as far as the choice of modality and order of its usage during the course on management is involved so that the most optimum imaging protocol can be offered to the patient. PEDIATRIC BENIGN HEPATIC MASSES (INCLUDING INFECTIONS) Kushaljit Singh Sodhi, Anmol Bhatia, Akshay Kumar Saxena Liver neoplasms constitute around 2% of all neoplasms seen in the pediatric population, and around 6% of the total abdominal neoplasms. Only one-third of the liver tumours in children are benign, while two-thirds are malignant. Benign hepatic tumours in children include lesions which are specific to children like mesenchymal hamartomas and vascular tumours, and the lesions that are also seen in adult population, such as adenoma, focal nodular hyperplasia (FNH) and nodular regenerative hyperplasia (NRH). Further, benign hepatic lesions affecting children include a wide variety of infections of bacterial, fungal and parasitic origin. In the present chapter, we will be discussing about the benign hepatic tumours and hepatic infections commonly seen in the pediatric population. A wide variation has been reported in the use of terminology for the hepatic vascular malformations in literature. According to the standard nomenclature adopted by the International Society for the Study of Vascular Anomalies (ISSVA), liver vascular tumours in children are termed as liver hemangioma. Liver hemangiomas in children are classified as infantile and congenital. Infantile hemangiomas usually begin to grow after birth, continue to grow during the first year of life and enter an involuting phase between 1 and 7 years. These tumours are positive for glucose transporter-1 protein (Glut-1), a protein that facilitates the transport of glucose across erythrocyte cell membranes. On the other hand, congenital hemangiomas are fully developed at birth and are characterized by Glut-1 negativity. These are further subdivided into a rapidly involuting group and a noninvoluting group, with some overlap between these groups. Hemangioma is a model of the angiogenesis concept proposed by Folkman et al and its development is related to a combination of upregulation of factors that promote angiogenesis and downregulation of its inhibitors. Most of these tumours are diagnosed in the first year of life, with these being slightly more common in females. Most commonly, these present as an asymptomatic mass in abdomen; however, associated life-threatening presenting complications have also been reported. These include high-output cardiac failure as a result of large arteriovenous shunts or Kasabach–Merritt syndrome of coagulopathy, severe hypothyroidism and acute hemoperitoneum due to tumour rupture. Lesions can be focal, multifocal or diffuse. Multifocal lesions are usually small and homogenous in appearance, while larger lesions may show areas of hemorrhage, calcification, fibrosis and necrosis. The liver is grossly enlarged in diffuse disease, which may cause mass effect on surrounding organs and vessels. Multifocal lesions frequently are associated with multiple cutaneous infantile hemangiomas with a Glut-1 positive marker. Biopsy of these masses should be avoided as there is a risk of bleeding, and the diagnosis is made based on typical imaging features and involution at follow-up. Well-defined hypoechoic or hyperechoic lesion, which may show heterogenous echotexture because of central hemorrhage/necrosis. A variety of flow patterns may be seen on colour Doppler due to the presence of shunts which may be portosystemic, or arteriovenous shunts. The hepatic arteries and veins usually enlarged, with large feeding arteries and draining veins seen surrounding as well as within the lesions. The lesions are usually hypoattenuating to the liver parenchyma with speckled calcifications seen in up to 50% of cases. The enhancement pattern is similar to that of hemangioma in adults and shows intense peripheral nodular enhancement on arterial phase with progressive centripetal filling on venous and delayed phases. Small lesions usually show intense and uniform enhancement (Fig. 9.8.2.1). The lesions show hypointense signal on T1-weighted images (T1WI) and hyperintense signal on T2-weighted images (T2WI). The tumour shows internal vascular flow voids and centripetal enhancement (Fig. 9.8.2.2). Heterogeneous signal may be seen due to presence of hemorrhage, thrombosis and necrosis. Calcifications may be seen in about 16% of cases.
9.8: Paediatric hepatobiliary lesions
Introduction
Clinical manifestations
Biochemical tests
Liver biopsy
Imaging techniques
Hepatomegaly
Age (month/years)
Suggested Upper Limit in Longitudinal Liver Length (cm) in Midclavicular Line (Dome to Tip)
Suggested Upper Limit in Spleen Size (cm)
1–3 months
9
7
4–6 months
9.5
7.5
7–9 months
10
8
1–3 years
10.5
8.5
3–5
11.5
9.5
5–7
12.5
10.5
7–9
13
10.5
9–11
13.5
11
11–13
14
11.5
13–15
14
12
15–17
14.5
12
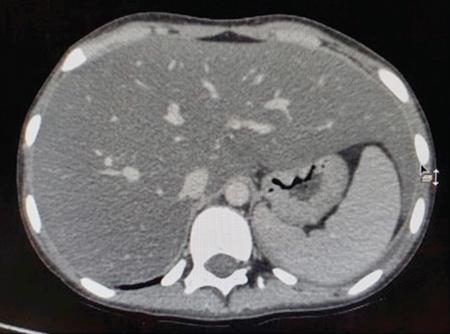
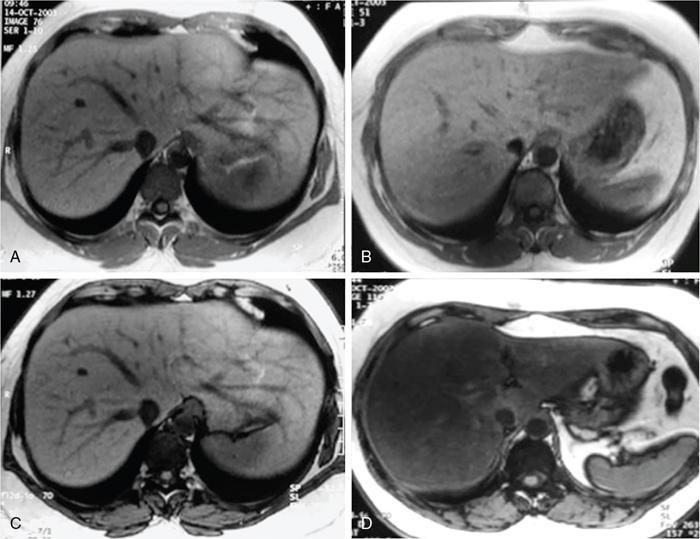
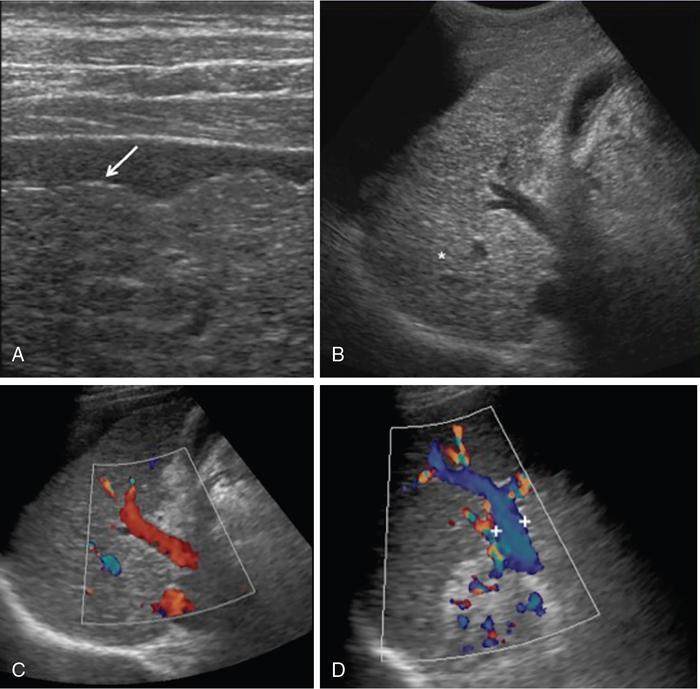
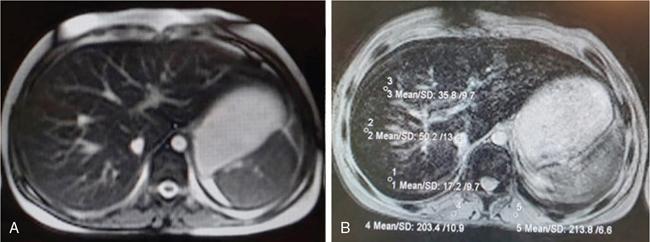
Nonalcoholic fatty liver disease
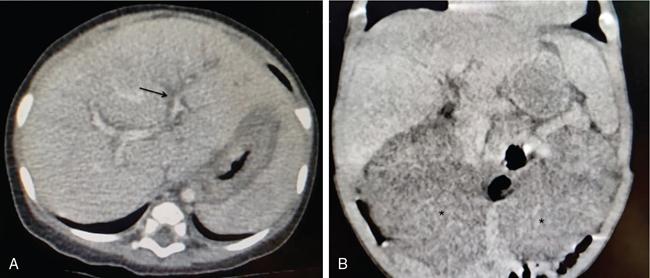
Cirrhosis
Morphological changes
Parenchymal changes
Portal hypertension and other vascular changes
Nodules in cirrhotic liver
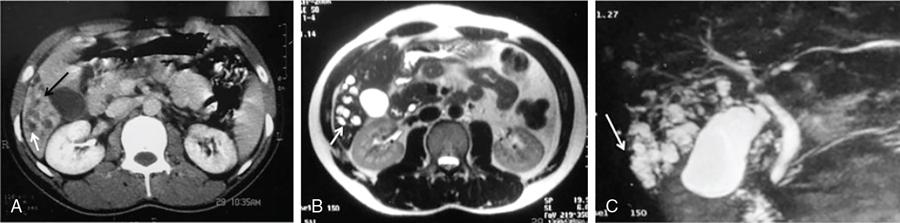
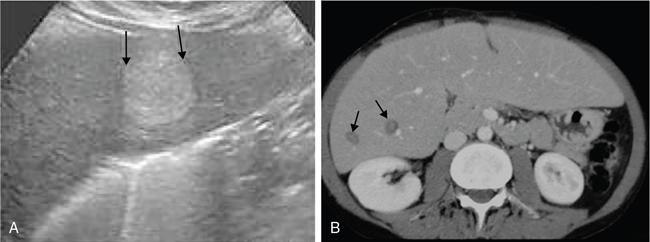
Fibrocystic liver disease
Renal diseases
ARPKD
CHF, Caroli’s disease/syndrome, Von Mayerberg complex with CD/CS
ADPKD
PCLD, Von Mayerberg complex with PCLD
Other renal diseases associated with CHF
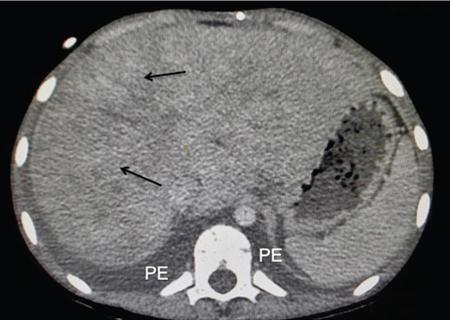
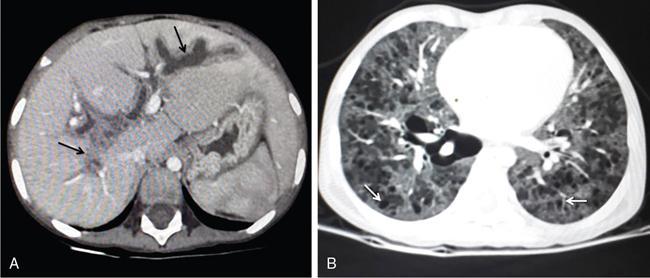
Iron deposition in the liver
1. Liver-to-muscle signal intensity ratio
2. T2 and R2 relaxometry and T2* and R2* relaxometry
3. Quantitative susceptibility mapping
Inherited and metabolic liver diseases
Wilson’s disease
Gaucher disease
Glycogen storage diseases (GSD)
α1-Antitrypsin deficiency
Liver disease with systemic diseases
Systemic Illness
Hepatobiliary Manifestation
Imaging Findings
Inflammatory bowel disease
Sclerosing cholangitis
Dilatation and beading and irregularity of the intra- and extrahepatic bile ducts (MRCP)
Autoimmune hepatitis
Nonspecific (normal, hepatomegaly, cirrhosis, periportal oedema)
Hepatic steatosis
Described
Total parenteral nutrition
Hepatic steatosis
Described
Cholestasis
Gall bladder and intrahepatic biliary sludge, cholelithiasis
Cystic fibrosis
Focal biliary cirrhosis
Periportal echogenicity (US)
Periportal hyperintensity
Steatosis/NASH/Cirrhosis/Portal hypertension
Described
Biliary manifestations
Cholelithiasis, sludge in GB and IHBD
Celiac disease
Celiac hepatitis
May vary from normal to coarsened echotexture on US
Cirrhosis
Infiltration by celiac associated lymphoma
Cardiac disease
Congestive hepatopathy (Fig 9.8.8)
Reticular enhancement pattern on CECT with dilated IVC and/or hepatic veins
Langerhans cell histiocytosis (Fig 9.8.9)
Sclerosing cholangitis
Bilobar intrahepatic biliary radical dilatation
Acute/chronic liver disease
Hepatomegaly
Periportal hypodensity
Hypodense nodules
Conclusion
Introduction
Benign hepatic tumours in children
Hemangioma
Overview
Etiology and presentation
Imaging
Ultrasound.
CT.
MRI.
Related posts:


Stay updated, free articles. Join our Telegram channel

Full access? Get Clinical Tree


