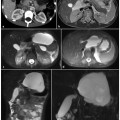
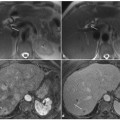
Fig. 8.1
Ductal adenocarcinoma of the body.tail of the pancreas. a A coronal T2-weighted magnetic resonance cholangiopancreatography image, obtained using half-Fourier single-shot turbo-spin-echo (HASTE) (TR/TE ∞/1100 ms) sequences, shows stenosis of the distal main pancreatic duct (arrow). b An axial T1-weighted image, gradient-echo with fat suppression (TR/TE 213/4 ms), shows a neoplasm in the body.tail of the pancreas that appears hypointense (arrow) relative to adjacent pancreatic parenchyma (dashed arrow). c An axial T2-weighted image, with HASTE (TR/TE ∞/102 ms) sequences, shows a faintly hyperintense lesion in the body-tail of the pancreas (arrow) causing an infiltration of the main pancreatic duct, with signs of chronic obstructive pancreatitis upstream (dashed arrow). d–f Axial T1-weighted images, with volumetric interpolated breath-hold examination (VIBE) (TR/TE 4.5/1.7 ms) during the arterial (d), portal venous (e) and late phase (f) of the dynamic study obtained after intravenous administration of gadolinium chelate, show the hypovascularized lesion of the body-tail (arrows) extending to the retroperitoneal adipose tissue, encompassing the splenic vessels and obliterating the cleavage plane with the celiac trunk, with the superior mesenteric artery and the left adrenal gland
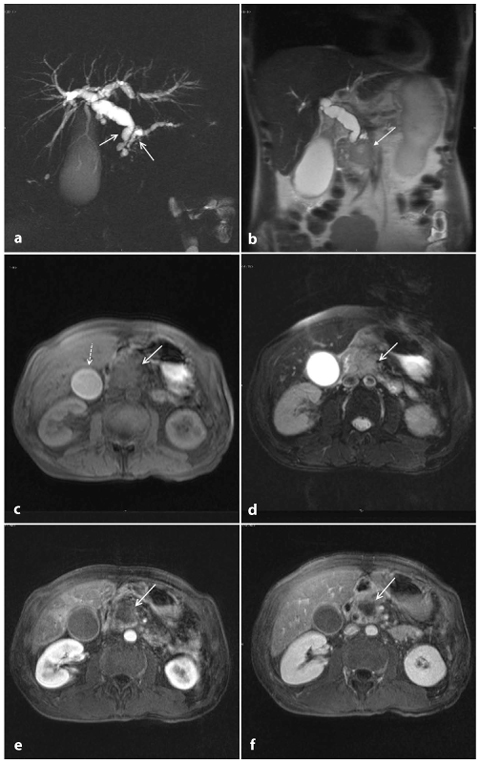
Fig. 8.2
Ductal adenocarcinoma of the head of the pancreas. a A coronal T2-weighted magnetic resonance cholangiopancreatography image, obtained using half-Fourier single-shot turbo-spin-echo (HASTE) (TR/TE ∞/1100 ms) sequences, shows dilatation of the bile duct and main pancreatic duct (“double-duct sign”), with the gallbladder appearing overextended (Courvoisier-Terrier sign) (arrows). b A coronal T2-weighted image, with HASTE (TR/TE ∞/102 ms) sequences, shows a focal hypointense lesion localized in the pancreatic head (arrow) causing an upstream dilatation of the bile duct. c An axial T1-weighted image, gradient-echo with fat suppression (TR/TE 213/4 ms) documents a focal area of abnormal signal intensity in the head of the pancreas, which appears hypointense (arrow) and causes infiltration of the bile duct, with the gallbladder appearing overextended (Courvoisier-Terrier sign) (dashed arrow). d An axial T2-weighted image, with HASTE (TR/TE ∞/102 ms) sequences shows a faintly hyperintense lesion in the head of the pancreas (arrow). e, f Axial T1-weighted images, with volumetric interpolated breath-hold examination (VIBE) (TR/TE 4,5/1,7 ms) during the arterial (e) and late phase (f) of the dynamic study obtained after intravenous administration of gadolinium chelates show a hypovascularized lesion of the head (arrow e, f)
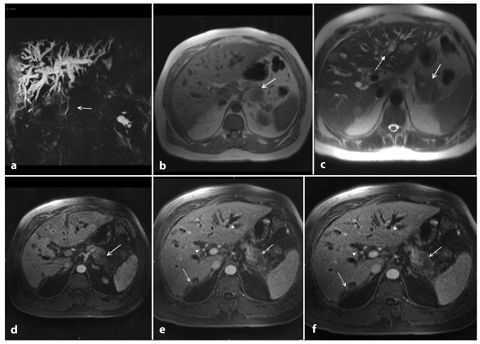
Fig. 8.3
Ductal adenocarcinoma of the tail of the pancreas. a A coronal T2-weighted magnetic resonance cholangiopancreatography image, obtained using half-Fourier single-shot turbo-spin-echo (HASTE) (TR/TE ∞/1100 ms) sequences, shows stenosis of the main pancreatic duct (arrow) and dilatation of the intrahepatic bile ducts. b An axial T1-weighted image, gradient-echo with fat suppression (TR/TE 213/4 ms), shows a focal area of abnormal signal intensity in the tail of the pancreas, which appears hypointense (arrow). c An axial T2-weighted image, with HASTE (TR/TE ∞/102 ms) sequences, shows a faintly hyperintense lesion in the tail of the pancreas (arrow) and the presence of multiple solid lesions in the liver that are mildly hyperintense, indicating repetitive injury (dashed arrow). d–f Axial T1-weighted images, with volumetric interpolated breath-hold examination (VIBE) (TR/TE 4.5/1.7 ms) during the arterial (d), portal venous (e) and late phase (f) of the dynamic study obtained after intravenous administration of gadolinium chelates, show as hypovascularized lesion of the tail (arrow, d–f) that encompasses the splenic vessels. In the liver, secondary nodules (dashed arrows, e, f) and dilatation of the intrahepatic bile ducts (arrowheads, e) can also be seen
Normal pancreatic parenchyma appears hyperintense compared with the liver, on T1- weighted images (Fig. 8.1b). Pancreatic adenocarcinoma is hypointense on T1-weighted images because of its desmoplastic nature [8, 9]. This contrast resolution between pancreatic parenchyma and pancreatic adenocarcinoma is better appreciated on fat-suppressed gradient-echo T1-weighted images (Fig. 8.1b) [8].
T2-weighted sequences provide excellent anatomical resolution of the static-fluid-filled structures, and they also visualize the solid organs (Fig. 8.1c). On these sequences, pancreatic adenocarcinoma shows a signal intensity similar to or slightly less than that of the normal parenchyma. Therefore, the contrast resolution between pancreatic adenocarcinoma and the adjacent parenchyma on T2- weighted images is less than that on T1- weighted images; however, T2-weighted images are useful for a complete study of the pancreatic ducts and bile ducts, and are essential for the recognition of the tumor extension, liver metastasis and lymph node involvement (Fig. 8.3a,c) [10].
The tumor is best visualized on immediate post-gadolinium T1-weighted images, during the pancreatic phase acquired 35–45 s followlocally ing contrast agent injection. This is because of the presence of an abundant fibrous stroma within the tumor and its poor vascularization; a delayed wash-out is frequently observed on equilibrium phase images (Fig. 8.2e–f) [11]
Dynamic study also improves detection of associated lymph nodes and hepatic metastases. Furthermore dynamic study during gadolinium-chelate injection is helpful in depicting vascular infiltration. In particular, the presence of metastasis and the infiltration of the celiac axis and/or the superior mesenteric artery and vein influence the surgical management of patients.
The examination is usually completed by means of MRCP pulse sequence, in order to explore ductal changes induced by pancreatic adenocarcinoma: namely irregular ductal stenosis and/or dilatation of the upstream main pancreatic duct and side branches, and expression of upstream obstructive chronic pancreatitis.
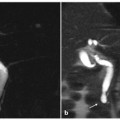
The characteristic “double-duct sign” represents dilatation and non-communication of the pancreatic and the common bile ducts, and suggests the presence of a head adenocarcinoma of the pancreas (Fig. 8.4). Adenocarcinoma of the body and tail usually shows abrupt narrowing, with upstream dilatation of the main bile duct.
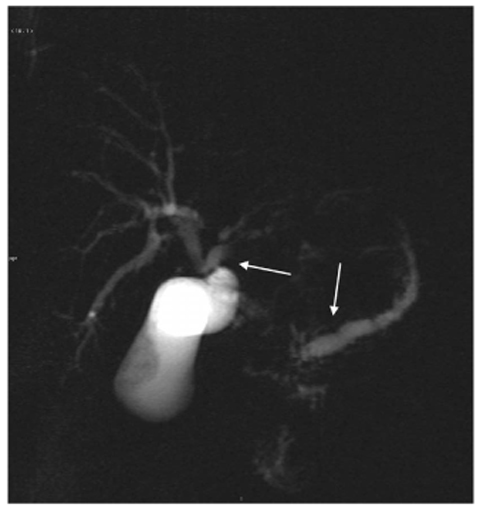
Fig. 8.4
Ductal adenocarcinoma of the pancreas. A coronal T2-weighted magnetic resonance cholangiopancreatography image, obtained using half-Fourier singleshot turbo-spin-echo (HASTE) (TR/TE ∞/1100 ms sequences), shows dilatation of the bile duct and main pancreatic duct (“double-duct sign”, arrows) caused by a focal lesion in the pancreas head
MRCP is able to readily depict the location and morphological characteristics of a pancreaticobiliary obstruction and to evaluate the surgical resectability [6, 10].
The differential diagnosis between a benign ductal stenosis and a malignant ductal stenosis can be achieved by means of dynamic MRCP during administration of secretin (s- MRCP). Benign stenoses dilate following the administration of secretin, showing the socalled “duct-penetrating sign”, which is different from malignant stenoses caused by pancreatic adenocarcinoma, in which no dilatation is observed on MRCP images following the administration of secretin, and they lack the duct-penetrating sign.
8.2.1.5 Criteria of Resectability
The stage at diagnosis of pancreatic adenocarcinoma, according to tumor node metastasis (TNM) staging, remains a very important prognostic factor to distinguish between resectable and non-resectable disease. In fact patients with vascular invasion and locally advanced non-metastatic disease, and patients with distant metastases, do not undergo surgical resection.
The current resection criteria include [12]: tumor size; lack of tumor involvement of major arteries; a suitable segment of superior mesenteric vein below and portal vein above the side of venous involvement, in order to allow for venous reconstruction; absence of distant metastases.
MRI is an effective imaging technique that allows determination of tumor size and its relationships with the peri-pancreatic organs. Using the same criteria as that used for CT for the assessment of vascular involvement, MRI is also crucial to distinguish whether there is a fat plane between the tumor and the peri-pancreatic vessels, vascular abutment or encasement.
Lu et al. proposed a five-grade scale for quantifying the degree of the vascular involvement: grade 0, no-involvement; grade 1, less than one-quarter circumference; grade 2, between one-quarter and one-half circumference; grade 3, between one-half and threequarters circumference; and grade 4, more than three-quarters circumference [13]. Although the threshold proposed by Lu is an optimal reference point, more recent studies have suggested that the criteria for diagnosing vascular invasion should be different between arteries and veins [12].
Adenocarcinoma originating from the body-tail of the pancreas usually involves the celiac axis and the superior mesenteric artery [14]; pancreatic head adenocarcinoma generally extends beyond the gland with involvement initially of the portal vein and the superior mesenteric vein, and subsequently the superior mesenteric artery.
In the assessment of vessel invasion, the “teardrop vein sign” is a diagnostic imaging sign that is highly indicative of unresectable cancer [15, 16]. Nevertheless, since the arteries have thicker walls and are more flexible than the veins, a normal vessel size cannot exclude vascular involvement.
The splenic artery and vein are not considered critical in the diagnosis because a pancreatic tail tumor is resected en-block with the spleen and the splenic vessels.
The detection of distant metastases is another important task of pre-operative imaging, because hepatic and peritoneal metastases are absolute contraindications to surgical resection. Hepatic metastases appear as solid, usually multiple, small-size masses that closely resemble the MRI features of the primary tumor. Thus, on pre-contrast images, liver metastases with a diameter greater than 1.5 cm appear moderately hypointense on T1- weighted images and moderately isohyperintense on T2-weighted images. Metastases with a diameter less than 1.5 cm are inconsistently visualized on non-contrast images. With the use of intravenous contrast medium on the arterial dominant phase, liver metastases from pancreatic adenocarcinoma are generally considered to be hypovascular. However, hypervascular liver metastases have been reported. Diffusion-weighted images demonstrate high sensitivity in detecting hepatic metastases.
Peritoneal carcinomatosis appears as peritoneal nodules and ascites, and tumor cells can be found by laparoscopy or peritoneal washing.
It is also possible to recognize adenopathy, but pre-operative detection of peritumoral lymphadenopathy is not essential for assessing the resectability of pancreatic adenocarcinoma because peri-pancreatic lymph nodes are resected en bloc with the primary tumor [12].
8.2.1.6 Differential Diagnosis
Differential diagnosis of focal hypointensity masses can be challenging in clinical practice because patients with adenocarcinoma of the pancreas can present clinical symptoms and radiographical findings that are difficult to distinguish from those of other neoplasms, such as pancreatic endocrine tumors or metastases; and also difficult to distinguish from non-neoplastic lesions, such as chronic pancreatitis and autoimmune pancreatitis.
It is important to distinguish the adenocarcinoma from the other neoplastic lesions, particularly pancreatic endocrine tumors and metastases, since the patient triage and prognosis change significantly.
Pancreatic endocrine tumors can present the same pattern as other solid pancreatic masses, especially the smaller poorly vascularized lesions with abundant presence of fibrous stroma and calcifications, but some criteria can guide the differential diagnosis. Pancreatic adenocarcinoma is in fact a hypovascular tumor associated with vascular ductal involvement, whereas pancreatic endocrine tumors are generally hypervascular, with a low signal intensity on T1-weighted images and a high signal intensity on T2-weighted images, and they show a rapid grown pattern with a late mesenteric vascular encasement.
Hypovascular pancreatic endocrine tumors occur in 24% of cases; in these patients the differential diagnosis with adenocarcinoma may by very challenging. However, the presence of calcifications, central necrosis and cystic degeneration are more suggestive of a pancreatic endocrine tumor than of adenocarcinoma [17].
Metastases represent 2–5% of all malignant pancreatic neoplasms, and arise most frequently from renal cell carcinoma, lung carcinoma, breast carcinoma, colon-rectal carcinoma and melanoma. They can be solitary (50–70% of cases), multifocal (5–10% of cases) or diffuse (15–44%), appearing as hypointense masses on T1-weighted MRI and isohyperintense on T2-weighted MRI. On contrast-enhanced imaging, they usually show the same signal intensity as the primary carcinoma [18]. Hypovascular metastases (lung, colorectal) are more difficult to distinguish from the adenocarcinoma than hypervascular metastases (renal cell carcinoma, melanoma). The discovery of a synchronous or metachronous primary carcinoma or a known history of cancer facilitates a correct diagnosis [17].
The presence of a pancreatic mass is generally indicative of a neoplasm, but chronic pancreatitis can also cause a focal pancreatic mass. Furthermore, the incidence of pancreatic carcinoma is much higher in patients with chronic pancreatitis than in the general population, and pancreatic head adenocarcinoma usually causes chronic inflammation, with fibrosis and progressive atrophy of the parenchyma through the obstruction of the main pancreatic duct; this makes the distinction between adenocarcinoma and chronic inflammation difficult on T1-weighted sequences (Fig. 8.5a–f) [19]. Discrimination between these two entities is difficult clinically, radiologically and even histologically. Features at MRI that favor a diagnosis of chronic pancreatitis include: absence of abrupt, gradual narrowing of the biliary or pancreatic duct; absence of dilated or smoothly tapering pancreatic and bile ducts coursing through the mass; pancreatic duct irregularity; presence of pancreatic calcifications and modest atrophy [17, 19].
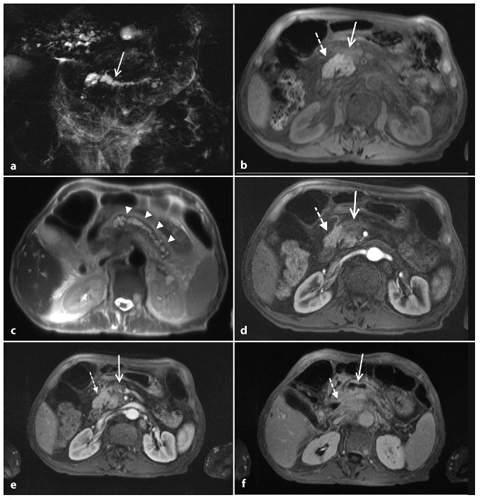
Fig. 8.5
Ductal adenocarcinoma of the pancreas located in the body. a A coronal T2-weighted magnetic resonance cholangiopancreatography image, obtained using half-Fourier single-shot turbo-spin-echo (HASTE) (TR/TE ∞/1100 ms sequences), shows signs of chronic obstructive pancreatitis with stenosis and dilatation of the main pancreatic duct (arrow). b An axial T1-weighted image, gradient-echo with fat suppression (TR/TE 213/4 ms), shows a focal area of abnormal signal intensity in the body of the pancreas that appears hypointense (arrow) relative to adjacent pancreatic parenchyma (dashed arrow). c Axial T2-weighted image, with HASTE (TR/TE ∞/102 ms) sequences, shows typical signs of chronic obstructive pancreatitis (arrowheads). d–f Axial T1-weighted images, with volumetric interpolated breath-hold examination (VIBE) (TR/TE 4.5/1.7 ms) during the arterial (d), portal venous (e) and late phase (f) of the dynamic study obtained after intravenous administration of gadolinium chelates, show the hypovascularized lesion of the body (arrows, d–f) relative to adjacent pancreatic parenchyma (dashed arrows, d–f), and upstream dilatation of the bile duct and main pancreatic duct (f)
An important cause of secondary chronic pancreatitis is paraduodenal pancreatitis. It can result in an obstruction of the main pancreatic duct, causing focal chronic pancreatitis. This appearance may resemble pancreatic adenocarcinoma. The most characteristic finding of paraduodenal pancreatitis on MRI is a sheet-like mass, hypointense compared with pancreatic parenchyma on T1-weighted images, and variably hyperintense on T2- weighted images. The signal intensity changes of the above-mentioned ectopic pancreatic tissue can be expression of inflammation/edema during the acute/subacute phase and fibrosis during chronic disease. This fibrotic nature produces a delayed enhancement of the lesion during dynamic images [20].
Another non-neoplastic lesion that can mimic the adenocarcinoma is autoimmune focal pancreatitis. A hypointense mass in a young patient with a well-known history of other autoimmune pathologies (Sjögren syndrome, primary sclerosing cholangitis, primary biliary cirrhosis, ulcerative colitis or systemic lupus erythematosus) can raise further concern for autoimmune pancreatitis [21]. Autoimmune focal pancreatitis appears hypointense on T1-weighted images, and slightly hyperintense on T2-weighted images. On post-contrast images, it appears hypointense during the pancreatic phase, with progressive enhancement and delayed retention during the delayed phase [22].
The periductal infiltrate is responsible for long stenoses, with little upstream dilatation, as depicted on MRCP images.
8.2.2 Endocrine Pancreatic Tumors
8.2.2.1 Epidemiology
Pancreatic endocrine tumors (PETs) are a heterogenous group of rare neoplasms of the pancreas originating from totipotential stem cells or differentiated mature endocrine cells within the exocrine gland [23]. Although rare, occurring in fewer than 1 in 100,000 people per year [24, 25], the frequency of occurrence of PETs has increased progressively over the past few years as a result of increased awareness by clinicians, radiologists and pathologists [24].
These neoplasms, which usually occur sporadically, can occasionally be associated with genetic syndromes such as multiple endocrine neoplasia type 1, von Hippel-Lindau disease, neurofibromatosis type 1 and tuberous sclerosis [26].
Overall, they show no significant gender predilection, and peak age is between the fifth and sixth decades [23, 24, 26].
PETs produce and secrete hormones to a variable degree. When they produce symptoms related to excessive hormone production, the tumors are classified as syndromic or functioning pancreatic endocrine tumors (FPETs) [27]. FPETs represent the majority of PETs and are classified according to the name of the predominant hormone they secrete [27]. The two most common FPETs are insulinoma and gastrinoma, followed by glucagonoma, vipoma, somatostatinoma and carcinoids [27].
8.2.2.2 Pathological Findings
PETs are either benign or malignant epithelial tumors with endocrine differentiation, usually characterized by a low grade of histological aggressiveness. Sporadic PETs are mostly solitary, whereas hereditary PETs are more often multifocal [31, 32]. Endocrine differentiation can be observed by means of immunohistochemical methods, demonstrating the production of neurospecific enolase [33], synaptophysin and cromogranins [34]. In order to predict the biological behavior of these tumors, traditional histopathological criteria are not useful. The only real criteria for malignancy that are easier to document are the presence of nodal and/or hepatic metastases and extrapancreatic extension of the tumor with invasion of adjacent organs and/or structures [35]. The World Health Organization (WHO) first introduced a system for naming and classifying endocrine tumors of the pancreas in 2000. This classification defines three types of PET: well-differentiated neuroendocrine tumor, well-differentiated neuroendocrine carcinoma and poorly differentiated neuroendocrine carcinoma. While poorly differentiated neuroendocrine carcinoma is invariably malignant, well-differentiated neuroendocrine tumors can be either benign or malignant.
More recently, a TNM classification for PETs has been proposed in order to help clinicians with stratification, treatment and followup of patients [36].
Also, a modified grading system, similar to that adopted by the WHO for endocrine tumors of the lung, and referring to the proliferation status, has been proposed [36]. Three tumor categories are identified: G1, <2 mitoses per 2 mm2 and/or Ki-67 index <2%; G2, 2–20 mitoses per 2 mm2 and/or Ki-67 index between 3% and 20%; G3, 21 or more mitoses per 2 mm2 and Ki-67 index >20%. In general, G1 and G2 should refer to well-differentiated PETs.
PETs usually present as a single lesion, ranging from 1 cm to ≥10 cm in diameter, with a rounded and/or lobulated border that is well demarcated from spared parenchyma; although these neoplasms lack a true capsule, an expansive pattern of growth is much more common than an infiltrative pattern.
Intralesional necrotic and hemorrhagic foci may be relatively common in large tumors (especially NFPETs) and justify structure inhomogeneity at imaging studies.
The typical radiological behavior of these tumors, frequently imaged as hypervascular masses in contrast-enhanced studies, is related to their rich vascularization. However, cases of poorly vascularized tumors may be due to the presence of sclerohyaline or fibrous stroma, presence of abundant calcifications, or widespread necrosis with consequent cystic appearance at imaging [37].
8.2.2.3 Clinical Findings
Syndromic PETs are usually diagnosed on the basis of clinical and laboratory findings related to hormone hyperproduction.
The most frequent FPET is represented by insulinoma. This neoplasm originates from beta cells of pancreas and is characterized by the following clinical triad: (1) hypoglycemic attack during fasting, (2) glycemia <40 mg/dl, and (3) rapid remission of symptoms after food consumption. Hypoglycemia can lead to nausea, vomiting, dizziness, asthenia, diplopia, agitation, torpor and, in some instances, can lead to coma. Laboratory diagnosis is mainly based on a fasting glucose tolerance test.
Gastrinomas originate from pancreatic Gcells and are characterized by hyperproduction of gastrin (exceeding 1000 pg/ml). Symptoms of presentation, characterizing the related Zollinger-Ellison syndrome, are represented by abdominal pain and diarrhea [38]. All patients suffer typically from multiple peptic ulcers that are poorly responsive to pharmacological treatment, and are located in the proximal portion of duodenum in 75% of cases; more rarely, the ulcers involve the distal stomach, distal duodenum and proximal jejunum [38].
Glucagonomas originate from alpha cells of pancreas; glucagon, the hormone hyperproduced in this tumor, plays a key role in the metabolism of sugar: the clinical syndrome is therefore characterized by weight loss, anemia, and reduced serum levels of alanine, glutamine and essential fatty acids. Constipation can be a symptom since glucagon is an inhibitor of intestinal motility.
Vipoma is caused by increased serum levels of vasoactive intestinal peptide. The socalled Verner-Morrison syndrome is characterized by watery diarrhea with metabolic acidosis (following electrolyte imbalance, such as hypokalemia and hypochlorhydria) causing lethargy, weight loss, cardiac disorders, abdominal pain and dyspepsia [39].
Somatostatinoma is a tumor originating from delta cells of pancreas. This tumor, which can grow anywhere in the gastrointestinal tract, can cause an extremely variable range of clinical symptoms; the classic triad (diabetes, gallstones, diarrhea-steatorrhea) can be associated with other clinical symptoms, making the clinical presentation often non-specific, with consequent retrospective diagnosis.
8.2.2.4 Magnetic Resonance Imaging
Given their pathological characteristics, PETs pose distinctive diagnostic imaging and prognostic problems. In FPETs, the role of imaging [41, 42] is mainly to detect the tumor, which is usually quite small at diagnosis, and to verify lesion numbers and location (Figs. 8.6 and 8.7).
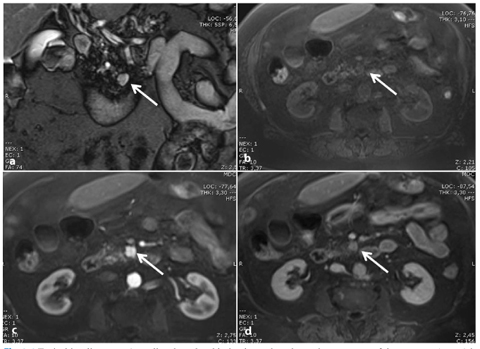
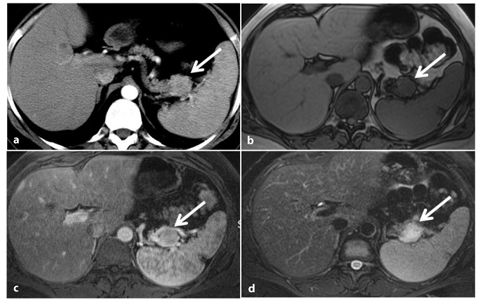
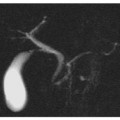
Fig. 8.6
Typical insulinoma. a A small pedunculated lesion located on the uncinate process of the pancreas (arrow) is nicely depicted as a hyperintense nodule on a coronal T2-weighted image. The tumor (arrow) is hypointense on the axial fat-suppressed T1-weighted image (b), and shows typical hypervascularity during the arterial phase after administration of the contrast material (arrow, c). d In the equilibrium phase, the tumor shows a significant wash-out (arrow)
Fig. 8.7
Atypical insulinoma. a A small rounded nodule of the pancreatic tail (arrow) appears isodense compared with both the remaining pancreatic and spleen parenchyma on contrast-enhanced computed tomography (CT) obtained during the arterial phase. The lesion (arrow) appears isointense to the spleen on a gradient-echo T1-weighted image (b). On a fat-suppressed T1-weighted image, acquired during the pancreatic phase obtained after the administration of gadolinium-chelates the neoplasm appears isovascular to the spleen (c). The nodule is characterized because of its hyperintensity, compared with normal pancreas and spleen, on an axial fat-suppressed turbo-spin-echo T2-weighted image (d)
In contrast, in NFPETs, which can manifest late as large masses causing compression symptoms (Fig. 8.8), or as incidental findings in asymptomatic patients (Fig. 8.9), the role of imaging studies is to characterize the tumor, differentiating it from other tumor entities and in particular from ductal adenocarcinoma, as malignant NFPETs have a more favorable prognosis (a 5-year survival rate of 40% compared with 3–5% for adenocarcinoma).
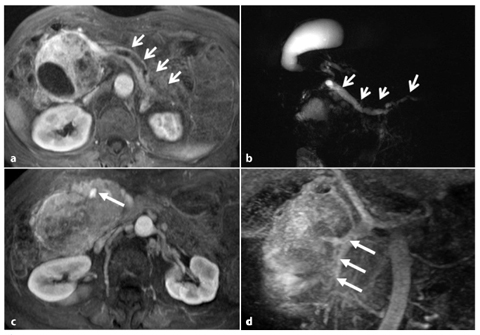
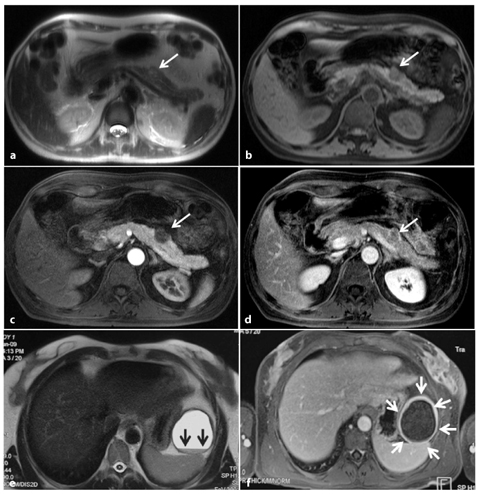
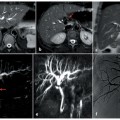
Fig. 8.8
Non-functioning, poorly differentiated pancreatic endocrine carcinoma. a Axial fat suppressed T1-weighted images during the pancreatic phase of the dynamic study, shows a large inhomogenously hypervascular neoplasm of the pancreatic head responsible of upstream dilatation of the main pancreatic duct (arrows). b Dilatation of the biliary tree and gallbladder, together with upstream dilatation of the main pancreatic duct (arrows), is clearly depicted on a coronal magnetic resonance cholangiopancreatography (MRCP) image. c The axial T1-weighted image, acquired during the portal phase after the administration of gadolinium chelates, shows complete encasement of the superior mesenteric vein (arrow). d The length of encasement of the vessel (arrows) can be better evaluated on paracoronal reconstructed maximum-intensity-projection (MIP) images obtained from the portal venous phase
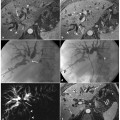
Fig. 8.9
Atypical imaging features of non-functioning endocrine tumors. a–d Case 1. a A small tumor of the pancreatic body (arrow) appears as a solid, slightly hyperintense nodule on an axial T2 half-Fourier single-shot turbo-spin-echo (HASTE) sequence. The lesion (arrow) is hypointense on a pre-contrast axial fat-suppressed T1-weighted image (b) and on the arterial enhanced phase after the administration of gadolinium chelates (arrow) (c). d The tumor (arrow) shows slow delayed enhancement, appearing isovascular to pancreatic gland during the equilibrium phase because of the presence of a fibrous stroma. e–f Case 2. A large unilocular cystic tumor of pancreatic tail with fluid-fluid level (arrows) is shown on an axial T2-weighted HASTE image (e); a thick wall showing strong enhancement (arrows) can be seen on an axial T1-weighted image acquired after the administration of gadolinium during the portal phase (f)
As they are often malignant, NFPETs also require accurate staging and appropriate follow- up.
State-of-the-art MRI of pancreatic neoplasms is optimally performed with 1.5 Tesla gradient systems, using phased-array coils to improve the signal-to-noise ratio, and optimized with thin slice and small fields of view [43]. Breath-hold acquisitions are obtained with fast-spin-echo or gradient-echo sequences and echo-planar imaging. A moderately T2- weighted fast-spin-echo and single-shot fastspin- echo (SSFSE) should be obtained, followed by T1-weighted in-phase gradient-echo and T1-weighted opposed-phase gradient-echo. To evaluate cystic lesions of the pancreas, coronal and axial MRCP with SSFSE should be obtained. For the evaluation of islet cell tumors, fat-suppressed, 3D spoiled gradientecho sequences after the administration of gadolinium-DTPA are acquired in arterial phase (30–40 s), portal phase (70–80 s) and equilibrium phase (180 s) [43].
Images acquired should cover the upper abdomen, including the entire liver, enhancing the detection and characterization of locoregional lymph nodes and hepatic lesions.
The majority of PETs share similar imaging features, represented by a solid appearance, lobulation and well-demarcated margins, with an expansive pattern of growth [42–45].
Generally, PETs show low signal intensity on T1-weighted images and high signal intensity on T2-weighted images [45]. They are especially well visualized on T1-weighted images with fat suppression, which produces high contrast resolution in comparison with the normal bright parenchyma surrounded by hypointense retroperitoneal fat (Fig. 8.9b) [45].
However, the key for differential diagnosis with other pancreatic masses is the hypervascularity of PETs (Figs. 8.6 and 8.8); this is frequently imaged during arterial pancreatic and portal venous phases [43–45].
Atypical presentation may be seen as lesion hyperintensity on T1-weighted images (due to intralesional hemorrhage), and hypointensity on T2-weighted images (due to the presence of intralesional calcifications or fibrous stroma). This latter feature may also be related to lack of a typical imaging pattern during dynamic enhanced study, determining the presence of isovascular or hypovascular lesions in comparison with the normal parenchyma (Fig. 8.9c, d).
A cystic pattern has also been described, often related to widespread necrosis. In this case, the presence of a thick ring-shaped portion of tumor showing a hypervascular enhancement pattern and the absence of intralesional septations can suggest a diagnosis of cystic endocrine tumor (Fig. 8.9e, f).
Unlike adenocarcinomas, PETs rarely result in pancreatic duct dilatation. However, pancreatic duct and biliary tree dilatation can be observed in cases of large tumors located in the pancreatic head region (Fig. 8.8a, b).
Poorly differentiated neuroendocrine carcinoma may also be associated with complete vascular encasement (Fig. 8.8c, d).
8.2.2.5 Differential Diagnosis
Clearly hypervascular PETs do not pose a significant diagnostic dilemma, and can easily be differentiated from other tumor entities, especially in cases with hypervascular lymph nodes and liver metastases.
The solid variant of microcystic cystoadenoma may show a hypervascular enhancement pattern due to the presence of multiple coalescing thin intralesional septations mimicking the presence of a solid mass [46]; however, the typical honeycomb pattern of these tumors can usually be observed on T2-weighted and MRCP images. Hypervascular pancreatic metastases are quite rare and often multiple; also, secondary lesions are frequently detected in specific clinical settings (patients suffering from renal cell carcinomas or melanoma), together with metastases involving other organs. However, differential diagnosis can be challenging in cases of atypical imaging patterns: isovascular, and above all hypovascular, lesions need to be differentiated from pancreatic adenocarcinoma and, since signal intensity on T1-weighted and T2- weighted images does not allow a reliable differentiation, other imaging findings such as the presence of an expansive growth pattern of growth, late vascular or pancreatic duct involvement, the presence of structural inhomogeneity due to cystic and necrotic changes, and large diameter at diagnosis can suggest a diagnosis of PET.
Finally, cystic PETs should be differentiated from unilocular pancreatic cystic lesions; in some instances, the presence of a thick rim of solid enhancing tumor may suggest a diagnosis of cystic PET (Fig. 8.9e, f).
8.3 Cystic Tumors
8.3.1 Introduction
Cystic neoplasms of the pancreas are relatively rare entities. They include 10% of pancreatic cysts and only 1% of pancreatic cancers. The category of cystic neoplasms constitutes an important group of lesions with distinctive clinical and pathological features.
The current interest in identifying cystic pancreatic lesions arises from their easier recognition with modern imaging techniques, such as US and CT.
The WHO classification of cystic pancreatic tumors encompasses a wide spectrum of tumors including: serous cystadenomas, mucinous cystadenomas, mucinous cystadenocarcinomas, solid pseudopapillary cystic tumors and intraductal papillary mucinous neoplasms, acinar cell cystadenomas, acinar cell cystadenocarcinomas and endocrine tumors with cystic degeneration (Table 8.1).
Type | Relative frequency (%) |
|---|---|
Intraductal papillary mucinous neoplasms | 48 |
Serous cystic neoplasms | 20 |
Mucinous cystic neoplasms | 18 |
Solid pseudopapillary neoplasms | 6 |
8.3.2 Mucinous Cystic Neoplasms
8.3.2.1 Epidemiology
A mucinous cystic neoplasm (MCN) is a cystic- forming epithelial neoplasm that does not usually communicate with pancreatic ductal system, and is composed of columnar, mucinproducing epithelium associated with ovarian-type stroma. MCNs account for about 18% of cystic lesions of the pancreas, and 95–100% of MCNs occur in women, with a female-tomale ratio of 20:1. The average age at diagnosis is 45 years. In 93–97% of the cases, MCNs of the pancreas arise in the body-tail of the gland [47]. As the theory of Professor Zamboni suggested, it is due to contiguity between the primitive left ovary and the tail of the pancreas during embryological life.
8.3.2.2 Clinical Findings
Clinical presentation depends on the size of the tumor: small lesions (<3 cm) are usually found incidentally; larger tumors may produce symptoms that are secondary to the compression of the adjacent structures; these symptoms include: abdominal pain, anorexia, weight loss, early satiety, nausea and they are often accompanied by a palpable abdominal mass. Although they do not communicate with the pancreatic duct, MCNs can cause partial obstruction of the pancreatic duct. High levels of tumor markers carcinoembryonic antigen (CEA) and carbohydrate antigen 19–9 (CA19–9) are useful, but they are not reliable markers for distinguishing mucinous lesions from nonmucinous lesions, or for predicting the presence of malignant components. Because the lesions are considered to have malignant potential and successful complete excision is curative, it is important to recognize the radiographic appearance of MCNs [25, 48].
8.3.2.3 Pathological Findings
According to the grade of epithelial dysplasia, MCNs can be classified into adenoma, borderline tumor and carcinoma, and invasive or non-invasive. MCNs typically present as single spherical mass with a smooth surface, whereas higher grade neoplasms often have papillary projections and/or mural nodules, a fibrous pseudocapsule of variable thickness and occasional calcifications. The tumors are either unilocular or multilocular, with cysts ranging from a few millimeters to several centimeters in diameter. The cysts may occasionally contain debris or a hemorrhage. The complex internal architecture of the cyst, including septa and an internal wall, is best appreciated at MRI and endoscopic US, enabling differentiation from serous cystadenomas. Although peripheral eggshell calcification is not frequently seen at CT, such a finding is specific for a MCN and is highly predictive of malignancy [48, 49]. The cysts have mucinproducing columnar epithelium supported by ovarian-like stroma, or a mixture of mucin and hemorrhagic-necrotic material [47, 50]. The cysts are lined by tall, columnar, mucinproducing cells that stain with diastase-resistant periodic acid-Schiff and Alcian blue [47, 48


Related posts:
Stay updated, free articles. Join our Telegram channel
Full access? Get Clinical Tree
