and Lori Ann Lewis1
(1)
Clinical Research Center of North Texas, Denton, TX, USA
Abstract
The application of DXA in pediatric medicine is a rapidly growing field. The rapidity of its growth, however, increases the likelihood of technical errors and misinterpretation of the results. One of the most important lessons to remember in pediatric densitometry is the admonition [1] from an expert in the field that “Children are not simply small adults.” An extension of this statement is that an expert in adult densitometry is not automatically an expert in pediatric densitometry.
The application of DXA in pediatric medicine is a rapidly growing field. The rapidity of its growth, however, increases the likelihood of technical errors and misinterpretation of the results. One of the most important lessons to remember in pediatric densitometry is the admonition [1] from an expert in the field that “Children are not simply small adults.” An extension of this statement is that an expert in adult densitometry is not automatically an expert in pediatric densitometry.
There are several issues in pediatric densitometry that are not concerns in adult densitometry, or which are of less concern. The pediatric skeleton is constantly changing in terms of size and even shape. Ossification centers fuse in different bones at different ages. A child’s chronological age does not necessarily reflect their bone age. The onset of puberty, at whatever age it occurs in the child, has a pronounced effect on the development of the skeleton. The densitometry software in pediatric densitometry must be able to detect bone edges in the setting of lower densities than often seen in adult densitometry. Radiation safety issues are not the same. Reference databases for adults are not appropriate for use in pediatric densitometry. Similarly, the use of the T-score in pediatric densitometry is not appropriate. And finally, the diagnosis of osteoporosis should not be made on the basis of the mass or density measurement alone.
Pediatric Scan Acquisition and Analysis
The technical aspects of the performance of pediatric densitometry are not that different from those for adult densitometry. The greatest challenge in scan acquisition may indeed be keeping the child still during the scan. The shorter scan times needed by newer densitometers have helped to alleviate but not completely eliminate this problem. The manufacturer’s directions for positioning and analysis should be followed for any given type of scan. It is preferable however that the acquisition software be software that is specifically designed for a pediatric population.
Bone edge detection algorithms that are unique to each manufacturer’s DXA device enable the separation of bone from soft tissue. Edge detection algorithms designed for an adult population with an expected range of bone densities may fail when used in a pediatric population with lower body weight and lower bone mineral density (BMD). In essence, the machine may be unable to tell where the bone stops and starts. This will cause a failure in appropriate edge detection. The bone edges or bone map should be verified by the technologist during the analysis and corrected, if necessary. In a review of 34 pediatric bone density studies in which a diagnosis of osteoporosis, osteopenia, or low bone density was made, Gafni and Baron [2] found errors in bone mapping in 7 of the 34 or 21 %. After recognition of these errors, three of the seven bone densities were found to be normal, but two of the seven still could not be classified because of other errors.
Pediatric densitometry must be performed with these edge detection issues in mind. In 1993, Hologic, Inc., introduced a low density spine (LDS) software option to be used in children as well as adults with low bone density. This was an operator-selected analysis mode rather than a scan acquisition mode. The effects of low density edge detection became apparent when 100 bone density studies in children aged 2–18 years were analyzed using the LDS option as well as the standard adult analysis option [3]. When the LDS option was used, the measured bone area and bone mineral content (BMC) increased significantly. Because the bone area increased to a greater degree than the BMC, the BMD decreased an average of 8.7 % with the LDS option. Norland systems such as the XR-46™ and Excell™ utilize a dynamic filtration system that automatically adjusts the photon flux to accommodate differences in body size during scan acquisition. Systems like the GE Lunar Prodigy™ automatically select the best scan mode based on the height and weight of the patient and also employ specialized analysis algorithms for low bone density in the pediatric spine.
Radiation Safety Issues in Pediatric Densitometry
Radiation safety in densitometry in general was discussed in Chap. 5. As in adult densitometry, the overriding principle guiding radiation safety in pediatric densitometry is “as low as reasonably achievable” or ALARA. In pediatrics, however, the effective dose equivalent (HΕ)1 cannot be assumed to be the same as in adult densitometry. Body size may have a pronounced effect on the HΕ because a smaller body size (less tissue thickness) may result in a greater dose to a specific organ and there is the potential for a proportionally greater amount of the body to be irradiated. Several studies have attempted to define HΕ in children for total body, PA lumbar spine, and proximal femur studies on both pencil-beam and fan-array densitometers [4–6]. Because the skin entrance doses are lower with pencil-beam systems than with fan-array systems, the HΕ on a pencil-beam system will also be lower, all other things being equal. On the Lunar DPX-L, a pencil-beam DXA device, the HΕ for a 5- and 10-year-old child for a PA lumbar spine study was estimated to be 0.28 and 0.20 μSv, respectively [4]. For a total body study, the HΕ values were 0.02 and 0.02 μSv. As expected, higher values for the HΕ were found by Thomas et al. [5] and Blake et al. [6] for Hologic fan-array systems. Thomas et al. [5] estimated an HΕ of 4.7 μSv for a 1-year-old for a PA lumbar spine study and values of 15.2 and 6.4 μSv for a proximal femur study in 1-year-old males and females in the fast array mode available on the QDR 4500. The difference between the males and females reflects the difference in the proportion of the gonads exposed to ionizing radiation. The effective doses calculated in this study are shown in Table 12-1. These calculations utilized the tissue weighting factors originally proposed by the ICRP in 1990 [7]. HΕ values for different Discovery/QDR 4500 scan modes were calculated by Blake et al. [6] for 5-, 10-, and 15-year-old children as well as an adult using both the ICRP60 tissue weighting factors and the newer ICRP 2007 tissue weighting factors, in which, notably, the tissue weighting factor for the gonads was decreased. These results are shown in Table 12-2. Blake et al. noted that the HΕ values were lower in the express mode, available on the Discovery, compared to the fast or array modes. All of these authors noted that the HΕ for the various scan types was very low. As was correctly pointed out by Blake et al., however, the real difference in risk is underestimated by the HΕ in children compared to adults because of the greater sensitivity of growing tissues and the longer life expectancy of the child. In keeping with the principle of ALARA, the HΕ should be kept as low as possible by using the fastest scan mode that is appropriate, shortening the scan length to accommodate the child, and by using careful technique to avoid scan restarts and repeats.
Table 12-1
Effective dose for DXA scans on a Hologic QDR 4500A densitometer as a function of age (Reproduced with permission of Elsevier from Thomas SR, et al. Effective dose of dual-energy X-ray absorptiometry scans in children as a function of age. J Clin Densitom 2005;8:415–422)
Age (yr) | Lumbar spine scana (fast array mode) | Total body scan | Hip scan (fast array mode) | Forearm scana | ||
|---|---|---|---|---|---|---|
Male | Female | Male | Female | |||
1 | 4.7 | 3.4 | 3.5 | 15.2 | 6.4 | 0.14 |
5 | 3.3 | 2.9 | 3.0 | 13.2 | 6.1 | 0.10 |
10 | 2.7 | 2.5 | 2.7 | 8.3 | 5.6 | 0.066 |
15 | 2.2 | 2.0 | 2.2 | 6.3 | 4.7 | 0.03 |
Adult | 2.2 | 1.8 | 2.1 | 5.1 | 4.6 | 0.03 |
Table 12-2
Effective doses (μSv) from spine, hip, and total body DXA examinations for different Discovery/QDR4500 scan modes (Reproduced with permission of Elsevier from Blake GM, et al. Comparison of effective dose to children and adults from dual x-ray absorptiometry examinations. Bone 2006;38:935–942)
Scan length | Adult | 15-year-old child | 10-year-old child | 5-year-old child | |||
|---|---|---|---|---|---|---|---|
Default | Scaled | Default | Scaled | Default | Scaled | Default | |
Spine scan modes | |||||||
Array (ICRP-60) | 13.3 | 14.8 | 16.9 | 21.3 | 33.4 | 27.3 | 48.3 |
Fast (ICRP-60) | 6.7 | 7.4 | 8.5 | 10.6 | 16.7 | 13.7 | 24.1 |
Express (ICRP-60) | 4.4 | 5.0 | 5.6 | 7.1 | 11.1 | 9.1 | 16.1 |
Express (ICRP2005) | 4.4 | 4.9 | 5.5 | 6.9 | 10.2 | 8.8 | 14.4 |
Hip scan modes | |||||||
Array (ICRP-60) | 9.3 | 11.1 | 11.3 | 17.8 | 20.1 | 22.2 | 29.4 |
Fast (ICRP-60) | 4.7 | 5.5 | 5.6 | 8.9 | 10.0 | 11.1 | 14.7 |
Express (ICRP-60) | 3.1 | 3.7 | 3.9 | 5.9 | 6.7 | 7.4 | 9.8 |
Express (ICRP2005) | 2.4 | 2.7 | 2.8 | 4.1 | 4.5 | 4.9 | 6.1 |
Whole-body scans | |||||||
Discovery-A | 4.2 | – | 4.2 | – | 4.8 | – | 5.2 |
Discovery-W | 8.4 | – | 8.4 | – | 9.6 | – | 10.5 |
Bone Age
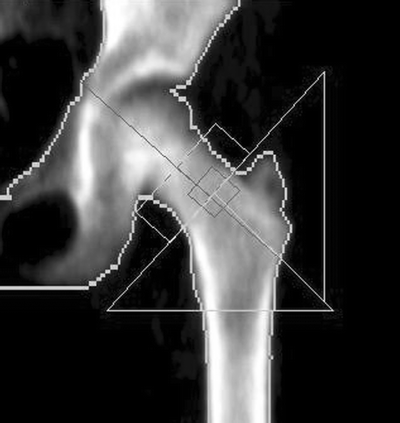
Bone age is not necessarily the same as a child’s chronological age. Bone age is a reflection of the developmental maturity of the skeleton. The presence of unfused and fused epiphyses is a reflection of developmental maturity. The epiphyses are secondary ossification centers at the ends of long bones and are responsible for longitudinal growth. The epiphyseal plate deposits cartilage which is subsequently becomes bone. Ultimately the epiphysis itself becomes engulfed in bone. Longitudinal growth stops and the epiphysis is then said to be “fused” with the rest of the bone. After fusion, the only remnant of the ossification center is a line of demarcation called the epiphyseal line. The presence of unfused epiphyses will cause a DXA image that appears bizarre to the densitometrist accustomed to adult images such as the proximal femur image in Fig. 12-1. The greater trochanter is not completely formed or fused with the rest of the proximal femur. Ossification in the greater trochanter begins around the age of 3, but is not complete until around the age of 18 [8]. Fusion of the femoral head and lesser trochanter to the proximal femur is also generally not complete until around the age of 18. The typical adult appearance of the vertebrae is not seen in young children. There are ringlike epiphyses on the upper and lower surfaces of the vertebral bodies that appear around the age of 16 but which do not fuse with the rest of the vertebral body until around the age of 25. Other regions that are commonly studied with DXA in which unfused epiphyses may be seen are the heel and the forearm. The secondary ossification center in the posterior calcaneus appears around the age of 7 and fuses at puberty. At the distal radius and ulna, secondary ossification centers appear by ages 1 and 5, respectively, although neither fuses until around the age of 20.


Fig. 12-1.
A DXA image of a proximal femur in a child. The greater trochanter in particular appears unusual. The greater trochanter is not fully formed and will not completely fuse to the femoral neck and shaft until approximately 18 years of age (Case Courtesy of GE Healthcare, Madison, WI).
The state of the secondary ossification centers in the hand is used to determine bone age. There are two techniques that are traditionally used to make this determination: the Greulich and Pyle method and the Tanner and Whitehouse method [9, 10]. The Greulich and Pyle method requires a comparison of all the bones in the hand and wrist against reference X-rays for a wide range of ages. The technique has been modified in many centers to a comparison of the overall appearance of the child’s hand to a set of reference radiographs. The Tanner and Whitehouse method2 requires a systematic assessment of the maturity of all the bones in the hand and wrist and employs a point scoring system to determine skeletal maturity. Although studies [11, 12] have suggested that the two techniques give similar results, some authorities prefer the Tanner and Whitehouse method. Bone age is not determined from a DXA study. However, the interpretation of the bone density seen on a DXA study may well be affected by knowledge of the child’s bone age. For example, if the child’s bone age is less than their chronological age, their bone density would not be expected to be the same as their chronological peers.
Sexual Maturation Stage
Another important element in the interpretation of pediatric bone density measurements is knowledge of the level of sexual development of the child. This assessment is usually made by determining the Tanner3 stage [13


Stay updated, free articles. Join our Telegram channel

Full access? Get Clinical Tree


