Abstract
Objective
To investigate Sonazoid contrast-enhanced ultrasound (CEUS) features of intrahepatic cholangiocarcinoma (ICC) based on liver backgrounds and tumor sizes.
Methods
A retrospective analysis was conducted on patients with histopathologically diagnosed ICC at two centers. Patients underwent Sonazoid CEUS examination at a dose of 0.0165 mL/kg before surgery or biopsy. Continuous imaging was recorded for the first 70 s, followed by intermittent scanning every 15–20 s for 5 min, with a Kupffer phase captured after an 8-min delay. Patients were categorized by liver backgrounds and tumor sizes. Two ultrasound experts evaluated the enhancement patterns of ICCAs during the arterial, portal, delayed, and Kupffer phases according to current guidelines.
Results
From February 2019 to July 2022, a total of 85 ICC lesions were included. ICCs were categorized into normal liver (n = 24), chronic liver disease with fibrosis (n = 40), and cirrhosis (n = 21) groups based on different liver backgrounds, and into groups measuring ≤30 mm (n = 22), 31–50 mm (n = 32), and >50 mm (n = 31) based on tumor sizes. Most ICCs in liver fibrosis or liver cirrhosis tended to show non-rim enhancement in arterial phase ( p = 0.022) and relatively later washout (39.9 ± 8.5 s vs. 39.7 ± 13.0 s) compared with those on a normal liver background (28.1 ± 5.6 s) ( p < 0.001). Based on CEUS Liver Imaging Reporting and Data System, the diagnostic performance of LR-M criteria showed an accuracy of 100% in our high-risk populations. ICCs of ≤30 mm more commonly showed non-rim enhancement in arterial phase ( p = 0.003) and relatively later washout (41.3 ± 12.5 s) compared with larger ICCs ( p = 0.046). In the Kupffer phase, all ICCs showed marked washout with sharp margin delineation on Sonazoid CEUS, regardless of liver backgrounds and tumor sizes.
Conclusion
Sonazoid CEUS features of ICCs differ according to different liver backgrounds and tumor sizes. Arterial phase non-rim enhancement and relatively later washout were more commonly observed in ICCs on liver fibrosis or cirrhosis background or smaller ICCs (≤30 mm).
Introduction
Intrahepatic cholangiocarcinoma (ICC) is the second most common primary liver cancer, accounting for ≤20% of all hepatic malignancies [ ]. ICC often develops on a background of chronic inflammation leading to cholestasis and resultant cholangiocyte injury [ ]. However, it has been demonstrated that cirrhosis and viral infections caused by hepatitis B and C are strong risk factors for cholangiocarcinoma, especially for intrahepatic disease [ ]. Compared with ICC in the non-cirrhotic liver, ICC in the cirrhotic liver might exhibit different histologic and imaging characteristics [ ]. Most patients with ICC are asymptomatic during early stages of the disease. Therefore, ICC is diagnosed frequently at an advanced stage due to its silent clinical character [ ]. Currently, the main treatment remains curative-intent liver resection, supplemented with systemic therapy including the neoadjuvant treatments [ ]. The 5-y overall survival rate maintains at approximately 9% for patients with ICC in most regions [ ].
ICC is diagnosed primarily with laboratory workup encompassing liver function and tumor markers, imaging findings, and histopathologic findings of liver biopsies. In patients with suspected ICC without prior liver-specific imaging approaches, the initial imaging examination is typically multiphasic, contrast-enhanced, multi-detector–row computed tomography scans or contrast-enhanced magnetic resonance imaging [ ]. Computed tomography and magnetic resonance imaging examinations showed considerable advantages in the detection and diagnosis of primary and satellite ICCs [ ]. However, computed tomography scans and magnetic resonance imaging also have limitations such as potential exposure to radiation, allergy to contrast agents, being time consuming, and lacking repeatability in short time intervals.
Contrast-enhanced ultrasound (CEUS) examination is an essential add-on imaging method to conventional B-mode ultrasound (BMUS), allowing the assessment of enhancement patterns and degrees of focal liver lesions (FLLs) [ ]. Various studies have proved that CEUS examination has a high diagnostic accuracy in the characterization of FLLs in both non-cirrhotic and cirrhotic liver backgrounds [ , ]. Perfluorobutane (Sonazoid, GE Healthcare, Chicago, IL, USA) with Kupffer phase imaging is also approved for liver CEUS imaging, which allows the longer period of ≤10 min for the evaluation of washout features [ ]. Kupffer phase imaging has the potential to enhance the characterization of FLLs in cirrhotic livers significantly by leveraging Kupffer cell-related enhancement. In addition, this technique provides superior lesion-to-liver contrast compared with the portal or delayed phases, which can enhance guidance during interventional procedures such as biopsy or ablation [ , ]. However, most reported Sonazoid CEUS studies of ICC predominantly focus on non-cirrhotic liver backgrounds. In the non-cirrhosis liver background, CEUS features of ICCs may show some similar features like hepatocellular carcinoma (HCC), such as a relatively early washout in the portal venous phase [ ]. In addition, previous studies reported that some ICCs may show some similar imaging features to HCC in the cirrhotic liver, although the incidence was low [ , ]. A considerable knowledge gap still exists regarding Sonazoid CEUS characteristics of ICCs in individuals with liver fibrosis or cirrhosis, who represent another high-risk group.
The aim of our study was to analyze Sonazoid CEUS features in histopathologically confirmed ICC cases, according to different liver backgrounds and tumor sizes.
Methods
Study design
In this two-center study, patients with histopathologically proven ICC lesions from two tertiary academic centers were included retrospectively. The study protocol was reviewed and approved by the institutional review boards. The requirement for informed consent was waived. All studies were performed in accordance with the Declaration of Helsinki.
The inclusion criteria were (i) patients >18 y old with suspected FLLs in normal liver, liver fibrosis and cirrhosis; (ii) patients who underwent preoperative Sonazoid CEUS within 1 wk of surgical resection or core needle biopsy; and (iii) patients with histopathologically proven ICC lesions via surgical resection or biopsy. The exclusion criteria were (i) patients whose ultrasound images were of poor quality; (ii) patients underwent previous neoadjuvant treatment, such as radiotherapy or chemotherapy, before surgery or biopsy; and (iii) patients were recipients of liver transplants.
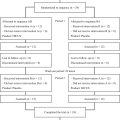
Patient demographics, laboratory data including carbohydrate antigen 19-9 (U/mL), and histopathologic results were collected. A flow diagram for the study population is presented in Figure 1 . Tumors were categorized by liver background into normal liver, chronic liver disease with fibrosis, and cirrhosis groups based on histopathologic results of surrounding liver parenchyma, and by tumor sizes measured on BMUS scan into ≤30 mm, 31–50 mm, and >50 mm groups.

CEUS acquisition
All ultrasound examinations were performed by two experts with >20 y of experience in liver CEUS examinations. A standardized CEUS protocol was used as recently described in a series of papers for characterization of FLLs [ , ]. All ultrasound examinations were performed by four premium ultrasound systems: Acuson Sequoia unit (Siemens, Munich, Germany), Resona R9 Super (Mindray, Shenzen, China), RS85 (Samsung, Suwon-si, South Korea), and LOGIQ E9 (GE Healthcare). Sonazoid was used at a dose of 0.0165 mL/kg, injected via a 20-gauge intravenous cannula placed in the antecubital fossa vein, followed by 5 mL of saline solution. After the injection, a continuous image clip was recorded for first 70 s, and then intermittently scanned every 15–20 s for 5 min. In addition, Kupffer phase was obtained with a delay of >8 min. All FLLs were observed during the arterial phase (10–45 s), portal venous phase (45–120 s), late phase (2–8 min) and Kupffer phase (>8 min) [ ]. All ultrasound examinations were recorded digitally for analysis.
Image analysis
All images and videos were reviewed by two ultrasound experts with >20 y of experience in liver CEUS imaging, who were unaware of patients’ clinical histories, other imaging findings, or histopathologic results. CEUS features were analyzed according to current World Federation for Ultrasound in Medicine and Biology (WFUMB) guidelines [ ] and CEUS Liver Imaging Reporting and Data System (LI-RADS) [ ].
Conventional ultrasound features were analyzed and recorded, including tumor location, size, echogenicity, margin, shape, and color Doppler flow imaging features. In patients with multiple lesions, only the largest lesion was observed and analyzed.
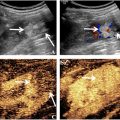
During the arterial phase, enhancement patterns were recorded including rim-like hyper-enhancement and non-rim enhancement (diffuse hyper-enhancement, dendritic hyper-enhancement, or iso-/hypo-enhancement). In addition, tumor sizes on BMUS and CEUS mode were measured and compared. The enlarged margin delineation was evaluated accordingly. During portal venous phase, late phase, and Kupffer phase, washout time and degree of ICCs were evaluated ( Fig. 2 ).

Statistical analysis
Categorical parameters were expressed as frequencies and proportions, and tested between groups by the χ 2 test or Fisher’s test. Normally distributed continuous parameters were reported as mean with standard deviation and tested with the Student t test or one-way analysis of variance. A p value < 0.05 was considered to be statistically significant. All analyses were performed by SPSS Statistics 20.0 (SPSS, Inc, Armonk, NY).
Results
Baseline characteristics of patients
From February 2019 to July 2022, data from a total of 85 patients (median age, 62.9 ± 9.5 y; 53 males and 32 females) were collected retrospectively. In patients with liver fibrosis or cirrhosis (n = 61), all patients had underlying liver diseases, including hepatitis B virus infection (n = 36), hepatitis C virus infection (n = 5), non-alcoholic fatty liver disease (n = 13) and alcoholic liver disease (n = 7). The baseline characteristics of the patients are presented in Table 1 .
| Characteristics | Patients (n = 85) |
|---|---|
| Age (y) | |
| Mean | 62.9 ± 9.5 |
| Range | 37–83 |
| Gender | |
| Male | 53 (62.4%) |
| Female | 32 (37.6%) |
| Patients with liver fibrosis or cirrhosis | |
| Chronic liver disease with fibrosis | 40 (47.1%) |
| Liver cirrhosis | 21 (24.7%) |
| Aetiology | |
| HBV infection | 36 (42.4%) |
| HCV infection | 5 (5.9%) |
| NAFLD | 13 (15.3%) |
| Alcoholic liver disease | 7 (8.2%) |
| CA19-9 level (U/mL) | |
| Median | 29.3 |
| Range | 2.0–64,567 |
| Elevated | 42 (49.4%) |
| Number of FLL | |
| Single | 66 (77.6%) |
| Multiple | 19 (22.4%) |
Ultrasound findings of ICCs in different liver backgrounds
Based on different liver backgrounds, ICC lesions were divided into a normal liver group (n = 24), chronic liver disease with fibrosis group (n = 40) and a liver cirrhosis group (n = 21) ( Table 2 ).
| Characteristics | Liver backgrounds | p Value | Tumor sizes | p Value | ||||
|---|---|---|---|---|---|---|---|---|
| Normal liver (n = 24) | Liver fibrosis (n = 40) | Liver cirrhosis (n = 21) | ≤30 mm (n = 22) | 31–50 mm (n = 32) | >50 mm (n = 31) | |||
| Echogenicity | <0.001 | 0.063 | ||||||
| Hypoechoic | 19 (79.2) | 30 (75.0) | 3 (14.3) | 11 (50.0) | 16 (50.0) | 25 (80.6) | ||
| Hyperechoic | 3 (12.5) | 4 (10.0) | 14 (66.7) | 8 (36.4) | 9 (28.1) | 4 (12.9) | ||
| Mixed echoic | 2 (8.3) | 6 (15.0) | 4 (19.0) | 3 (13.6) | 7 (21.9) | 2 (6.5) | ||
| Size of lesions (mm) | 54.6 ± 25.9 | 49.2 ± 22.5 | 33.6 ± 21.0 | 0.009 | 20.7 ± 6.6 | 39.8 ± 5.3 | 72.7 ± 18.4 | / |
| Colour flow signals | 14 (58.3) | 21 (52.5) | 6 (28.6) | 0.104 | 5 (22.7) | 13 (40.6) | 23 (74.2) | 0.001 |
| Resistance index | 0.71 ± 0.09 | 0.69 ± 0.09 | 0.69 ± 0.04 | 0.767 | 0.68 ± 0.04 | 0.69 ± 0.10 | 0.71 ± 0.08 | 0.495 |
| AP enhancement pattern | 0.022 | 0.003 | ||||||
| Rim hyper-enhancement | 12 (50.0) | 10 (25.0) | 3 (14.3) | 1 (4.5) | 9 (28.1) | 15 (48.4) | ||
| Non-rim enhancement | 12 (50.0) | 30 (75.0) | 18 (85.7) | 21 (95.5) | 23 (71.9) | 16 (51.6) | ||
| Diffuse hyper-enhancement | 6 (25.0) | 11 (27.5) | 12 (57.1) | 11 (50.0) | 11 (34.4) | 7 (22.6) | ||
| Dendritic hyper-enhancement | 1 (4.2) | 12 (30.0) | 2 (9.5) | 2 (9.1) | 5 (15.6) | 8 (25.8) | ||
| Iso-/hypo-enhancement | 5 (20.8) | 7 (17.5) | 4 (19.0) | 8 (36.4) | 7 (21.9) | 1 (3.2) | ||
| Washout time | ||||||||
| Washout time (s) | 28.1 ± 5.6 | 39.9 ± 8.5 | 39.7 ± 13.0 | <0.001 | 41.3 ± 12.5 | 35.1 ± 9.8 | 34.7 ± 8.9 | 0.046 |
| Early (<60 s) washout | 24 (100) | 38 (95.0) | 21 (100) | 0.496 | 20 (91.0) | 32 (100) | 31 (100) | 0.065 |
| Washout degree | ||||||||
| PVLP marked washout | 24 (100) | 38 (95.0) | 18 (85.7) | 0.109 | 19 (86.4) | 31 (96.9) | 30 (96.8) | 0.294 |
| KP marked washout | 24 (100) | 40 (100) | 21 (100) | / | 22 (100) | 32 (100) | 31 (100) | / |
| Margin delineation | ||||||||
| BMUS unclear | 22 (91.7) | 37 (92.5) | 15 (71.4) | 0.075 | 18 (81.8) | 27 (84.4) | 29 (93.5) | 0.430 |
| AP enlarged | 5 (20.8) | 5 (12.5) | 4 (19.0) | 0.650 | 5 (22.7) | 4 (12.5) | 5 (16.1) | 0.619 |
| KP marked | 24 (100) | 40 (100) | 21 (100) | / | 22 (100) | 32 (100) | 31 (100) | / |
Related posts:
 Relationship Between Early and Established Rheumatoid Arthritis Vascular Change of the Dorsalis Pedis Artery Observed with Ultrasound Imaging
 Effects of High-intensity Continuous Ultrasound on Infrapatellar Fat Pad Stiffness and Gliding in Healthy Participants: A Randomized, Single-blind, Placebo-controlled Crossover Trial
 Strain Patterns With Ultrasound for Assessment of Abdominal Aortic Aneurysm Vessel Wall Biomechanics
 Evaluation of Renal Masses Using Contrast-Enhanced Ultrasound with Sonovue and Sonazoid
 Ultrasound and Microbubble-Induced Reduction of Functional Vasculature Depends on the Microbubble, Tumor Type and Time After Treatment
Stay updated, free articles. Join our Telegram channel

Full access? Get Clinical Tree


