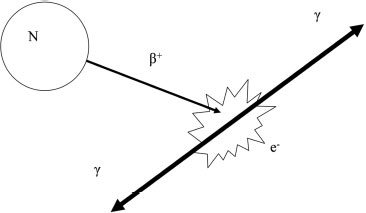
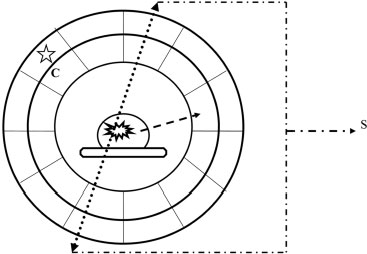
4 PET-CT in Breast Cancer Diagnosis Positron emission tomography (PET) uses radioactive elements that emit positrons to produce images. These radioactive elements have too much energy, so they are unstable and decay to a more stable state by converting a proton into a neutron, a positron, and a neutrino. The positron, which is a positively charged electron, is ejected from the nucleus and is quickly combined with an electron. This collision of matter and antimatter produces two photons of light that travel in opposite directions (Fig. 4.1). The distance traveled by the position for the isotope (radioactive element) fluorine-18 (F-18) is less than a millimeter. F-18 is incorporated into 18 F-fluorodeoxyglucose (FDG), which is the most commonly used radioactive tracer for breast cancer. The half-life of F-18, or the time it takes for half of the radioactive nuclei to decay, is 109 minutes. FDG was first synthesized in 1976 as a collaborative effort among the National Institutes of Health, the University of Pennsylvania, and Brookhaven National Laboratory. FDG is similar to glucose. Therefore, like glucose, FDG reaches the cell in the blood plasma and is transferred into the cell by glucose transporters. Within the cell, the FDG is transformed by the enzyme hexokinase and is phosphorylated. However, because of the chemical differences between FDG and glucose, the cell cannot further metabolize FDG in the same manner as glucose. The phosphorylated FDG cannot exit the cell membrane and therefore is trapped and accumulates within the cell. Accumulation of FDG within a breast lesion is dependent on multiple factors, including blood flow to the lesion (tissue perfusion), cell density (the higher the density, the greater the FDG), and the permeability of the cell membrane to FDG. Because FDG requires glucose transporters to move into the cell, cells with more transporters have a higher concentration of FDG. Furthermore, insulin facilitates glucose transmission and therefore also enhances FDG transport. Finally, glucose competes with FDG for transport, so high glucose levels reduce FDG transport. Fig. 4.1 Schematic of positron emission. The unstable nucleus (N) emits a positron (β+), which quickly combines with an electron (e−). This collision creates two photons (γ), which travel in opposite directions. The FDG within the cell emits positrons, which are annihilated by electrons and produce photons. These photons are then emitted and detected by the PET scanner, which is a cylindrical tube that surrounds the patient. This cylinder consists of two layers: an inner layer of scintillation crystals and an outer layer of photomultiplier tubes. The two photons simultaneously hit two scintillation crystals that are positioned 180 degrees from each other. The light from these crystals passes into the photomultiplier tubes. Within the photomultiplier tubes, the energy from the light is amplified and converted into an electrical signal that is then processed by a computer. The computer calculates the original location of the positron emission and converts this information into an image. The PET scanner records only photons that are simultaneously identified at 180 degrees. Random single photons or photons that are not 180 degrees apart are not recorded. This technique minimizes introducing scatter or artifactual information into the image (Fig. 4.2). Positron emission tomography–computed tomography (PET-CT) machines have the ability to perform PET and CT without moving the patient. The PET-CT scanner sequentially performs the CT and then the PET scan on the same patient. Software then displays the PET and CT information either separately or as superimposed images. PET scans identify accumulation of FDG with both visual and quantitative information. Areas of increased FDG appear dark (using gray scale) or a lighter color compared with surrounding tissues. When an abnormal lesion is suspected, the imager measures the FDG radioactivity or the standardized uptake value (SUV) of the area. The SUV is determined by either manually drawing a region of interest or using automated methods. The SUV is not an absolute measurement; it is a measurement that is relative to the FDG uptake in the rest of the body. The assumption is that if the FDG is distributed evenly throughout the body, normal tissue would have an SUV equal to 1. Many factors affect SUV measurements. SUV is generally proportional to body weight. However, in obese patients, this calculation tends to overestimate the SUV because FDG uptake in fat is low compared with other tissues. This error can be minimized by using lean body mass or body surface area. As noted earlier, high glucose levels decrease FDG cellular absorption. Therefore, hyperglycemia may reduce the SUV of a lesion. If the radioactive material extravasates in the soft tissues at the injection site, the patient’s reduced dose may decrease the SUV. SUV calculations are dependent on accurately defining the abnormal lesion. If the defined area is larger than the lesion, then the SUV will be low. SUV numbers are commonly poorly reproducible between institutions and patient populations, so one should be careful about placing considerable diagnostic confidence in the numerical SUV value of a lesion. Fig. 4.2 Schematic of a PET scanner. The PET scanner consists of two layers: the scintillation crystal (C) and the photomultiplier tubes (star). The positron–electron collision creates two photons (dotted arrows) that travel 180 degrees from each other. These photons strike the scintillation crystals, which convert the photon energy to light. The emitted light is then transferred to the photomultiplier tubes. The photomultiplier tubes transmit the signal (S) to a computer, and the location of the original positron collision is calculated. This information is then combined with other positron collisions, and an image is produced. Random photons (dashed arrow) that are not paired with another photon do not create a signal and do not contribute to the image.
 Physics and Instrumentation
Stay updated, free articles. Join our Telegram channel

Full access? Get Clinical Tree


