Fig. 3.1
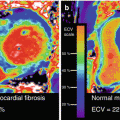
Attenuation correction in cardiac PET. Attenuation correction is the cornerstone of quantification in PET imaging. Cardiac PET is especially prone to this as shown below. In contrast to cardiac SPECT where non-AC data are routinely used in the clinical reading, the effects in PET are much larger (left column). Even modest misalignment of 6 mm as shown in the right column alters the apparent tracer distribution
In stand-alone PET systems the attenuation map is generated by a rotating rod source, while in PET/CT systems the attenuation map is estimated from CT data. This adds to the total radiation exposure; however, using suitable protocols, values as low as using rotational sources can be achieved [14, 15]. Unfortunately, MRI is not able to directly retrieve the desired information as it has no access to the absorption of high-energy photons. We approached this problem by using tissue segmentation and assigning standardized, non-patient-specific attenuation values to the tissue classes (Fig. 3.2) [16].
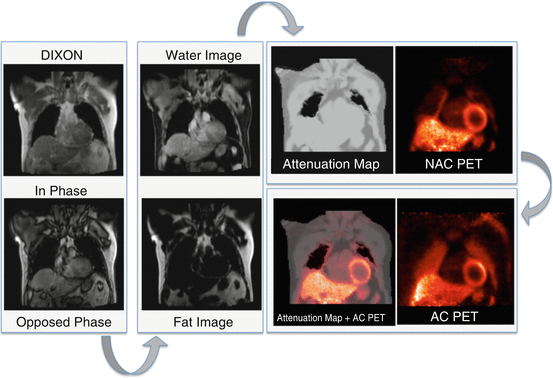

Fig. 3.2
Attenuation correction in PET/MR. The attenuation map is generated using in- and opposed-phase MR Dixon images from which fat and water images are computed. In the attenuation map air, lung, fat, and soft tissues are automatically segmented. Using this attenuation map and NAC (non-attenuation-corrected) PET data, the final AC PET images are calculated
As in stand-alone PET using rod sources, the cortical bone is ignored. The acquisition of these images requires usually about 18 s per bed position during one breath-hold. Alternatively, T1-weighted turbo spin-echo sequences are used with the advantage of a shorter acquisition time but combining fat and water into a single tissue class [17]. Obviously, the major disadvantage of the segmentation-based approach is the limited number of tissue classes especially if a significant inter-patient variability in lung structure and location could be anticipated. General disadvantages of this approach are that metal implants do not contribute to the attenuation map and that contrast agents may cause inaccuracies due to reduced T1 values (Fig. 3.3) [18]. However, this segmentation-based approach is currently used in commercially available PET/MRI scanners [16, 17], and our group has demonstrated a good correlation between PET/MRI and PET/CT data in oncologic studies [19]. Initial work in cardiac patients has also shown good agreement between sequentially acquired patients with PET/CT and PET/MRI [20].
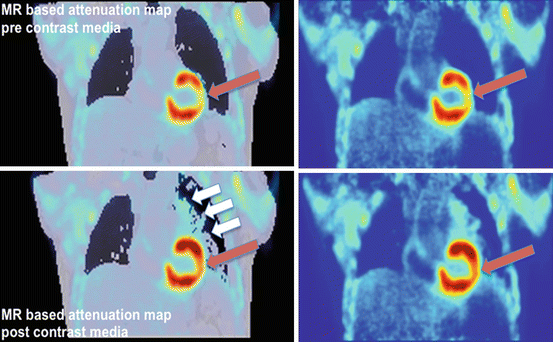

Fig. 3.3
AC pre/post KM. Dixon-based attenuation maps prior (top left) and after (bottom left) injection of contrast media shown together with reconstructions from the same PET scan but using the respective attenuation maps. Both PET data sets are scaled to the same maximum. Due to an overcorrection caused by the (apparent) larger amount of attenuating “lung” (white arrows) tissue, the myocardial PET values using the post-contrast attenuation maps differ (red arrows)
Another PET/MRI specific limitation, which affects attenuation correction, is the limited field of view (FOV) of the MR system potentially truncating the MR data. In other words, the PET scanner has a larger FOV as the MR system. This results in MR “invisible” tissue where body parts are outside the FOV introducing a bias in the attenuation correction. Thus, based on PET emission data, tissue is extrapolated and added to the map [21, 22]. A more desirable solution would be, however, the extension of the field of view, as was recently suggested and showed promising results [23].
Multiple components outside the body but inside the PET/MRI field of view, such as coils, positioning aids, monitoring devices, cables, earphones, and the – as compared to PET/CT, more massive – patient bed, are an additional source of photon scatter and attenuation. Most of these objects are MR “invisible” and are at rather random locations and thus do not necessarily contribute (although they should do) to the attenuation map. Only the patient bed and the fixed coils with known location are added to the final attenuation map [24–26]. As a result of this issue, vendors of such devices have redesigned them to reduce size and weight, but the effects are still measurable although small. If this has a relevant impact on the diagnostic performance, however, is not known yet. It might be anticipated that the effects are in the same order of objects overestimated in PET/CT imaging due to CT reconstruction artifacts or non-ferromagnetic signal voids in non-hybrid MR imaging.
A special group of artifacts in cardiac imaging arises from implantable devices. In difference to cardiac PET/CT and SPECT/CT, implantable cardiac devices (ICDs, CRT devices, or pacemakers) are of significant concern in MR imaging. As mentioned before, the devices cause CT artifacts, which potentially result in a biased attenuation correction, although initial work in PET/CT showed only little effects [27]. But in MRI, the effects are twofold. Nonmagnetic metals disturb the homogeneity of the magnetic field and cause signal voids, which clearly exceed the actual size of the object and thus underestimate the true attenuation. The second, more critical effect stems from an interaction with the radiofrequency and could cause life-threatening malfunction or local heating. Thus, many patients are excluded from MRI (including PET/MRI) which represents an increasing problem as the number of patients with diseases qualifying for the implantation of those devices is growing [28, 29]. Although newer generations of these devices are MR compatible, the logistical hurdles are significant and the procedures can be time-consuming. In general, it is advisable that the clinical reader is informed about potential sources of artifacts and a strict quality control with a special emphasis on correct alignment of MR-derived attenuation correction maps and PET data should be performed.
3.2.2 Imaging Workflow
We mentioned already that proper attenuation correction and exact alignment of the attenuation map is mandatory for correct diagnostic performance. Regarding this point, one major advantage of MR compared to CT is that the AC scan may be repeated as often as necessary without any ionizing radiation. The subsequent choice of the optimal attenuation map, however, is rather time-consuming and thus inefficient and inconvenient. Recent developments in PET/CT, however, indicate that software-assisted solutions will become available soon [30, 31].
It is relevant to remember that considerations on PET/MRI workflows include the fact that most data are acquired in “parallel” and not “simultaneously.” PET measures in volume rather than slice modes with variable frame lengths between seconds and up to 20–30 min (or more) depending on the chosen tracer, the uptake pattern and its half-life, the injected activity, and the patience of the patient. Thus, PET data integrates always the voluntary and involuntary patient motion (respiration, contractile motion, and “true” patient motion). This is in quite some difference to the MR acquisitions. As MR is so motion sensitive due to its image generation physics, MR data is usually acquired sequentially, with slice acquisition durations ranging from milliseconds for dynamic scans to several breath-holds for high-resolution images. It is inherent to sequential imaging that if data is acquired over several breath-holds, the limited reproducibility of the patient’s breath-holding creates spatially somewhat inconstant images. This has an underestimated limitation that ungated (regarding the cardiac cycle and the ventilation) PET images are fused with spatiotemporal consistent MR images (e.g., end-diastole in expiration). Related to this, the reading process of PET/MRI data is more complex than typically found in PET/CT or SPECT/CT as PET volume data ultimately is mapped on various (partly overlapping) MR slices acquired in various positions and orientations (e.g., short axes; two-, three-, and four-chamber view). This is tedious, and the future will hopefully bring motion-triggered acquisition [32] or software corrections [33] in order to allow free-breathing imaging.
However, there are also applications that might benefit from truly simultaneous acquisition of PET and MR data. Potential workflows are depicted in Fig. 3.4. Synergistic benefits of integrating PET (with its vast variety of specific tracers, its good volume coverage) and MRI (with its high in-plane resolution) are rather compact protocols with a maximum of 30 min scan time. Today, clinical MRI in the heart is realistically a matter of 45–60 min, and all aspects of perfusion, contractile function, and metabolic surrogate parameters are measured sequentially. Thus, integrated PET/MRI could increase patient comfort and throughput and thus cost-effectiveness which potentially offset the significant more expensive costs of the device. Cardiovascular PET/MRI has the advantage that typically only a limited area in the body is investigated which reduces the scan time in difference to complex whole-body protocols in oncological imaging. However, simultaneous PET/MRI imaging is challenging from the operational perspective: it needs to be kept in mind that perfectly matching image data do not come automatically and considerable user interaction is needed. Compared with the highly automated workflows in PET/CT and SPECT/CT, this is a major limitation today. Finally, cross-training of the involved personnel operating the scanner is obligatory which holds also true for professionals planning and interpreting the scan. Consequently, a closer-than-usual collaboration between nuclear medicine physicians, radiologists, cardiologists, and physicists and technologists is mandatory.
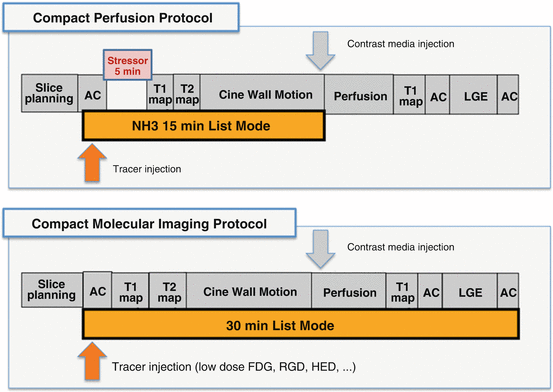

Fig. 3.4
Potential workflows (compact stress/rest perfusion, molecular imaging) for simultaneous PET/MRI
3.3 Cardiac Applications in PET/MRI
3.3.1 Myocardial Perfusion
Awhile being a fundamental advantage of cardiac PET, absolute quantification is one of the major limitations of MRI. MR signal intensities depend on a vast array of parameters such as imaging hardware (transmitters, receivers, amplifiers, gradients, coils, etc.), pulse sequences, as well as many other features which vary between vendors, magnetic field strengths, and scanner models (Fig. 3.4). Although usually irrelevant in morphological imaging, quantification of MR signal is an important step in dynamic MR imaging. Due to its superior time resolution, the true potential in quantitative MRI lies in dynamic data, even if this term is used somewhat differently as compared to nuclear medicine. Basically, it refers to a series of images, where either acquisition parameters varied (such as the inversion time in T1 mapping or the gradients in diffusion imaging) or – more familiar to nuclear cardiology – which are acquired after the injection of MR contrast media.
Perfusion imaging is, as mentioned earlier, a traditional domain of nuclear imaging for the diagnosis of a flow-limiting stenosis in coronary artery disease (CAD), and the investigation of the hemodynamic significance of known CAD is of high clinical relevance. There is increasing evidence that PET MPI offers advantages over the traditional SPECT-based approach due to the absolute quantification of myocardial blood flow (MBF), the validated attenuation correction, and the superior image quality in obese patients [34, 35]. Three PET perfusion tracers have been established: 13N ammonia (13NH3), 15O water, and rubidium (82Rb). 13NH3, 15O water, and 82Rb have the advantage of a relatively short half-life, which is about 10 min for 13NH3, 122 s for 15O water, and 76 s for 82Rb, which allows for rapid PET MPI scans in rest and under stress. Recently, 18F flurpiridaz was introduced in early trials and has been shown to offer some advantages, e.g. a low positron energy and a half-life with the same logistical advantages as 18F-FDG [36].
But despite the established role of PET MPI, myocardial perfusion imaging using dynamic contrast-enhanced (DCE-) MRI is a research since almost two decades and has shown promising results when compared to PET [5, 37, 38]. MRI perfusion imaging has a much greater availability than cardiac PET, a lower examination cost, and no ionizing radiation. MRI usually offers much greater spatial in-plane resolution than PET, enabling the possibility of voxel-wise quantitative perfusion analysis with a resolution of at least 2 × 2 × 8mm3 – although still at the price of limited LV coverage [39]. A spatial resolution of three to six slices per cardiac cycle can be achieved with reasonable SNR, surpassing the temporal capabilities of PET imaging. Independent of the competitive ambitions of MRI to take its share in the large market of diagnosing CAD, there is also great potential for integrated systems concerning the creation of synergies. To elucidate that potential, we briefly compare “perfusion” imaging as realized by both modalities.
For PET, the frame rate is usually in the order of 10 s, which is too low to actually observe the tracer’s transit through the vascular space. Thus, PET MBF is estimated by observing tracer extraction from the vascular space into those parts of the myocardium where tracer kinetics are slow compared to the minimal frame rate. Retainable tracers as the ones listed above (with the exception of 15O water) are indeed conceptually quite similar to microspheres [40], however adapted for noninvasive application. The main design criterion for those compounds is how efficiently they are extracted from the blood pool and transferred into the myocytes. Depending on the tracer, multi-compartmental modeling is used to map the diffusive extraction from the blood pool and subsequent retention inside the myocytes to simpler rate constants. From the specific model, a first-pass extraction flow constant (often called K1) is calculated, which can be directly identified with MBF for freely diffusible tracers (15O) or have to be corrected in case of high flow rates (13NH3, 82Rb). In contrast, the underlying principle of myocardial MRI perfusion imaging is the direct observation of indicator convection through the vascular space, enabled by the high temporal resolution of MRI. The mathematical framework for that is the classic indicator-dilution theory as adapted for noninvasive applications by Zierler [41, 42]. This formalism, unlike compartment modeling, does not necessarily impose a priori physiological information about the structure of the tissue. Perfusion flow is described directly as the delivery amplitude of contrast media from the LV lumen (where the AIF is acquired) to the distribution volume of contrast agent in the myocardial tissue. Although rarely applied in myocardial perfusion studies, extraction-based approaches more similar to PET, e.g. the Tofts model [43], are still widely used in cerebral and oncologic studies. It is important to note though that for highly vascularized tissue or high MBFs, the “extraction” of Gd-DTPA from the vascular space is permeability limited and not flow limited [44]. This renders it virtually impossible to extrapolate flow characteristics from Gd-DTPA extraction rates at high flows, which is why an extraction-based approach is usually not suitable for myocardial perfusion imaging at stress.
An additional, highly relevant point concerning MRI perfusion is that gadolinium-based contrast agents distribute in blood plasma, but do not permeate red blood cells (and thus the whole vascular space) as the more diffusible PET tracers do which clearly affects the generated signals (Fig. 3.5). As long as flow patterns of plasma and blood cells are homogeneous, this has no influence on time-related parameters like mean indicator transit times (MTT). However, there is a need to correct for the effective difference between large-vessel hematocrit and microvascular hematocrit [45] when estimating MBF. This might affect especially stress studies [46, 47].
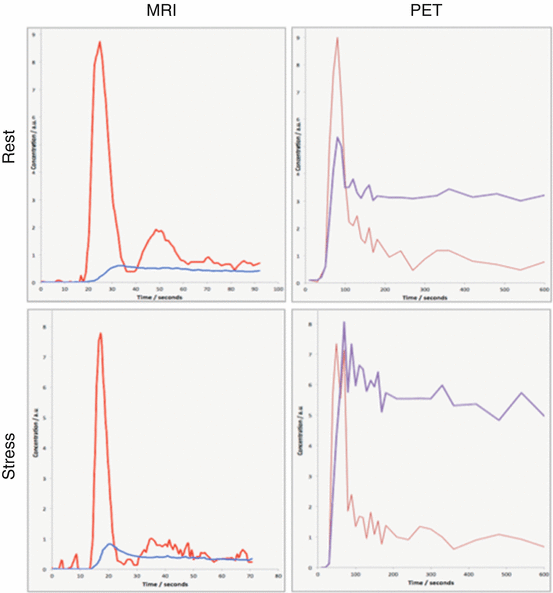

Fig. 3.5
Simultaneously acquired cardiac perfusion data. Curves are scaled arbitrarily to match peak input for improved visualization. The red curves show the left ventricular input functions and the blue curves display the tissue activity or Gd-DTPA concentrations, respectively. The different mechanisms of uptake into the cell (PET) or into the vascular and interstitial space (MRI) translate into clearly different amplitudes in the myocardial “tissue”
To which extent this has consequences in a clinical setup is unclear yet but might be one of the reasons for the per-patient variability seen in comparative studies [5]. There are several additional factors stemming from the need to accurately estimate contrast agent concentrations from MRI signal values, making data post processing much more complicated in PET. In a similar fashion as for hematocrit, those factors may affect input functions and tissue curves differently, e.g. water exchange conditions [48], Gd-DTPA relaxivity [49], AIF dispersion [50], and blood flow effects. In conclusion, despite important differences in data structure to PET, new opportunities arise from the spatially and temporally highly resolved assessment of microvascular dynamics from MRI-based flow assessments. Especially for integrated PET/MRI systems, such synergistic approaches hold great promise for future clinical applications in multimodal perfusion imaging.
3.3.2 Cardiac MRI for Tissue Characterization
Targeting the water and its properties is another technique modulating MRI to retrieve “molecular” information. In oncological imaging, using advanced imaging sequences and strong gradients, this avenue was already explored: the apparent diffusion coefficient (ADC) of water [51] is already widely used to characterize tumorous tissue. In general, water is the predominant source of the MR signal and its motility (or diffusion properties) can be used for tissue characterization. Another approach is the delineation of the longitudinal relaxation time T1. This parameter describes the potential of the exited spins to transfer their energy to the surrounding macromolecules. Thus, one of the changes in the microchemical cellular environment was the introduction of MR medical imaging as T1 values differ between healthy and tumorous tissue [52]. The so-called T1 weighting (and its modification, inversion recovery imaging) is still a fundamental imaging sequence in diagnosis imaging as different T1 values will produce different signal intensities, and thus, the contrast between healthy and abnormal tissue is optimized. For inversion recovery imaging, any signal from remote myocardium is nulled and scar tissue is enhanced in late gadolinium enhancement (LGE) [53]. More specifically, it shows areas with a different distribution volume for MR contrast agents. Accordingly, different washout kinetics from the interstitial space was shown previously in the acute as in the chronic setting of myocardial infarction [54, 55]. Unfortunately, larger clinical validations are still lacking, but two general modes of T1 mapping in the heart are already used in an increasing number of MRI centers. In the last decade, novel cardiac MR technology allowed the calculation of pixel-wise T1 maps [56]. Native T1 maps were used in imaging regional edema, fibrosis, amyloidosis, Anderson-Fabry disease, intramyocardial hemorrhage, and other structural alterations, where a modified water content and protein environment in the myocardium occurs [6]. In addition, using MR contrast media, pre- and post-contrast T1 maps enable the calculation of the extracellular volume (ECV). It was already shown that the expansion of extracellular matrix has prognostic value [57] and might have an important role in heart failure imaging. Even the term “vulnerable interstitium” was already coined in sudden death patients [58]. Although this is speculative, cardiac PET/MRI might be an excellent platform to validate and improve the characterization of myocardial tissue by integrating this information with tracer signals.
3.3.3 Improving Myocardial Tissue Characterization by 18F-FDG PET/MRI Viability Imaging
Myocardial hibernation is a well-known phenomenon where myocytes shift their metabolism from fatty acids toward glucose after chronic hypoperfusion [59]. Several preclinical and clinical studies have proved the beneficial effects of revascularization which is followed by recovery of the contractile function [60]. Several modalities showed potential to identify hibernating myocardium: dobutamine stress echocardiography, MRI, 18F-FDG PET, and late gadolinium enhancement (LGE) MRI.
Considered as “gold standard” by many imagers, nuclear cardiology offers one of the most commonly applied techniques using 18F-FDG PET as marker of myocardial viability [61]. Typically, 18F-FDG is combined with a flow marker (13N-ammonia, 82Rb, and also 99mTc-labeled SPECT agents). Based on meta-analyses the sensitivity of 18F-FDG PET to predict functional recovery after revascularization is about 92 %, while the specificity is only 63 % [62]. However, there is evidence that patients with a significant amount of dysfunctional but viable tissue should undergo revascularization as soon as possible as viability is a transient state of the myocytes [63, 64]. Especially from the point of view of spatial resolution, however, MRI offers with delayed gadolinium enhancement (LGE) a readily available approach. MRI spatial resolution is superior to PET (1–3 mm vs. 4–6 mm) which allows the differentiation between transmural and non-transmural infarction [65]. The same advantage helps with a reduced or absent 18F-FDG uptake in thinned myocardium which would potentially be miscategorized as scar by PET. Despite these fundamental differences of the approaches (imaging viable vs. nonviable tissue), a good agreement between both modalities has been demonstrated in a chronic setting [53]. From a practical perspective, LGE is independent of the excretion of insulin and shows advantage in diabetic patients where the clearance of 18F-FDG from the blood is limited and cardiac image quality is poor. However, if a hybrid use of 18F-FDG PET MRI and LGE MRI is beneficial is still subject of research and only limited data is available indicating again good agreement (Fig. 3.6) [20].
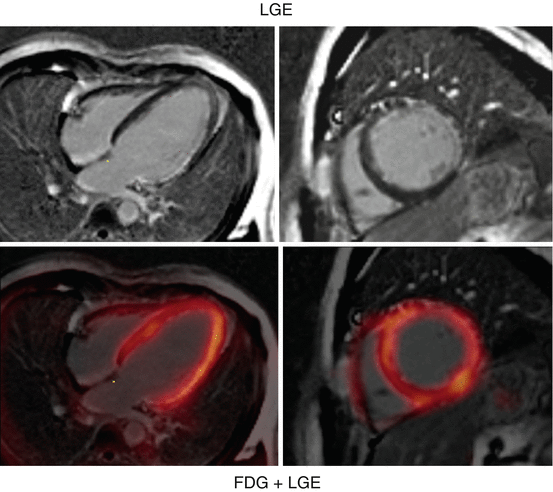

Fig. 3.6
18F-FDG PET/MRI shortly after AMI. Short- and long-axis images of a patient imaged shortly after acute MI with occlusion of the left main using simultaneous 18F-FDG PET/MRI. In the top row, the LGE images and, in the bottom row, LGE images fused with FDG are shown
In our initial experience in a similar setting, we found a small proportion of myocardial segments in disconcordance between 18F-FDG uptake and transmurality of LGE [66]. However, the clinical relevance for functional recovery in the long-term setting post-acute MI is debatable and warrants further research.
3.4 Applications in Cardiovascular Molecular Imaging: Targeting Inflammation
3.4.1 Inflammatory Response After Acute Myocardial Infarction
In the following paragraphs the delineation of (mostly) inflammatory signals is described in our first experience in distinct disease entities. Recent research has focused on the myocardial response to ischemia – with an emphasis on the cardiac inflammatory response after acute MI which is considered a risk factor for deleterious remodeling and finally the development of heart failure. The fact that monocytes migrate rapidly into the myocardium identified them as key components of cardiac inflammation [67–69]. This is a highly complex process and so far is the domain of preclinical research. However, 18F-FDG PET – due to its readily availability – is frequently used in a variety of settings, as activated inflammatory cells show increased expression of glucose transporters which can be visualized using 18F-FDG PET. This signal could be supplemented with MRI’s capability to image scar formation, microvascular obstruction, edema, hemorrhage, and left ventricular function. A recent preclinical study using a mouse infarct model of myocardial infarction showed that 18F-FDG PET/MRI quantifies the amount of accumulated monocytes in the postischemic heart if the glucose uptake of cardiomyocytes is suppressed [70]. Such a strategy would enable a detailed morphologic characterization of the infarcted heart by PET/MRI and is feasible in humans (Fig. 3.7) [71, 72].


Fig. 3.7
Multimodal characterization of the myocardial tissue after AMI using PET/MRI. Short-axis images of a patient who was imaged shortly after acute MI using simultaneous 18F-FDG PET/MRI. Myocardial scarring can be imaged using LGE MRI. Using fasted/heparin 18F-FDG PET/MRI, the area of postischemic inflammation/ischemic memory can be assessed. Myocardial obstruction is visible at the center of the LGE zone
In patients, the glucose metabolism of cardiomyocytes can be suppressed by a high-fat/low-carb diet (the so-called Atkins diet) and/or the administration of unfractionated heparin prior to 18F-FDG injection which is used, e.g., to image sarcoidosis with PET. However, there are limitations as the 18F-FDG uptake is not unique in the heart: as used in conventional viability imaging, ischemically compromised myocardium switches its metabolism from fatty acids toward glucose degradation [73]. In addition, expression of GLUT1 transporters has been demonstrated in postischemic myocardium and can persist over weeks and is responsible for the “ischemic memory” [74, 75]. Thus, 18F-FDG uptake in postischemic myocardium may not solely reflect inflammation but viable cardiomyocytes. However, if this characterization of tissue and its inflammatory state proves to be clinically reliable, it could identify patients at risk for developing heart failure or – even more relevant – it may serve as a tool to guide immunomodulatory therapeutic strategies.
Stay updated, free articles. Join our Telegram channel

Full access? Get Clinical Tree


