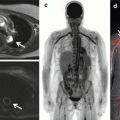
Fig. 1.1
Four current systems for PET/MR hybrid imaging: (a) Philips Ingenuity TF, (b) Siemens Biograph mMR, (c, d) GE Tri-modality MR (c) and PET/CT (d) connected via a patient table shuttle system, (e) GE Signa PET/MR. All four systems perform at 3 Tesla field strength. Systems (a) and (c, d) provide sequential PET/MR examinations while systems (b) and (e) allow for simultaneous PET and MR data acquisition
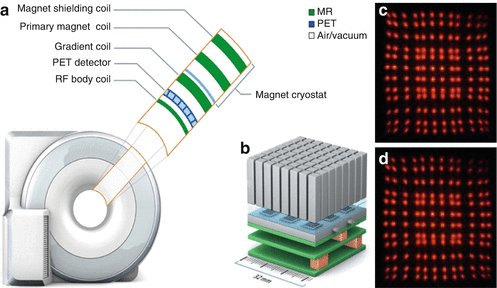
Fig. 1.2
(a) Schematic drawing of an integrated PET/MR system (Biograph mMR, Siemens AG, Healthcare Sector). The drawing shows the integration of the PET detectors in the MR system structure. From the inside to the outside: radiofrequency body coil, PET detector, gradient coil assembly, primary magnet coil, and magnet shielding coil. (b) PET detector block assembly where 64 lutetium oxyorthosilicate (LSO) crystals form one detector block that are read out by MR-compatible avalanche photodiode (APD) detectors. (c, d) Demonstration of the MR compatibility of an LSO crystal with APD-based PET detector. The PET signal footprint in (c) was acquired without magnetic field, while the signal footprint in (d) was acquired at 7.0 Tesla magnetic field strength. No magnetic field-related signal distortions can be seen in (d) (c, d from Lecomte et al. [11])
1.3 Attenuation Correction
1.3.1 Attenuation Correction in PET/CT
A technical challenge in PET/MR hybrid imaging is the attenuation correction of PET emission images based on MR information, necessary for an accurate quantitative measurement of the tracer activity concentration. In PET/CT hybrid imaging, the CT image providing spatial representation of Hounsfield units (HU) of the patient tissues and hardware components, such as patient table, can be used to calculate attenuation maps (μ-maps) by applying an appropriate energy scaling (Fig. 1.3). This is achieved by using the inherent 3D CT data of the patient tissues and patient table. The CT data (in HU) is then directly converted from its energy level (e.g., 80–140 keV) by bilinear conversion models to linear attenuation coefficients (LAC) of PET at 511 keV energy level (Fig. 1.3) [14].
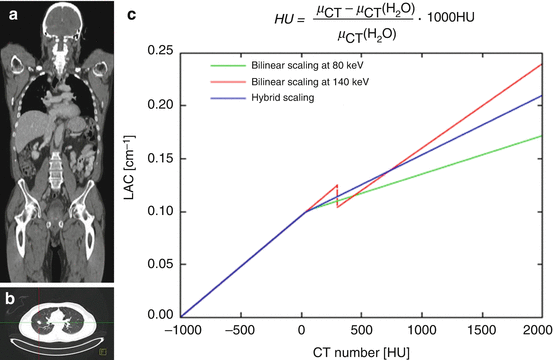

Fig. 1.3
Attenuation correction of PET data in PET/CT hybrid imaging. In PET/CT, attenuation correction is achieved by synergistically using the inherent three-dimensional CT data of the patient tissues (a) and patient table (b). The CT data (Hounsfield Units, HU) is then directly converted from its energy level (e.g., 80–140 keV) by bilinear conversion models (From Carney et al. [14]) to linear attenuation coefficients (LAC) of PET at 511 keV energy level (c)
1.3.2 Attenuation Correction in PET/MRI
PET data needs to be attenuation corrected in the reconstruction process in order to provide a valid quantification of tracer activity distribution in the human body. Scanner hardware components (e.g., tabletop, RF coils) as well as patient tissues within the FOV of the PET detector during data acquisition attenuate the number of true annihilation events and consequently may lead to false results without providing AC. Depending on the position of the heart in the thorax, photons emitted from the myocardium may experience different attenuations on their way through different body tissues to the PET detector. Non-AC PET data generally shows underestimation of the real tracer activity deep in the patient’s body and also in the heart. Since the PET/MRI system cannot measure linear attenuation directly as in PET/CT hybrid imaging, AC here needs to be performed differently (Fig. 1.4).


Fig. 1.4
Attenuation correction PET/MR hybrid imaging. Photograph (a) shows a head/neck radiofrequency coil that was optimized for PET transparency for use in an integrated PET/MR hybrid system. Image (b) shows a transversal view through the CT-based hardware attenuation map of a PET/MR system’s patient table with a radiofrequency head coil in place. In image (c) the MR-based attenuation correction map of the patient tissues (head) has been added. Thus (c) shows the completed attenuation map that represents the geometric distribution of attenuating hardware and soft tissue structures in the PET field of view
1.3.2.1 Attenuation Correction of Patient Tissues
Attenuation correction of human soft tissue is necessary to correct for the individual patient anatomy. Since no linear attenuation coefficient-based CT information is available in integrated PET/MRI, tissue-specific AC has to be based on MR information which is based on proton density and relaxation properties (e.g., T1 and T2 relaxation times), rather than on the attenuation of X-rays in tissue. Both air and solid bones lack signal in MRI; thus these fundamentally different tissue classes are difficult to separate. In the current implementation of integrated PET/MRI systems, tissue attenuation and scatter correction is performed using a three-dimensional (3D) Dixon-based MR imaging technique, providing two sets of images where water and fat are “in phase” and “out of phase” (Fig. 1.5) [8]. This allows reconstruction of fat-only, water-only, and fat-water images and results in tissue segmentation of air, fat, muscle, and lungs in the reconstructed and displayed μ-maps (Fig. 1.5) [8]. The cortical bone is currently not being accounted for in the Dixon-based AC approach. The bone is here classified as soft tissue, and thus the exact magnitude of PET signal attenuation of the bone might be underestimated [9].
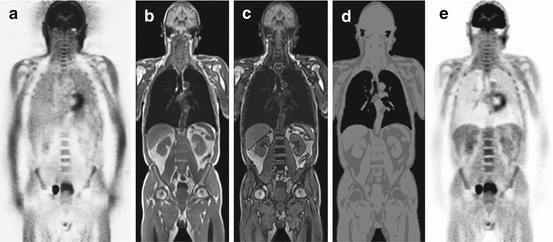

Fig. 1.5
Patient-tissue attenuation correction based on MR imaging. (a) Uncorrected whole-body PET scan showing relative activity enhancement in the lungs and along the outer contours of the patient. (b, c) Dixon-based MR sequence providing separate water/fat “in-phase” and “opposed-phase” images that serve as basis for soft tissue segmentation. (d) Segmented soft tissue groups (air, fat, muscle, lungs) that can be assigned to a PET attenuation map of the patient tissues. (e) Resulting attenuation-corrected PET scan of the initial data set (a). Note: Bone signal is assigned as soft tissue values in this MR-based approach for AC
1.3.2.2 Attenuation Correction of System Hardware Components
Radiofrequency surface receiver coils are a technical precondition for high-resolution MR imaging and are well established in clinical MRI. In a standard setup of integrated PET/MR cardiac imaging, the patient is placed on top of a rigid phased-array spine RF coil. For anterior signal detection, a second multichannel phased-array RF surface coil is placed on the thorax of the patient during simultaneous MR and PET data acquisition (Fig. 1.6). Thus, all RF surface coils used in the PET field of view during simultaneous PET data acquisition have to be optimized for PET transparency, i.e., such coils should attenuate the photons only minimally [15–18].
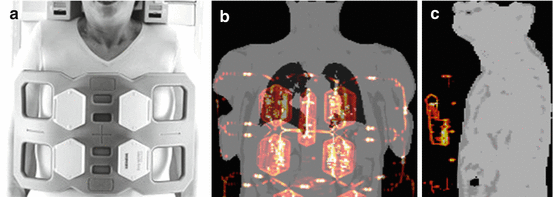

Fig. 1.6
(a) Six-channel thorax radiofrequency coil for MR signal reception during simultaneous cardiac PET/MR data acquisition. Images (b, c) show MR-based attenuation maps of the patient tissues that were acquired with a 3D Dixon-based sequence. The hardware attenuation correction map of the flexible RF coil (orange/red color) here was co-registered with nonrigid registration on the patient tissue attenuation correction map. Such attenuation maps represent the geometric distribution of PET signal-attenuating hardware and soft tissue structures in the PET field of view
The PET signal attenuation of rigid and stationary equipment such as the RF spine array and the RF head/neck coil can be compensated for by straightforward AC methods. After scanning this equipment by using CT, a 3D map of attenuation values can be generated. This data can then be converted into a 3D representation of the 511 keV attenuation values, the so-called μ-map. By linking the RF spine or RF head coil’s position to the patient’s table position, the corresponding AC μ-map for each table position is automatically selected by the system for PET image reconstruction [17].
For flexible surface RF coils like the 6-channel RF body phased array (Fig. 1.6) which may be used in the context of cardiac PET/MR, the AC is performed differently. Because the design of such surface RF coils is flexible, the individual position and shape of this RF coil during a patient examination is not known. Thus a pre-acquired rigid 3D CT template cannot directly be co-registered [17]. As alternative strategy for AC of flexible RF coils, visible markers have been proposed to perform an automatic nonrigid co-registration of the pre-acquired 3D CT attenuation template to the individual position and shape of the flexible RF coil during the cardiac PET/MR examination (Fig. 1.6) [17, 19].
Stay updated, free articles. Join our Telegram channel

Full access? Get Clinical Tree


