, a constant spacing distance. The total length of the entire array will be taken as 2B. In this case, the centroid of the first element is located at an x-distance of  and the distance between centroids is
  so the x-location of the centroid of the mth element is
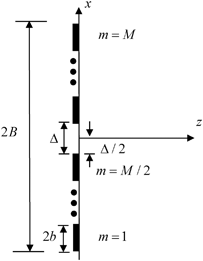
Fig. 4.1
An array of M transducer elements, each of length 2b and separated by a distance,  where M is an even number and the z-axis is located at the center of the array. The total length of the entire array is 2B
 where M is an even number and the z-axis is located at the center of the array. The total length of the entire array is 2B
(4.1)
But the distance B is given by

(4.2)
where the first term on the right of Eq. (4.2) represents the contribution to B from half of the total elements (M/2). The second terms represents the contribution to B from the number of full gaps present,  , and the last term represents the half gap length from the z-axis to the m = M/2 element (see Fig. 4.1). Combining Eqs. (4.1) and (4.2) then gives the x-location of the centroid of the mth element in the array as
 , and the last term represents the half gap length from the z-axis to the m = M/2 element (see Fig. 4.1). Combining Eqs. (4.1) and (4.2) then gives the x-location of the centroid of the mth element in the array as
(4.3)
If, instead, there are an odd number of elements in the array then with the z-axis again located at the center of the array (see Fig. 4.2), the centroid of the first element is again located at an x-distance of  and the distance between centroids is still
  so Eq. (4.1) holds. In this case
 and the distance between centroids is still
  so Eq. (4.1) holds. In this case
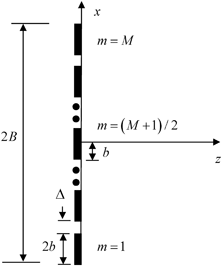
Fig. 4.2
An array of M transducer elements, each of length 2b and separated by a distance,  where M is an odd number and the z-axis is located at the center of the array. The total length of the entire array is 2B
 where M is an odd number and the z-axis is located at the center of the array. The total length of the entire array is 2B
(4.4)
since there are  elements and gaps on each side of the center element and an additional distance b on each side from the center element (Fig. 4.2). Comparing Eqs. (4.2) and (4.4) we see they are identical. This is to be expected since for either an even or odd number of elements we have M elements and (M − 1) gaps so that the total length of the array is
 elements and gaps on each side of the center element and an additional distance b on each side from the center element (Fig. 4.2). Comparing Eqs. (4.2) and (4.4) we see they are identical. This is to be expected since for either an even or odd number of elements we have M elements and (M − 1) gaps so that the total length of the array is
(4.5)
which also is identical with Eqs. (4.2) and (4.4). Thus it follows that the centroid location expression of Eq. (4.3) is valid for arrays with either an odd or even number of elements. The distance  which appears in Eq. (4.3) is called the pitch of the array. This particular distance, as we will see, plays an important role in describing the properties of the wave field of the array. In terms of the pitch, s, the centroid locations then are given simply by
 which appears in Eq. (4.3) is called the pitch of the array. This particular distance, as we will see, plays an important role in describing the properties of the wave field of the array. In terms of the pitch, s, the centroid locations then are given simply by
(4.6)
With Eq. (4.2) and the beam models developed in Chap. 2 for a single element piston transducer it now is possible to develop models for a 2-D transducer array. Each element in the array is typically driven by a separate circuit so that the driving voltages and the corresponding velocities on the faces of the elements can be different, i.e.  for the mth element. Here, we will let
  so that the only differences between elements in the driving velocities will be apodization values,
  , which are discrete values of the continuous apodization windows discussed in Chap. 3. Also, we will assume a different time delay,
  , at each element that will produce an additional complex exponential term
  for the mth element in the array model. We can sample the continuous time delays of Chap. 3 to generate discrete delay laws for beam steering and focusing of arrays or use the more general time delay laws developed in the next chapter.
 for the mth element. Here, we will let
  so that the only differences between elements in the driving velocities will be apodization values,
  , which are discrete values of the continuous apodization windows discussed in Chap. 3. Also, we will assume a different time delay,
  , at each element that will produce an additional complex exponential term
  for the mth element in the array model. We can sample the continuous time delays of Chap. 3 to generate discrete delay laws for beam steering and focusing of arrays or use the more general time delay laws developed in the next chapter.
Consider using our multiple line source model (Eq. 2.59) to represent each element of an array. Then for the wave field of the entire array we have (see Fig. 4.3)
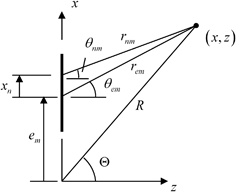
Fig. 4.3
Geometry parameters for the mth element of an array for use in multiple and single line source array beam models and for considering the far field response of the array. The distance  is measured from the origin (taken as the center of the array) to the centroid of the mth element while
  is the distance measured from this element centroid to the center of the nth segment of this element
 is measured from the origin (taken as the center of the array) to the centroid of the mth element while
  is the distance measured from this element centroid to the center of the nth segment of this element
![$$ \frac{p(\mathbf{x},\omega )}{\rho c{{v}_{0}}(\omega )}=\sum\limits_{m=1}^{M}{{{{\tilde{C}}}_{m}}\exp (i\omega \Delta {{t}_{m}})\left[ \frac{kb}{N}\sqrt{\frac{2}{\text{ }\!\!\pi\!\!\text{ }i}}\sum\limits_{n=1}^{N}{{{D}_{b/N}}({{\theta }_{nm}})\frac{\exp (ikb{{{\bar{r}}}_{nm}})}{\sqrt{kb{{{\bar{r}}}_{nm}}}}} \right]}, $$](/wp-content/uploads/2016/05/A314073_1_En_4_Chapter_Equ7.gif)
(4.7)
where there are M elements and the acoustic field of each element is calculated with N segments over the element. The normalized distances,  , are given by
 , are given by
![$$ {{\bar{r}}_{nm}}=\sqrt{{{[ ( x-{{x}_{n}}-{{e}_{m}} )/b ]}^{2}}+{{(z/b)}^{2}}} $$](/wp-content/uploads/2016/05/A314073_1_En_4_Chapter_Equ8.gif)
(4.8)
and the angles  are measured from the centroid of each segment of a given element (Fig. 4.3), i.e.
 are measured from the centroid of each segment of a given element (Fig. 4.3), i.e.
![$$ \sin [ {{\theta }_{nm}} ]=\frac{x-{{x}_{n}}-{{e}_{m}}}{b{{{\bar{r}}}_{nm}}}. $$](/wp-content/uploads/2016/05/A314073_1_En_4_Chapter_Equ9.gif)
(4.9)
The model of Eq. (4.7) we will call the multiple line source array beam model. In many cases we are interested in calculating the wave field of the array only at distances which are in the far field region of each element . In that case we can set N = 1 in Eq. (4.7) and take  to obtain
 to obtain
![$$ \frac{p(\mathbf{x},\omega )}{\rho c{{v}_{0}}(\omega )}=\sum\limits_{m=1}^{M}{{{{\tilde{C}}}_{m}}\exp (i\omega \Delta {{t}_{m}})\left[ kb\sqrt{\frac{2}{\text{ }\!\!\pi\!\!\text{ }i}}{{D}_{b}}({{\theta }_{em}})\frac{\exp (ikb{{{\bar{r}}}_{em}})}{\sqrt{kb{{{\bar{r}}}_{em}}}} \right],} $$](/wp-content/uploads/2016/05/A314073_1_En_4_Chapter_Equ10.gif)
(4.10)
where now the radii and angles are

(4.11)
as measured from the centroid of each element (see Fig. 4.3).We will call the model of Eq. (4.10) the single line source array beam model . This model will be used in the next section as the basis for discussing the existence of grating lobes in the radiated wave field of an array.
4.1.1 Far Field Behavior of an Array
If the point (x, z) in the fluid is in the far-field of the entire array, then a single line source is adequate to represent every element of the array and in the single line source array beam model we can set (see Fig. 4.3)

(4.12)
and

(4.13)
so Eq. (4.10) becomes, approximately,
![$$ p(\mathbf{x},\omega )=\sum\limits_{m=1}^{M}{{{{\tilde{C}}}_{m}}\exp (i\omega \Delta {{t}_{m}})\left[ \rho c{{v}_{0}}\sqrt{\frac{2}{\text{ }\!\!\pi\!\!\text{ }i}}kb\ {{D}_{b}}(\Theta )\frac{\exp (ikR)}{\sqrt{kR}}\exp (-ik{{e}_{m}}\sin \Theta ) \right]}. $$](/wp-content/uploads/2016/05/A314073_1_En_4_Chapter_Equ14.gif)
(4.14)
Now consider the case where there is no apodization or delay law imposed, i.e.  Then we find
 Then we find
![$$ p(\mathbf{x},\omega )=\rho c{{v}_{0}}\sqrt{\frac{2}{\text{ }\!\!\pi\!\!\text{ }i}}kb\ {{D}_{b}}(\Theta )\sum\limits_{m=1}^{M}{[ \exp ({-}ik{{e}_{m}}\sin \Theta) ]}\frac{\exp (ikR)}{\sqrt{kR}}. $$](/wp-content/uploads/2016/05/A314073_1_En_4_Chapter_Equ15.gif)
(4.15)
![$$ \begin{aligned} p(\mathbf{x},\omega )&=\rho
c{{v}_{0}}\sqrt{\frac{2}{\text{ }\!\!\pi\!\!\text{ }i}}kb\
{{D}_{b}}(\Theta )\exp \left[ iks\left( \frac{M+1}{2} \right)\sin
\Theta\right]\\ & \cdot \sum\limits_{m=1}^{M}{[\exp (-iks\sin
\Theta m)]}\frac{\exp (ikR)}{\sqrt{kR}}. \end{aligned} $$](/wp-content/uploads/2016/05/A314073_1_En_4_Chapter_Equ16.gif)
(4.16)
In this case we can perform the sum since

(4.17)
Letting  we find
 we find
![$$ \begin{aligned}\\& \sum\limits_{m=1}^{M}{[ \exp ({-}iks\sin \Theta m ) ]} \\& =\exp (-iks\sin \Theta )\frac{[ 1-\exp (-iks\sin \Theta M) ]}{[ 1-\exp (-iks\sin \Theta ) ]} \\& =\exp \left[{-}iks\left( \frac{M+1}{2} \right)\sin \Theta\right]\frac{\sin [(Mks\sin \Theta )/2]}{\sin [(ks\sin \Theta )/2]}. \\ \end{aligned} $$](/wp-content/uploads/2016/05/A314073_1_En_4_Chapter_Equ18.gif)
(4.18)
and Eq. (4.16) becomes
![$$ p(\mathbf{x},\omega )=\rho c{{v}_{0}}\sqrt{\frac{2}{\text{ }\!\!\pi\!\!\text{ }i}}(kbM){{D}_{b}}(\Theta )\frac{\sin [(Mks\sin \Theta )/2]}{M\sin [(ks\sin \Theta )/2]}\frac{\exp (ikR)}{\sqrt{kR}}. $$](/wp-content/uploads/2016/05/A314073_1_En_4_Chapter_Equ19.gif)
(4.19)
Equation (4.19) shows that in the far-field of the array the wave field acts like a cylindrically spreading wave with a total angular directivity,  where
where
 where
where![$$ \begin{aligned} {{D}_{b}}(\Theta )& =\frac{\sin (kb\sin \Theta )}{kb\sin \Theta }, \\ {{D}_{s}}( \Theta)& =\frac{\sin [(Mks\sin \Theta )/2]}{M\sin [(ks\sin \Theta )/2]}. \\ \end{aligned} $$](/wp-content/uploads/2016/05/A314073_1_En_4_Chapter_Equ20.gif)
(4.20)
While the directivity function  represents the directivity of an individual element the directivity
  can be considered to be due to a discrete array of “point” sources, each separated by the distance, s. One can see this since if b is very small, each element reduces to a “point” and in this limit
  so the total directivity of these very small “point” elements is just
  For arrays where the element size and pitch are fractions of a wavelength the directivity function of the element,
  is slowly varying in angle while the directivity of the discrete sources,
  behaves similar to the directivity of a single element transducer having the size of the entire array (2B). This can be seen in Fig. 4.4 which plots these directivities as a function of the angle,
  for the 5 MHz, 32 element array with an element length which is one half a wavelength. Figure 4.4 also shows the directivity of a single element transducer having the same overall size as the entire array, i.e.
 represents the directivity of an individual element the directivity
  can be considered to be due to a discrete array of “point” sources, each separated by the distance, s. One can see this since if b is very small, each element reduces to a “point” and in this limit
  so the total directivity of these very small “point” elements is just
  For arrays where the element size and pitch are fractions of a wavelength the directivity function of the element,
  is slowly varying in angle while the directivity of the discrete sources,
  behaves similar to the directivity of a single element transducer having the size of the entire array (2B). This can be seen in Fig. 4.4 which plots these directivities as a function of the angle,
  for the 5 MHz, 32 element array with an element length which is one half a wavelength. Figure 4.4 also shows the directivity of a single element transducer having the same overall size as the entire array, i.e.
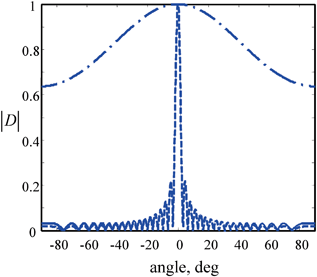
Fig. 4.4
The magnitude of the directivity for a single element of a 5 MHz, 32 element array radiating into water versus angle (dashed-dotted line). The magnitude of the directivity of the discrete sources of the array (solid line) compared to the directivity of a single element transducer of the same overall size as the array (dashed line). M = 32, 
 , f = 5 MHz

 , f = 5 MHz
(4.21)
where it can be seen that there is little difference between  and
and  From Fig. 4.4 it would appear that the overall far-field behavior of the array, which is determined by the product of these directivity functions, will be very similar to that of a single element transducer of the same size. However, this is only true because in the example considered the pitch was only about one half a wavelength. If the element size was two wavelengths instead but all other parameters were left unchanged, the corresponding directivity plots of
  and
and  would be as shown in Fig. 4.5. In this case the directivity of an element is more concentrated about
  since the element is larger and itself produces a more highly collimated beam, but the striking difference is in the directivity of discrete array sources, which now looks again like the overall directivity of a single element transducer of the same size as the entire array but where this directivity is periodically repeated as a function of angle. Since the total directivity function of the array is the product of these two directivities, additional “lobes” in the directivity function
  will appear in the far-field wave field as shown in Fig. 4.6. These lobes are called array grating lobes. Similar lobes appeared in Chap. 2 when modeling large, single element transducers if the element segments were too large. Since the elements themselves in an array act as similar segments of the entire array it is not surprising that array grating lobes appear also if the element size is too large. The conditions for the existence of grating lobes can be found by noting that the directivity function
  is a function of the variable
  given by
 and
and  From Fig. 4.4 it would appear that the overall far-field behavior of the array, which is determined by the product of these directivity functions, will be very similar to that of a single element transducer of the same size. However, this is only true because in the example considered the pitch was only about one half a wavelength. If the element size was two wavelengths instead but all other parameters were left unchanged, the corresponding directivity plots of
  and
and  would be as shown in Fig. 4.5. In this case the directivity of an element is more concentrated about
  since the element is larger and itself produces a more highly collimated beam, but the striking difference is in the directivity of discrete array sources, which now looks again like the overall directivity of a single element transducer of the same size as the entire array but where this directivity is periodically repeated as a function of angle. Since the total directivity function of the array is the product of these two directivities, additional “lobes” in the directivity function
  will appear in the far-field wave field as shown in Fig. 4.6. These lobes are called array grating lobes. Similar lobes appeared in Chap. 2 when modeling large, single element transducers if the element segments were too large. Since the elements themselves in an array act as similar segments of the entire array it is not surprising that array grating lobes appear also if the element size is too large. The conditions for the existence of grating lobes can be found by noting that the directivity function
  is a function of the variable
  given by
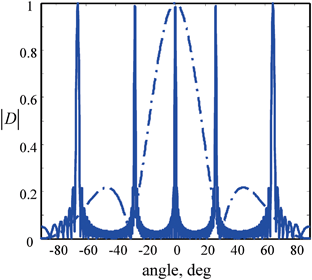
Fig. 4.5
The magnitude of the directivity versus angle of a single element of a 5 MHz, 32 element array radiating into water (dashed-dotted line) and the magnitude of the directivity versus angle of the discrete sources of the array (solid line). M = 32,  ,
,  , f = 5 MHz
 ,
,  , f = 5 MHz
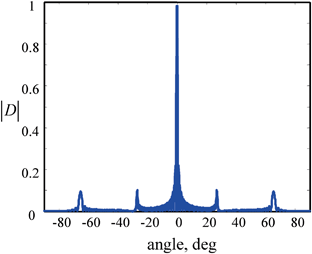
Fig. 4.6
The magnitude of the total directivity versus angle of an array radiating into water versus angle of a 5 MHz, 32 element array radiating into water. M = 32,  ,
,  , f = 5 MHz
 ,
,  , f = 5 MHz
![$$ {{D}_{s}}(ks\sin \Theta )=\frac{1}{M}\exp \left[ iks\sin \Theta \left( \frac{M+1}{2} \right) \right]\sum\limits_{m=1}^{M}{\exp (-iks\sin \Theta m)}. $$](/wp-content/uploads/2016/05/A314073_1_En_4_Chapter_Equ22.gif)
(4.22)
Equation (4.22) shows that the magnitude of this directivity function is a periodic function since

(4.23)
Thus, the same maximum value of the directivity function which occurs at  where
where will also occur at angles
  where
where  (n = 1, 2, …) provided that we can find a real solution or solutions of
 where
where will also occur at angles
  where
where  (n = 1, 2, …) provided that we can find a real solution or solutions of
(4.24)
Equation (4.24) shows that as long as  there are no solutions except
  For
For ![$$s>\lambda $$
” src=”/wp-content/uploads/2016/05/A314073_1_En_4_Chapter_IEq52.gif”></SPAN>, other solutions (lobes of the response) can exist. A similar situation was found in Chap. <SPAN class=ExternalRef><A href=]() 2 when breaking an element up into segments. There it was found that the segment size had to be less than one wavelength to prevent extraneous lobes from appearing. Here, we need to keep the pitch of the array less than a wavelength instead. In the next section we will show that if we use a delay law to steer the beam of an array the conditions needed to prevent grating lobes will be even more restrictive (the pitch will have to be less than one half a wavelength). Manufacturing and economic constraints present when producing commercial NDE phased arrays may dictate that the array pitch be more than a wavelength, so that in practice one may have to deal with an array where grating lobes are inherently present and can affect the test results.
2 when breaking an element up into segments. There it was found that the segment size had to be less than one wavelength to prevent extraneous lobes from appearing. Here, we need to keep the pitch of the array less than a wavelength instead. In the next section we will show that if we use a delay law to steer the beam of an array the conditions needed to prevent grating lobes will be even more restrictive (the pitch will have to be less than one half a wavelength). Manufacturing and economic constraints present when producing commercial NDE phased arrays may dictate that the array pitch be more than a wavelength, so that in practice one may have to deal with an array where grating lobes are inherently present and can affect the test results.
 there are no solutions except
  For
For 4.2 Array Beam Steering
Since the individual elements of an array transducer are driven independently, it is possible to excite each element with a different time delay. These delays can be used to electronically steer and focus the ultrasound. In this section we will examine beam steering by examining the far-field behavior of an array, first using the single line source model of Eq. (4.10) with the amplitude coefficients,  , taken to be unity. If we use the continuous beam steering law of Eq. (3.17) and sample that function at the centroid locations of the array elements given by Eq. (4.6) we find the discrete delays,
  given by
 , taken to be unity. If we use the continuous beam steering law of Eq. (3.17) and sample that function at the centroid locations of the array elements given by Eq. (4.6) we find the discrete delays,
  given by
![$$ \Delta {{t}_{m}}=\frac{s\sin \Phi }{c}\left[ (m-1)-\frac{M-1}{2} \right]. $$](/wp-content/uploads/2016/05/A314073_1_En_4_Chapter_Equ25.gif)
(4.25)
If these delays are placed into the far field values of the single line source model Eq. (4.14


Stay updated, free articles. Join our Telegram channel

Full access? Get Clinical Tree


