Introduction
Cardiac auscultation is an important and basic component of a physical examination in clinical practice. For the experienced listener, auscultation provides quick and reliable diagnostic information about the state of the heart. Phonocardiography systems allow the listener to record these findings. Spectral phonocardiographic studies, introduced as early as 1955 by McKusick et al,1 accurately characterize the quality of heart sounds and cardiac murmurs by creating a graphic record. Recording heart sounds and phonocardiograms enables building heart sound libraries and teaching material.2-4 Dr. Proctor Harvey’s audio tapes are classics in adult cardiology.
The significant improvements in personal computers over the past few decades have made it possible to design new highly capable phono-spectrocardiographic devices with digital signal analysis. Published studies have demonstrated the clinical validity of this method of recording and analyzing cardiac sounds.5-9 Digital signal processing allows the combination of phonocardiography with other imaging modalities.
Basics of Phonocardiography
Heart sounds provide information about both normal and pathologic physical events in the heart. The movement of blood and the movement and vibration of the heart structures produce audible sounds and murmurs. The causes of vibratory movement in the cardiovascular system can be categorized into two general mechanisms: (1) rapid acceleration and deceleration of blood flow or (2) continuous turbulence in blood flow. The sudden sounds caused by acceleration and deceleration of blood flow are called heart sounds, and the sounds produced by turbulent blood flow are labeled murmurs.
Phonocardiography is a diagnostic technique that graphically records cardiac acoustic phenomena.10 Visualization of heart sounds may help in understanding cardiac events (Fig. 2–1). A visual record may also help an inexperienced listener recognize and classify auscultatory findings. The essential elements of the phonocardiographic system are a transducer (microphone), an amplifier, a filter, and recording, analyzing, and transcription systems. In the past, all of the parts, including those needed for recording and transcription, were analog.
Figure 2–1.
Heart sound events represented graphically. The red bars represent left-side events, and the black bars represent right-side events. The gray area is normally inaudible. The first heart sound (S1) contains two components: the mitral valve closure sound (M1) and the tricuspid valve closure sound (T1). The second heart sound (S2) contains two components: the aortic valve closure sound (A2) followed by the pulmonary valve closure sound (P2). The presystolic (atrial) gallop sound (S4) is normally inaudible. The prodiastolic (ventricular) gallop (S3) may be audible and is normal in children. Innocent systolic murmur (SM) is a common normal finding, especially in children. Ejection sounds (E) are normally inaudible. Opening snaps (O), if audible, indicate some level of pathology. Adapted from Leatham.10
Today, recording and analysis are done digitally using personal computers and specialized software or by using custom electronic devices specially designed for this purpose. In addition, sophisticated analysis software, feature extraction, and classification algorithms (such as neural networks) may be used for further interpretation of sounds.11,12
A visual presentation provides an opportunity to study the timing, frequency, and intensity of different heart sound and murmur components. Spectral phonocardiography combined with traditional phonocardiographic tracing simultaneously depicts all of these features. Digital signal processing allows accurate fine-tuning of the visual representation in terms of various frequencies, intensities, and timing.
Heart Sound Analysis
Over 90% of heart murmurs in children are physiologic and benign. Moreover, 75% of these murmurs are innocent vibratory murmurs.13 Visual analysis of the phono-spectrocardiographic record enables differentiation between pathologic and physiologic pediatric murmurs. Simple quantitative criteria applied to the phono-spectrocardiographic record may significantly improve the diagnostic accuracy of any screener to the level of a subspecialist.9 Advanced signal processing and pattern recognition tools have yielded even better diagnostic accuracy.14 Artificial neural network–based screening has been reported to have higher sensitivity and specificity than other signal processing methods.8,12
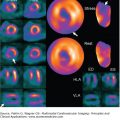
Phono-spectrocardiographic signal analysis is a promising clinical application in the assessment of the severity of aortic or carotid arterial stenosis.2,5,6 Furthermore, as in children, it can be used to differentiate between pathologic and innocent murmurs. Traditional phonocardiography combined with spectral digital analysis, also known as acoustic cardiography, has been used to recognize and quantify heart sounds S3 and S4.15-18 Changes in the recorded magnitude of S3 and/or S4 can perhaps be used to determine whether the patient’s hemodynamic status is improving or worsening (Fig. 2–2).
Figure 2–2.
Acoustic cardiography report and time-frequency analysis of heart sounds from a subject with a systolic murmur. The upper panel (A) shows a two-dimensional acoustic cardiography report for a subject with a systolic murmur (M) and the panels below (B) illustrate the three-dimensional scalogram views of a two beats from the acoustic cardiography rhythm strip shown above. Because murmurs have higher frequency components than diastolic heart sounds, they do not have to be high in intensity to be detected by the human ear. Thus, in this case, it is easier for the human ear to detect the murmur than the low-frequency third and fourth heart sound. Adapted from Erne.18
The following examples of heart sound analysis are from pediatric patients, and they demonstrate the validity of modern phono-spectrocardiographic imaging techniques. The software used includes corresponding audio recordings and marker measures (Fig. 2–3).
In these phono-spectrograms (Figs. 2–4, 2–5, 2–6, 2–7, 2–8, 2–9, 2–10, 2–11), timing is read from the time scale (at the bottom of the figures) by visually examining both the phonocardiogram and the spectrogram and then deciding the duration of a sound event or murmur and dragging the marker over the selected time segment. The intensities of S1, S2
Related posts:


Stay updated, free articles. Join our Telegram channel

Full access? Get Clinical Tree


