Many readers will skip this chapter. Don’t be one of them. Most of us learned physics in order to pass boards, but we never really made the leap to understanding how physics knowledge really can improve our images.
Optimizing Mammography
Because the breast is a soft tissue organ, there is little internal contrast. High contrast is necessary to distinguish cancers from the surrounding breast tissue. Most of the improvements with mammography over the last 30 years have been related to contrast. These include the use of single emulsion film, extended processing, and the use of molybdenum targets and grids. More recently, digital mammography has improved contrast compared with film-screen mammography. This section will focus on digital mammography because the majority of facilities use this equipment.
Contrast
The lower the kilovolt peak (kVp), the higher the contrast. Digital machines operate with an automatic exposure device (AED) that selects an appropriate target, filter, kVp, and milliampere second (mAs). This works very well … most of the time.
Molybdenum anode targets were used almost exclusively in film-screen mammography because of the resulting lower energy spectrum due to molybdenum’s characteristic radiation at approximately 18 and 20 keV. Occasionally the rhodium target would be used for women with dense breasts to have a slightly higher energy spectrum (characteristic radiation at about 20 and 23 keV) in order to adequately penetrate the breast tissue.
In digital mammography, the image contrast can be adjusted via the window and level settings of the display, so the target material and goal of obtaining the lowest possible beam energy are less important. Most digital exposures use either a tungsten or a rhodium target, and occasionally fall back to a molybdenum target. One advantage of using a higher energy x-ray spectrum is better breast penetration, so x-rays are more likely to pass through the breast and contribute to forming the image and the exposure is faster, reducing the chance of motion artifacts. Another advantage is lower radiation dose because fewer x-rays are absorbed in the breast. Digital mammography is about 30% lower in radiation dose than film-screen mammography.
Mammography filters are also made from molybdenum or rhodium and are used to remove x-rays that are lower or higher in energy than the desired spectrum. On digital mammography machines, the filter selection is also automated.
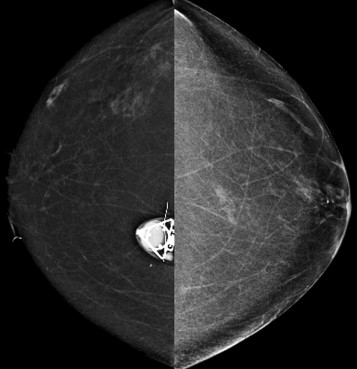
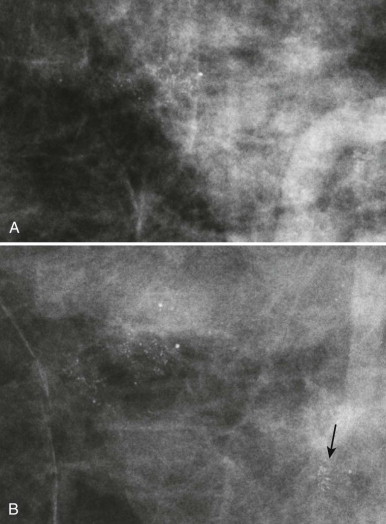
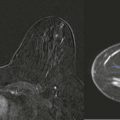
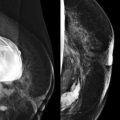
So if all of this is automated, why know any of this? There are times when the AED will not provide an appropriate technique. The most common situations where this occurs are when a patient has breast implants or hardware ( Fig. 2-1 ). A high-density implant or hardware that overlies the AED will cause an exposure setting that is too high for the breast parenchyma, resulting in overexposure of the tissue and low contrast. A manual technique is required for women with implants and may also optimize contrast in women with hardware.
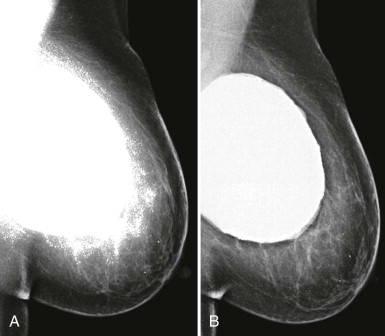
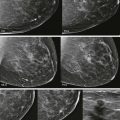
With film-screen mammography, poor technique is usually obvious because the film is too light or dark, or low in contrast. However, poor technique can be hard to recognize with digital mammography. The image will appear uncharacteristically noisy ( Fig. 2-2 ). Windowing of the image may result in some improvement, though repeating the exposure is often preferred ( Box 2-1 ).
- •
Implants
- •
Very thin breasts
- •
Specimen radiographs
- •
Overlying hardware
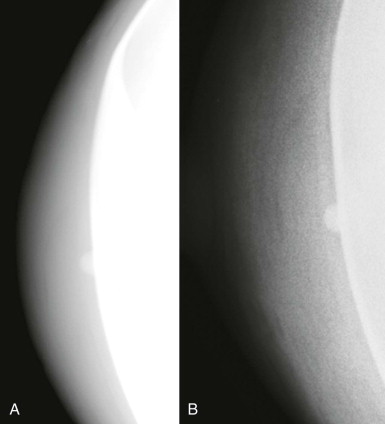
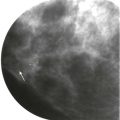
For some women, their breasts become very thin (less than 2 cm) when compressed—“pancake breasts.” The internal contrast is extremely low because these women tend to have very little body fat ( Fig. 2-3 ). The breast may appear to be very dense, when there is actually very little breast tissue present. A manual technique using the molybdenum target/filter at the lowest kVp possible can improve the image contrast.
Specimen radiographs, whether core or surgical, likewise, are usually quite thin, and a manual technique using a molybdenum target/filter combination and the lowest possible kVp will result in the best image contrast.
Reducing Scatter
The reduction of scattered x-ray photons is a key part of optimizing contrast. There are several ways to reduce scatter:
- •
Beam collimation
- •
Breast compression
- •
Grid
- •
Air-gap
Beam collimation (“coning”) is helpful for reducing scatter when obtaining magnification views to assess calcifications. For this purpose, a wider field of view is not needed because visualization of the calcifications on the magnified images confirms that the correct area was included. However, when using spot compression views to evaluate masses or focal asymmetries, the image is not collimated. In this case, visualization of the surrounding landmarks helps assure that the area of interest is included on the image.
Compression reduces the thickness of the breast, thereby reducing the exposure and scattered radiation. Using spot compression during magnification views focally compresses the tissue even more than the compression used during routine mammographic views. This further reduces scatter, and improves image contrast.
Grids improve image contrast on mammography by reducing scatter. However, magnification views are not obtained using a grid because the exposure time, which is already increased due to the lower output of the small focal spot used for magnification views, would be too long.
Even without a grid, most scatter in magnification views is eliminated using the air-gap technique. Because of the large gap between the breast and the receptor, most scattered photons diverge from the primary beam and will not strike the image receptor.
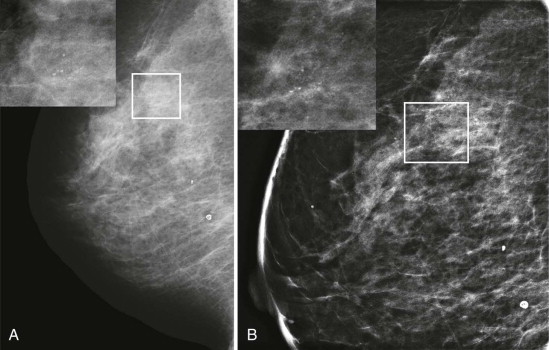
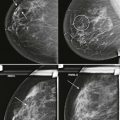
So how can you use this information in your practice? By performing spot compression magnification views with collimation and taking advantage of the air-gap technique, you can obtain incredible detail on your magnification views ( Box 2-2 ; Figs. 2-4 and 2-5 ).
- •
Use spot compression and coning for calcifications (see Fig. 2-4 ). Spot compression reduces the breast thickness and thus exposure time. Coning of the image reduces scattered radiation.
- •
Obtain true geometric magnification views, which are better than zoomed views of digital mammograms (see Fig. 2-5 ).
- •
Get magnification views in the craniocaudal and mediolateral (not mediolateral oblique) projections as your routine practice so as not to miss milk of calcium.
Resolution
Digital mammography units vary in detector element size from 40 to 100 µm, corresponding to limiting spatial frequency of 12.5 to 5.0 line pairs (lp) per millimeter, respectively. Note that the actual spatial resolution in digital mammography is determined by the focal spot size and blurring elements in the detector, primarily in the scintillator or phosphor screen in indirect conversion detectors. Thus the detector element size only sets an upper limit on resolution that may or may not actually be obtained. Digital mammography is not actually higher in resolution than film-screen mammography, which has a resolution of about 14 lp per mm. However, because of the much higher noise introduced by the film and film processing, the signal-to-noise ratio of film-screen mammography in practice is lower. The primary improvements gained through digital mammography are elimination of film granularity noise and a large increase in the dynamic range of x-ray intensities that can be measured. The minor differences in resolution between digital units have not been shown to impact cancer detection.
Optimizing Ultrasonography
Whether the radiologist, trainee, or technologist performs the ultrasonography (US) examination, careful attention to technical parameters can optimize the study ( Box 2-3 ).
- •
Depth —include only breast and pectoral muscle in the field of view
- •
Focal Zones —adjust to breast tissue for survey scanning or specifically to a lesion once identified
- •
Gain —adjust to be uniform in the image; a straight time-gain curve works well in breast ultrasonography.
Resolution
Higher frequency transducers are higher in resolution but have lower tissue penetration. Because the breast is a superficial organ, a very high frequency transducer can be used. The most common transducer used for breast imaging is a 7 to 15 MHz gradient linear array transducer, though a higher frequency (10-17 MHz) transducer yields beautiful images in smaller breasts.
Adjust the Depth
Fill your screen with the area of interest! The field of view should include only the breast tissue and the anterior pectoral muscle ( Fig. 2-6 ). The ribs and lung should not be seen on breast US unless the breast is thin. With a large breast, the default depth may actually need to be increased to include the posterior tissues. Otherwise, a deep lesion could be missed. The depth may also need to be increased to demonstrate the posterior acoustic enhancement of a cyst or shadowing of a mass.

Focal Zone Positioning
When surveying the breast, the focal zone should include the area of the breast tissue from just under the skin to the pectoral muscle ( Fig. 2-7 ).

Once a lesion is identified, improvement in image quality can be gained by narrowing the focal zone to the area of the lesion (see Fig. 2-7 ). Classic teaching is that the focal zone should be positioned deep to a lesion. However, that only holds true when using a single focal zone. Most US machines now use multiple focal zones to create a focal area. The focal zone should be centered at the lesion rather than behind it.
Setting the Gain
Setting the overall gain and the time-gain curve (TGC) to the optimal levels is essential for accurately characterizing cystic or solid masses. The overall gain should be set so that fat lobules are midlevel gray and the TGC adjusted so that the fat lobules at all depths of the breast have the same echogenicity ( Fig. 2-8 ). The TGC should be relatively straight in breast imaging.

Adenosis, lymph nodes involved by tumor, or lymphomatous masses may appear markedly hypoechoic and can be mistaken for cysts. When questioning a cyst within the axilla, keep in mind that cysts in this location are very uncommon, and a pathologic lymph node should be suspected. Color Doppler usually demonstrates the solid nature of the mass in these cases ( Fig. 2-9 ).

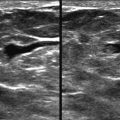
Tissue Harmonic Imaging
Harmonic imaging is a feature that improves contrast resolution and is widely available on current US equipment. An ultrasound beam transmitted at one center frequency creates higher harmonic frequencies as it passes through tissue. In tissue harmonic imaging (THI), the returning harmonic frequencies are used to form the image, and the lower frequency component of the beam is removed by a processing technique. This step removes artifact that is present in the lower frequency beam component, resulting in improved contrast.
By reducing reverberation and speckle artifacts, THI is useful for characterizing cysts and distinguishing them from solid lesions. The reduction in reverberation artifact can also be helpful in the evaluation of implants. Solid masses generally appear more hypoechoic with THI, which can make them more conspicuous.
THI is particularly useful in identifying and guiding biopsy of lesions that, on conventional imaging, are nearly isoechoic with the surrounding tissue ( Fig. 2-10 ). It can also make subtle abnormalities of tissue echotexture, such as lesions appearing mammographically as architectural distortion, much more conspicuous ( Fig. 2-11 ).


Related posts:
Stay updated, free articles. Join our Telegram channel

Full access? Get Clinical Tree


