Fig. 1.
Porosomes, previously referred to as “depressions” at the plasma membrane in pancreatic acinar cells and at the nerve terminal. (a) AFM micrograph depicting “pits” and “porosomes” within at the apical plasma membrane in a live pancreatic acinar cell. (b) To the right is a schematic drawing depicting porosomes at the cell plasma membrane (PM), where membrane-bound secretory vesicles called zymogen granules (ZG) dock and fuse to release intravesicular contents. (c) A high-resolution AFM micrograph showing a single pit with four 100–180 nm porosomes within. (d) An electron micrograph depicting a porosome (red arrowhead) close to microvilli (MV) at the apical plasma membrane (PM) of a pancreatic acinar cell. Note the association of the porosome membrane ( yellow arrowhead ) and the zymogen granule membrane (ZGM) (red arrowhead) of a docked ZG (inset ). Cross section of a circular complex at the mouth of the porosome is seen. (e) The bottom left panel shows an electron micrograph of a porosome at the nerve terminal, in association with a synaptic vesicle (SV) at the presynaptic membrane (Pre-SM). Notice a central plug at the neuronal porosome opening. (f) The bottom right panel is an AFM micrograph of a neuronal porosome in physiological buffer, also showing the central plug at its opening. It is believed that the central plug in neuronal porosomes may regulate its rapid close-open conformation during neurotransmitter release. The neuronal porosome is an order of magnitude smaller (10–15 nm) in comparison to porosomes in the exocrine pancreas (figure represents a collage of images from our earlier publications (6, 10, 14)).
Fig. 2.
Structure and organization of the neuronal porosome complex at the nerve terminal. (a) Low resolution AFM amplitude image (Bar = 1 μm) (a) and high-resolution AFM amplitude image (Bar = 100 nm) (b) of isolated rat brain synaptosomes in buffered solution. (c) Electron micrograph of a synaptosome (Bar = 100 nm). (d) Structure and arrangement of the neuronal porosome complex facing the outside (top left), and the arrangement of the reconstituted complex in PC:PS membrane (top right ). Lower panels depict two transmission electron micrographs demonstrating synaptic vesicles (SV) docked at the base of a cup-shaped porosome, having a central plug (red arrowhead ). (e) EM, electron density, and 3D contour mapping demonstrates at the nanoscale the structure and assembly of proteins within the complex. (f) AFM micrograph of inside-out membrane preparations of isolated synaptosome. Note the porosomes (red arrowheads ) to which synaptic vesicles are found docked (blue arrowheads ). (g) High-resolution AFM micrograph of a synaptic vesicle docked to a porosome at the cytoplasmic compartment of the presynaptic membrane. (h) AFM measurements (n = 15) of porosomes (P, 13.05 ± 0.91) and synaptic vesicles (SV, 40.15 ± 3.14) at the cytoplasmic compartment of the presynaptic membrane. (i) Photon correlation spectroscopy (PCS) of immunoisolated neuronal porosome complex demonstrating a size of 12–16 nm. ( j ) Schematic illustration of a neuronal porosome at the presynaptic membrane, showing the eight ridges connected to the central plug (figure represents a collage of images from our previous publications (10, 12); Cell Biol Int 34:1129–1132, 2010).
Exposure of pancreatic acinar cells to a secretagogue results in a time-dependent increase (20–45%) in both the diameter and relative depth of depressions (Fig. 3). Studies demonstrate that depressions return to resting size on completion of cell secretion (6, 7). No demonstrable change in pit size is detected following stimulation of secretion (6). Enlargement of the depression diameter and an increase in its relative depth following exposure to a secretagogue correlates with secretion. Additionally, exposure of pancreatic acinar cells to cytochalasin B, a fungal toxin that inhibits actin polymerization and secretion, results in a 15–20% decrease in depression size and a consequent 50–60% loss in secretion (6). Results from these experiments suggested depressions to be the secretory portals in pancreatic acinar cells. Furthermore, these studies demonstrated the involvement of actin in regulation of both the structure and function of depressions. Similarly, depression in resting GH cells measures 154 ± 4.5 nm (mean ± SE) in diameter, and following exposure to a secretagogue, results in a 40% increase in depression diameter (215 ± 4.6 nm; p < 0.01), with no appreciable change in pit size (9). The enlargement of depression diameter during cell secretion and subsequent decrease accompanied by loss in secretion following exposure to actin depolymerizing agents (9) also suggested that they represent the secretory portal in GH cells. A direct determination that depressions are the secretory portals in cells, through which secretory products are expelled, was unequivocally demonstrated using immuno-AFM studies, initially in the exocrine pancreas (7) (Fig. 4), followed by studies in the GH cells of the pituitary (9). The localization at depressions of gold-conjugated antibody to secretory proteins finally provided the first direct evidence that secretion occurs through depressions. Moreover, AFM micrographs demonstrating the specific localization of gold-tagged amylase-specific antibodies (ZGs contain amylase) at depressions following stimulation of cell secretion (7, 13) conclusively demonstrated depressions to be the secretory portal in these cells. Similarly, in somatotrophs of the pituitary gland, gold-tagged growth hormone-specific antibody found to selectively localize at the depression openings following stimulation of secretion (9), established these sites too, to be the secretory portals in GH cells. Over the years, the term “fusion pore” has been loosely used to refer to plasma membrane dimples that originate following a secretory stimulus or to the continuity or channel established between opposing lipid membranes during membrane fusion. Therefore for clarity, the term “porosome” was assigned to the depression structures at the cell plasma membrane.
Fig. 3.
Porosome dynamics in pancreatic acinar cells following stimulation of cell secretion. (a) Several porosomes within a pit are shown at zero time, 5 and 30 min following stimulation of secretion. (b) Section analysis across three porosomes in the top panel is represented graphically in the second panel and defines the diameter and relative depth of each of the three porosomes. The porosome at the center is represented by red arrowheads. (c) The third panel is a 3D rendition of the porosome complex at different times following stimulation of secretion. Note the porosome as a blue cup-shaped structure with black opening to the outside, and part of a secretory vesicle (violet ) docked at its base via t-/v-SNAREs. (d) The bottom panel represents % total cellular amylase release in the presence and absence of the secretagogue Mas7 (blue bars ). Note an increase in porosome diameter and relative depth, correlating with an increase in total cellular amylase release at 5 min following stimulation of secretion. At 30 min following a secretory stimulus, there is a decrease in diameter and relative depth of porosomes and no further increase in amylase release beyond the 5-min time point. No significant changes in amylase secretion (green bars ) or porosome diameter were observed in control cells in either the presence or absence of the non-stimulatory mastoparan analogue (Mas17). High-resolution images of porosomes were obtained before and after stimulation with Mas7, for up to 30 min (modified figure from our earlier publication (6)).
Fig. 4.
Intravesicular contents are expelled to the outside through the porosome during cell secretion. (a, b) AFM micrograph and section analysis of a pit and two of the four depressions or porosomes, demonstrating enlargement of porosomes following stimulation of cell secretion in the acinar cell of the exocrine pancreas. (c) Exposure of live cells to gold-conjugated amylase antibody (Ab) results in specific localization of gold particles to these secretory sites. Note the localization of amylase-specific immunogold particles at the edge of porosomes. (d) AFM micrograph of pits and porosomes with immunogold localization demonstrated in cells immunolabeled and then fixed. Blue arrowheads point to immunogold clusters and the yellow arrowhead points to a depression or porosome opening (figure from our earlier publication (7)).
The porosome structure, at the cytosolic compartment of the plasma membrane in the exocrine pancreas ((14), Fig. 5) and in neurons ((10), Fig. 6), has also been determined at near nanometer resolution in live cells. To determine the morphology of porosomes at the cytosolic compartment of pancreatic acinar cells, isolated plasma membrane preparations in near physiological buffered solution have been imaged at ultrahigh resolution using the AFM. These studies reveal scattered circular disks measuring 0.5–1 μm in diameter, with inverted cup-shaped structures within (14). The inverted cups at the cytosolic compartment of isolated pancreatic plasma membrane preparations measure approximately 15 nm in height. On a number of occasions, ZGs ranging in size from 0.4 to 1 μm in diameter have been observed in association with one or more of the inverted cups, suggesting the circular disks to represent pits, and inverted cups porosomes, in inside-out pancreatic plasma membrane preparations. To further confirm that the cup-shaped structures are indeed porosomes, where secretory vesicles dock and fuse, immuno-AFM studies have been performed. As mentioned earlier, target membrane proteins SNAP-23 (61, 72) and syntaxin (62) (t-SNARE) and secretory VAMP v-SNARE or VAMP (60) are part of the conserved protein complex involved in fusion of opposing bilayers in the presence of calcium (58, 66, 67). Since ZGs dock and fuse at the plasma membrane to release vesicular contents, it was hypothesized that if the inverted cups or porosomes are the secretory sites, then plasma membrane-associated t-SNAREs should localize at the structure. The t-SNARE protein SNAP-23 had previously been reported in pancreatic acinar cells (72). A polyclonal monospecific SNAP-23 antibody recognizing a single 23 kDa protein in immunoblots of pancreatic plasma membrane fraction, when used in immuno-AFM studies, demonstrated selective localization to the base of the cup-shaped structures ((14); Fig. 7). These results confirm that the inverted cup-shaped structures in inside-out pancreatic plasma membrane preparations are indeed porosomes. The size and shape of the immunoisolated porosome complex has also been determined in exocrine pancreas ((14); Fig. 8), neurons ((10–12); Fig. 2), and astrocytes (73) using both negative staining EM and AFM. The immunoisolated porosome complex has further been structurally and functionally reconstituted into artificial liposomes and lipid bilayer membrane ((10–12, 14), Fig. 9). Transmission electron micrographs of pancreatic porosomes reconstituted into liposomes exhibit a 150–200 nm cup-shaped basket-like morphology, similar to their native structure observed in cells and when co-isolated with a ZG preparation (14). To test the functionality of the isolated porosome complex, purified porosomes obtained from exocrine pancreas or neurons have been reconstituted in lipid membrane of the electrophysiological bilayer setup (EPC9) and exposed to isolated ZGs (Fig. 9) or synaptic vesicle preparations. Electrical activity of the porosome-reconstituted membrane as well as the transport of vesicular contents from the cis to the trans compartments of the bilayer chambers when monitored demonstrated that the lipid membrane-reconstituted porosomes are indeed functional (10, 14), since in the presence of calcium, isolated secretory vesicles dock and fuse to transfer intravesicular contents from the cis to the trans compartment of the bilayer chamber. ZGs fused with the porosome-reconstituted bilayer as demonstrated by an increase in capacitance and conductance and a time-dependent transport of the ZG enzyme amylase from cis to the trans compartment of the bilayer chamber. Amylase was detected using immunoblot analysis of the buffer in the cis and trans compartments of the bilayer chambers, using immunoblot analysis. In the pancreas, chloride channel activity present in the reconstituted porosome complex is critical to porosome function, since the chloride channel blocker DIDS inhibits porosome function (Fig. 9). Similarly, the structure and biochemical composition of the neuronal porosome and the docking and fusion of synaptic vesicles at the neuronal porosome complex have also been demonstrated. AFM, EM, and electron density measurements followed by contour mapping, and 3D topography of the neuronal porosome, have further provided an understanding of the arrangement of proteins at nanometer resolution within the complex ((12), Fig. 9). Results from these studies demonstrate that proteins at the central plug of the porosome interact with proteins at the periphery of the complex, conforming to its eightfold symmetry (Fig. 2d, e). Furthermore, at the center of the porosome complex representing the porosome base, where synaptic vesicles dock and transiently fuse, SNARE proteins are assembled in a ring conformation. In neurons, the SNARE ring is composed of merely three SNARE pairs (74, 75) having a 1–1.5 nm in diameter channel, for the express release of neurotransmitters from synaptic vesicles via the porosome to the synaptic cleft. These studies demonstrate that porosomes are permanent structures at the presynaptic membrane of nerve terminals, where synaptic vesicles transiently dock and fuse to release neurotransmitters. Photon correlation spectroscopy (PCS) of isolated porosome complexes further confirms that neuronal porosomes measure on average 14–15 nm (Fig. 2i). In PCS measurements, the size distribution of isolated porosome complexes is obtained from plots of the relative intensity of light scattered by particles of known sizes and a calculation of their correlation function. Negative staining EM performed using low electron dose in a Tecnai 20 electron microscope operating at 200 kV demonstrated that proteins at the central plug of the porosome complex interact with proteins at the periphery of the structure (12). Similar to AFM micrographs, approximately eight interconnected protein densities are observed at the lip of the porosome complex in electron micrographs (Fig. 2). The eight interconnected protein densities are also connected to the central plug, via spoke-like structures. Electron density and contour maps, together with resultant 3D topology profiles of the porosome complex, provide further details of the circular arrangement of proteins and their connection to the central plug via distinct spokes (Fig. 2e). The contour map of proteins within the neuronal porosome complex has been determined using published procedures (76–79). These results have demonstrated the arrangement of proteins at the nanometer scale within the neuronal porosome complex. The next level of understanding of this supramolecular structure requires electron crystallography of isolation complexes, which are currently in progress. Studies demonstrate that the porosome complex constitutes: SNAP, syntaxin, the cytoskeletal proteins actin, α-fodrin, and vimentin, calcium channels β3 and α1c, together with the SNARE regulatory protein NSF (13, 14). Chloride ion channels ClC2 and ClC3 have also been identified as part of the porosome complex, and as previously stated, are critical for porosome function. Isoforms of the various other proteins identified within the porosome complex have been demonstrated using 2D-BAC gels electrophoresis. For example, three isoforms each of the calcium ion channel and vimentin are found in porosomes. Using yeast two-hybrid analysis and immunoisolation, studies confirm the presence and direct interaction between some of these proteins with t-SNAREs within the porosome complex (80). In addition to these proteins, studies report that the neuronal porosome assembly requires membrane cholesterol (11). Results from recent studies (11) demonstrate a significant inhibition in interactions between porosome-associated t-SNAREs and calcium channels following depletion of membrane cholesterol. Since calcium is critical to SNARE-induced membrane fusion, the loss of interaction between SNAP-25, Syntaxin-1, and calcium channels at the neuronal porosome complex would seriously compromise or even abrogate neurotransmission at the nerve terminal.
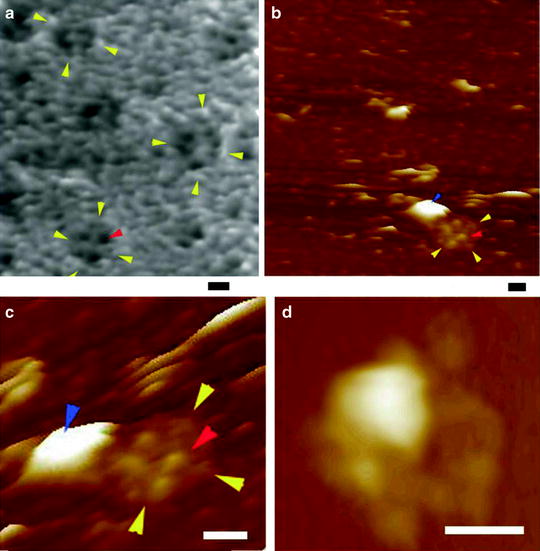
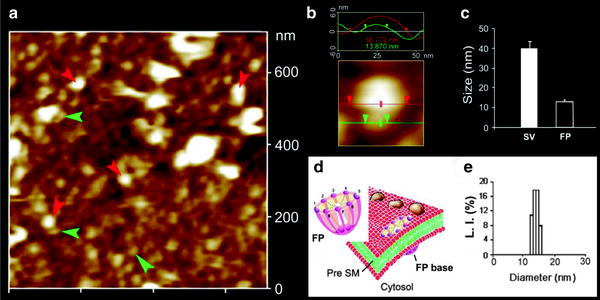
Fig. 5.
AFM micrographs of porosomes within “pits” at the surface of the apical plasma membrane in live pancreatic acinar cells, and at the cytosolic compartment of an isolated pancreatic plasma membrane preparation. (a) Several circular “pits” (yellow arrowheads) with porosomes within (red arrowhead) are seen in this AFM micrograph of the apical plasma membrane in a live pancreatic acinar cell. (b) AFM micrograph of the cytosolic compartment of an isolated pancreatic plasma membrane preparation depicting a “pit” (yellow arrowheads) containing several inverted cup-shaped porosome structures (red arrowhead) within, associated with a ZG (blue arrowhead). (c) The “pit” and inverted porosomes in (b) are shown at higher magnification. (d) AFM micrograph of another “pit” with inverted porosomes within and associated ZG (Bar = 200 nm) (figure from our earlier publication (14)).
Fig. 6.
Neuronal fusion pore distribution, size and structure. (a) shows the structure and distribution of fusion pores at the cytosolic compartment of a synaptosome. Inside-out synaptosome preparations when imaged in buffer using AFM demonstrate inverted 12–16 nm cup-shaped fusion pores, some with docked vesicles. Note one inverted cup-shaped fusion pore (green arrowheads ), with a docked synaptic vesicle (red arrowheads ), shown at higher magnification in “(b).” (b) AFM micrograph shows a 37 nm synaptic vesicle docked to a 14 nm fusion pore at the cytoplasmic compartment in the isolated synaptosomal membrane. (c) AFM measurement of the fusion pores (13.05 ± 0.91) and attached synaptic vesicles (40.15 ± 3.14) in the cytosolic compartment of the synaptosome membrane (n = 15). (d) Schematic illustration of a neuronal fusion pore showing the eight vertical ridges and a central plug. (e) PCS further demonstrates fusion pores measuring 12–16 nm (figure from our earlier publication (11)).
Fig. 7.
Morphology of the cytosolic compartment of the porosome complex revealed in AFM studies on isolated pancreatic plasma membrane preparations. (a) This AFM micrograph of isolated plasma membrane preparation reveals the cytosolic compartment of a pit with inverted cup-shaped porosomes. Note the 600 nm in diameter ZG at the left hand corner of the pit. (b) Higher magnification of the same pit demonstrates the presence of 4–5 porosomes within (c). The cytosolic side of a single porosome is depicted in this AFM micrograph. (d) Immunoblot analysis of 10 and 20 μg of pancreatic plasma membrane preparations, using SNAP-23 antibody, demonstrates a single 23 kDa immunoreactive band. (e, f) The cytosolic side of the plasma membrane demonstrates the presence of a pit with a number of porosomes within, shown before (e) and after (f) addition of the SNAP-23 antibody. Note the increase in height of the porosome base revealed by section analysis (bottom panel ), demonstrating localization of SNAP-23 antibody to the base of the porosome (figure from our earlier publication (13)).
Fig. 8.
 Histochemical Detection of Lipid Droplets in Cultured Cells
Environmental Scanning Electron Microscopy Gold Immunolabeling in Cell Biology
Histochemical Detection of Lipid Droplets in Cultured Cells
Environmental Scanning Electron Microscopy Gold Immunolabeling in Cell Biology
 Colocalization Analysis in Fluorescence Microscopy
 Atomic Force Microscopy Functional Imaging on Vascular Endothelial Cells
 Imaging Non-fluorescent Nanoparticles in Living Cells with Wavelength-Dependent Differential Interference Contrast Microscopy and Planar Illumination Microscopy
 Environmental Scanning Electron Microscopy in Cell Biology


Related posts:
Histochemical Detection of Lipid Droplets in Cultured Cells
Environmental Scanning Electron Microscopy Gold Immunolabeling in Cell Biology
Colocalization Analysis in Fluorescence Microscopy
Atomic Force Microscopy Functional Imaging on Vascular Endothelial Cells
Imaging Non-fluorescent Nanoparticles in Living Cells with Wavelength-Dependent Differential Interference Contrast Microscopy and Planar Illumination Microscopy
Environmental Scanning Electron Microscopy in Cell Biology
Stay updated, free articles. Join our Telegram channel
Full access? Get Clinical Tree
