and Rakhi Kaila2
(1)
School of Physics, University of New South Wales, Sydney, NSW, Australia
(2)
School of Medicine, University of New South Wales, Sydney, NSW, Australia
Abstract
The neurodegenerative Wilson disease (NWD) is a genetic disease. It is caused by mutations in the P-type ATPase. The defect leads to abnormal copper transport and metabolism in mitochondria and causes apoptotic and necrotic cell death due to oxidative damage after excess accumulation of intercellular copper. MRI shows T2 hyper intense lesions involving mostly the putamina and less frequently the thalamic brain stem cerebellar dentate regions and cerebral white matter. The diffusion weighted imaging (DWI) and proton magnetic resonance spectroscopy (PMRS) are very useful techniques to shed light on the pathogenesis of NWD by inspecting the microscopic water diffusion and cellular metabolism in vivo. The T1-weighted imaging (T1WI) shows low signal intensity and markedly high intensity on T2-weighted imaging (T2WI) on asymmetrical basal ganglionic lesions. Moreover there is seen increased intensity on T2WI, of the occipital, peri-ventricular and subcortical white matter bilaterally without mass effect, suggestive of demyelination. Single voxel PMRS with voxel placed in the right putaminal lesion shows a low N-acetylaspartate/creatine ratio and a high lactate/Cr ratio, in contrast to those of bilateral occipital lobes. It is seen that impairment of copper transport across membranes leads to accumulation of copper in the liver, brain, cornea and kidney, and causes toxicity to those regions.
3.1 Conventional MRI Techniques
3.1.1 T1 and T2 Weighted Images: Wilson Disease
The neurodegenerative Wilson disease (NWD) [1] is a genetic disease. It is caused by mutations in the P-type ATPase. The defect leads to abnormal copper transport and metabolism in mitochondria and causes apoptotic and necrotic cell death due to oxidative damage after excess accumulation of intercellular copper. MRI shows T2 hyper intense lesions involving mostly the putamina and less frequently the thalamic brain stem cerebellar dentate regions and cerebral white matter. The diffusion weighted imaging (DWI) and proton magnetic resonance spectroscopy (PMRS) are very useful techniques to shed light on the pathogenesis of NWD by inspecting the microscopic water diffusion and cellular metabolism in vivo. The T1-weighted imaging (T1WI) shows low signal intensity and markedly high intensity on T2-weighted imaging (T2WI) on asymmetrical basal ganglionic lesions. Moreover there is seen increased intensity on T2WI, of the occipital, peri-ventricular and subcortical white matter bilaterally without mass effect, suggestive of demyelination. Single voxel PMRS with voxel placed in the right putaminal lesion shows a low N-acetylaspartate/creatine ratio and a high lactate/Cr ratio, in contrast to those of bilateral occipital lobes. It is seen that impairment of copper transport across membranes leads to accumulation of copper in the liver, brain, cornea and kidney, and causes toxicity to those regions.
The damaged copper transport secondarily causes a low serum ceruloplasmin level. The lesions tend to be bilateral and often symmetrical and may involve gray and white matter. The putamen, caudate nucleus, global pallidus, claustrum, thalamus, cortical, subcortical regions, mesencephalon, pons, vermis and dentate nucleus, are all targets of injury. One finds in WD the gene defect (P-ATPase) affects the function of cytochrome C oxidase at the level of the mitochondria. Cytochrome C oxidase (COX-complex IV) requires copper to function. In the absence of functional copper there may be COX deficiency with resultant elevation of lactate. The presence of the lactate accumulation in the edematous putaminal lesion suggest failure of aerobic respiration of the brain cells and the start of apoptosis. The MR image findings of bilateral putaminal necrosis at an acute stage can be a savior for the patient. Figure 3.1a is a rough picture of the regions of the brain on a global scale. Figure 3.1b [1] shows how measurement of relaxation Time T2 is achieved. In the X-Y plane Fig. 3.2 [1] presents clinical results for Wilson disease in a particular case.
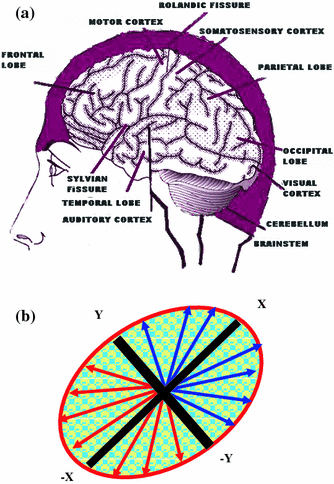
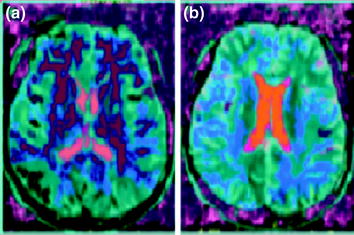

Fig. 3.1
a Human brain seen from the left side. Some of the important structural landmarks and special areas of the cerebral cortex are indicated. b A rough sketch of the projection of the spins in the X-Y plane is shown above. By applying static magnetic field along Z-direction spins are initially oriented along Z-direction. Later these spins are projected on the X-Y plane by applying 900 RF pulse along the X or Y-direction. The spins dissociate and re-associate (converge) in the X-Y plane; the time in between is recorded as the T2 relaxation time. Spins can externally be reversed by application of 1800 (reversal pulse) with respect to the X or Y-axis,. Then their relaxation in the X-Z or Y-Z plane cane be measured. This is called as the T1 relaxation time

Fig. 3.2
a An MR study, b six months later, showed collapse of the bilateral putamina and the diffuse white matter hyper intensity over the bilateral cerebral hemispheres on T2WI (T2-Traansverse relaxation time weighted image). A diseased (Wilson disease) brain. The conventional imaging
3.1.2 J-Resolved 2D-Spectroscopy Imaging: Metabolite Concentrations
GABA (gamma-amino butyric acid) is the primary inhibitory neurotransmitter in the brain. It is of considerable interest in many neuropsychiatric and neurological disorders [2]. It exists in low concentration, in vivo, ~1 μM/cc. GABA has a complicated multi-resonance spectrum that is overlapped by the dominant creatine (Cr), n-acetyl-aspartate (NAA) and glutamine/glutamate (Glx) resonances. Linear interaction like the chemical shift is averaged out during echo time TE. The decay of the transverse magnetization is solely due to T2 relaxation neglecting effects due to spin diffusion and chemical exchange. Bilinear interaction i.e. J-coupling is unaffected by the refocusing pulse leading to the J-modulation of the magnetization during TE (echo time). The second dimension in 2D J-resolved spectra has information only about the J-interaction. The location of cross-peaks due to each coupled spin-pair yields the magnitude of the J-coupling. Due to strong coupling, improper refocusing of chemical shifts, leads to additional cross-peaks. It is seen that the 2D-J-resolved MRSI (two dimensional J-resolved magnetic resonance imaging) is sensitive to detect physiological differences in the living brain. Elevated grey matter GABA concentration makes physiological sense since ~75 % of all synapses are GABA-ergic. One can isolate and focus GABA measurement to specific tissue-type.
MRS (magnetic resonance spectroscopy) studies can now interrogate the complex biochemical interactions relating GABA activity and also that of the other amino acid-metabolites with bioenergcis and membrane metabolism detected with phosphorous (31P) MRS. It is not clear how macromolecules and other close proximity metabolites differ between grey and white matter. The tissue-specific concentration differences are still very much unaddressed. It is an issue of particular importance since it is known that a prominent macromolecule resonance exists at 3.00 ppm with cross peaks at 7.8 Hz. Two other noteworthy metabolites that have chemical shifts and J-resolved cross peaks in close proximity to GABA are aspartate and glutathione. Aspartate has a resonance at 2.80 ppm with 9.1 Hz J-coupling whereas glutathione has components at 2.93 and 2.97 ppm with 4.7 and 14.1 Hz J-coupling, respectively. Owing to the closely matched J-coupling but relatively distant chemical shift the contribution from aspartate to J-resolved GABA peak is more influenced by T2 as opposed to glutathione which is removed enough in its J constant but directly overlapping in its chemical shift that a possible contribution may exist (Figs. 3.2, 3.3 [2]).
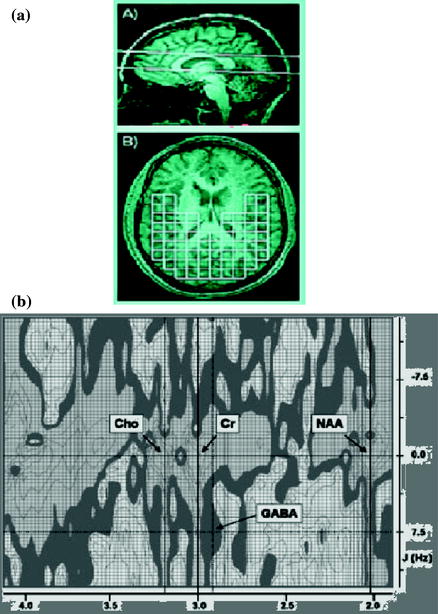

Fig. 3.3
a Sagittal image at 4T depicting the placement of the 30 mm thick magnetic resonance spectroscopy slab. b Oblique T1-weighted image. It shows sampled 2D-JMRSI (J-coupled magnetic resonance spectroscopic imaging) voxels used to derive grey and white matter estimates of brain GABA concentration. C 2D plot of J-resolved spectrum from a voxel in the human brain. The main resonance lines of Choline, Creatine and NAA are clearly visible. The J-resolved GABA resonance at 2.95 ppm exists at the intersection of the J = 7.5 Hz and 2.95 ppm lines
3.1.3 Huntington’s Disease: 3 T (Tesla) MRI (T1 and T2 Protocols)
One of the autosomal dominant neurodegenerative brain disorder is the Huntington’s disease (HD) [3]. HD originates from CAG repeat expansion in HTT the gene that encodes Huntington which is on chromosome 4HD is characteristic of a triad of signs: progressive motor dysfunction, cognitive decline and psychiatric disturbance. The formal diagnosis of HD is made on the basis of motor signs. The concept of ‘motor onset’ or ‘phenoconversion’ is defined as the unambiguous presence of an otherwise unexplained movement disorder. This does not however account for the many individuals who show cognitive or behavioral disturbances several years before the onset of motor systems. In HD (Fig. 3.4 [3]) one aims to exploit the certainty of disease manifestation to ascertain the biomarkers and endpoints to test therapeutic interventions early in the disease. The MRI technique used was that of the conventional T1 and T2 weighted images with a 3 T (Tesla) scanner. One experiences a shrinkage of the caudate nuclei and expansion of the CSF spaces in participants in the study.
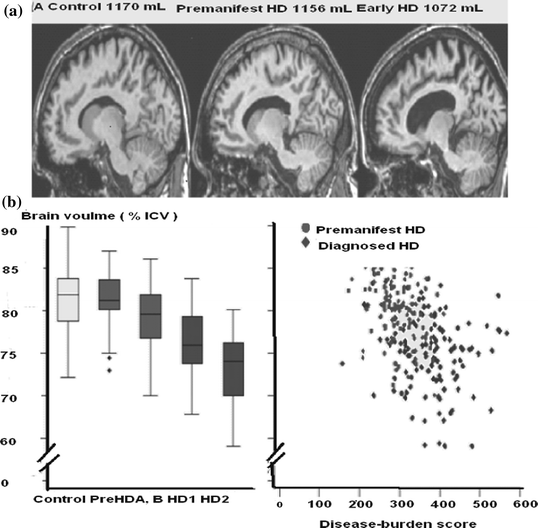
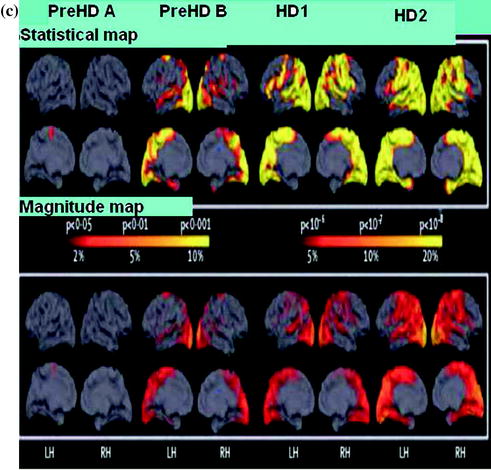


Fig. 3.4
Whole brain and regional atrophy in the controls premanifest and early Huntington’s disease groups. a 3T volumetric MRI scan in a 50-year-old control a 55-year-old individual with pre HD and a 49-year-old with early Huntington’s disease. Brain volumes are corrected for intracranial volume. b Left Y-axis: Brain volume (% ICV), X-axis: Control, PreHD-A, PreHD-B, HD1, HD2. Right Y-axis: Filled circle, Premanifest HD, filled diamond, diagnosed HD, X-axis: Disease-burden score. Brain volume as a percentage of intracranial volume (ICV) across all groups (horizontal lines are median; boxes, upper and lower quartiles; bars are range; dots are outliers) and scatter plot of brain volume as a percentage of intracranial volume against disease burden. c Cortical thinning in the Huntington’s disease groups compared with controls. The top panel shows statistical maps corrected with the false discovery rate; magnitude maps are shown below. All results are adjusted for age and sex. ICV intracranial volume. LH left hemisphere, RH right hemisphere
Automated volume of the striatum, caudate nuclei, and putamen are seen significantly reduced compared with controls. Semi-automated whole brain measures show a stepwise decline. It is seen there are progressive abnormalities in both the grey and white matter. The MRI indicates that abnormalities occur before diagnosis in the absence of overt motor signals in the grey and white matter and involve both cortical and subcortical regions. One finds that that neuronal dysfunction occurs many years before the development of motor signs that are diagnostic of HD. Highly sensitive MRI readouts include 3T neuroimaging, quantitative motor and cognitive assessments and emphasize the multi-system nature of the abnormalities. The predictability of the HD makes it the most governable of the neurodegenerative diseases from the standpoint of early intervention. Below is included a useful practical illustration for educational purpose.
3.1.4 Sodium Long Component
T 2 * mapping
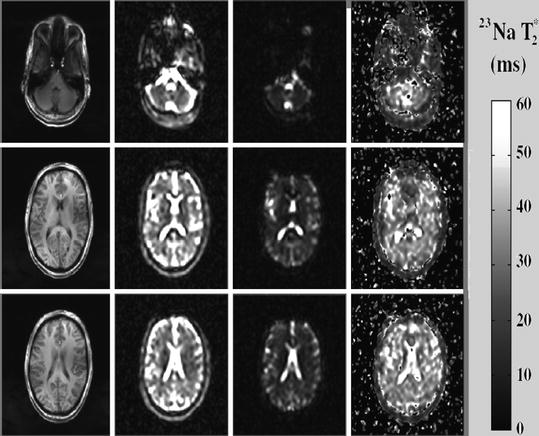
It is a common knowledge now that it is very important to have reliable information about the cellular and metabolic integrity of the brain. The presence of the nuclei, e.g. Na, K, etc. in the tissue-brain system, control the energetics and the dynamics of the local brain spin system [4]. Information collected in MRI about sodium ion concentration in the brain-tissue system provides an initial knowledge base for the pathologic conditions such as tumors and acute cerebral ischemia. Sometimes in MRI literature T2* instead of T2 is referred. Basically the two time are the same except that T2* is made free of the unwanted effects of in homogeneity e.g. due magnetic field. The T2*of concern here is in the regions of interest These are cerebrospinal fluid (CSF) at the level of the lateral ventricles, thalamus, putamen and occipital and frontal gray matter, splenium of the corpus callosum and periventricular, occipital, frontal and cerebellar white matter. In vivo T1-weighted anatomic images together with corresponding sodium images and T2*-decay parametric maps as an illustration are shown in Fig. 3.4 [4]. The T2* values are seen to vary considerably between CSF and the grey and white matter. Since signal due to quadrupolar splitting from sodium ions in dilute water solutions is removed by motion averaging, Na CSF transverse relaxation rate (T2*) should be similar to that of the saline.
The similarity of T2* values for the grey and white matter suggest that the sodium ion environment in these two tissue types is similar despite the differences in the sodium concentrations. This problem can be alleviated using instead the quantum magnetic resonance imaging (QMRI). It is seen that the correlation time of the random sodium ion motion is much smaller compared to the time scale defined by the Larmor frequency. The study of T2* values through conventional MRI at he moment is of great help in mapping of the brain. It provides diagnostic potential in pathological conditions such as the brain tumors, head trauma and multiple sclerosis (MS). Sodium ion due to its non-centro symmetric charge distribution produces electric quadrupole effect and interaction with the magnetic dipole. Measurement of this interaction through triple quantum coherence technique can form a source of exact quantification in variation of sodium ion concentration through various tissues. See Sect. 7.2.2 for another a practical illustration. Figure 3.5 [4] is a typical practical illustration on conventional Na MRI.

