and Rakhi Kaila2
(1)
School of Physics, University of New South Wales, Sydney, NSW, Australia
(2)
School of Medicine, University of New South Wales, Sydney, NSW, Australia
Abstract
A valid distinction between cytotoxic and vasogenic edema is based mainly on the differences in blood–brain barmier permeability. Vasogenic edema fluid develops in association with a variety of pathologic conditions such as brain tumors, brain abscesses hypertension or areas of infarction. In cases of brain tumor edema fluid leaks from the tumor vessels and spreads into the surrounding white matter. Similarly, cryogenic injury of the cerebral cortex causes a transient breakdown of the blood–brain barrier in the zone bordering the necrotic region allowing edema fluid to spread into the white matter. The regions in which the blood–brain barrier is defective and those in which the edema accumulates do not necessarily correspond. MRI has a proved to be a valuable and sensitive method by which to detect vasogenic edema. Multinuclear MR imaging (proton and sodium) permits in vivo assessment of the relative distributions of water and sodium within the brain. One can define the sodium signal associated with edema fluid as well as investigate the relaxation characteristics of extra-cellular sodium, for properties that may be specific to sodium in the extra-cellular compartment. A model of vasogenic edema can thus be developed. Previously models have relied on local injury to the brain by either cold or chemical insult. The resulting region of necrotic brain has a defective blood–brain barrier and vasogenic edema forms adjacent to the injured tissue. One can avoid a mixture of necrotic and edematous brain tissue by the use of a non traumatic mode of vasogenic edema in mongrel dogs.
11.1 Vasogenic Edema: Experimental Canine/Human Model
A valid distinction between cytotoxic and vasogenic edema [1] is based mainly on the differences in blood–brain barmier permeability. Vasogenic edema fluid develops in association with a variety of pathologic conditions such as brain tumors, brain abscesses hypertension or areas of infarction. In cases of brain tumor edema fluid leaks from the tumor vessels and spreads into the surrounding white matter. Similarly, cryogenic injury of the cerebral cortex causes a transient breakdown of the blood–brain barrier in the zone bordering the necrotic region allowing edema fluid to spread into the white matter. The regions in which the blood–brain barrier is defective and those in which the edema accumulates do not necessarily correspond. MRI has a proved to be a valuable and sensitive method by which to detect vasogenic edema. Multinuclear MR imaging (proton and sodium) permits in vivo assessment of the relative distributions of water and sodium within the brain. One can define the sodium signal associated with edema fluid as well as investigate the relaxation characteristics of extra-cellular sodium, for properties that may be specific to sodium in the extra-cellular compartment. A model of vasogenic edema can thus be developed. Previously models have relied on local injury to the brain by either cold or chemical insult. The resulting region of necrotic brain has a defective blood–brain barrier and vasogenic edema forms adjacent to the injured tissue. One can avoid a mixture of necrotic and edematous brain tissue by the use of a non traumatic mode of vasogenic edema in mongrel dogs.
A major technical obstacle is catheterization of the internal carotid artery without inducing spasm. This was accomplished by gently placing the catheter tip into the infundibulum of the internal carotid artery and making a test injection. The major arterial supply to the canine brain is through the anastomotic ramus that originates from the internal maxillary artery and joins the internal carotid artery. Therefore occlusion of the internal carotid artery by the catheter tip does not produce ischemia. However spasm of the internal carotid artery results in adequate delivery of osmotic agents to the cerebral hemisphere and failure to disrupt the blood–brain barrier. The proton images of the two patients (chronic/human) with vasogenic edema secondary to well-circumscribed meningiomas revealed reduced signal intensity on the multiple saturation recovery images at TRs of 150 and 300 ms. The calculated T1 images gave poor definition of the region of edema. On the third- and fourth-echo MSE (multi-spin echo) images as well as the calculated T2 images the areas of vasogenic edema were well circumscribed and easily discernible. The sodium images of these patients revealed an increased sodium signal from the regions of vasogenic edema. The sodium signal was very intense and easily identified. In the normal brain electron microscopy demonstrates substantial variation in the extra-cellular compartment. In the gray matter the cellular membranes are in a regular pattern and are separated by only 100–200 angstroms (~10 nm) whereas in the white matter the intracellular spaces are irregular and may be oven 800 (~80 nm) angstroms wide. In the white matter, edema causes widening of the extra-cellular spaces and swelling of astro-cystic processes. In vasogenic edema the excess extra-cellular fluid is related to increased permeability of the blood–brain barrier such as occurs in the vicinity of brain tumors traumatic lesions and inflammatory foci. The increased vascular permeability allows indiscriminate escape of plasma components including serum proteins, electrolytes, and water.
The events that lead to the formation of vasogenic edema are not simultaneous. When the blood–brain barrier is opened through acute injury water and electrolytes first enter the extra-cellular space. The sodium content of vasogenic edema fluid induced by cryogenic injury increases. The spread of extravasated plasma contents (water, sodium and plasma proteins) is much more extensive in the white matter than in the gray matter. Also the osmotic pressure of the edema fluid colloid is elevated in accordance with its high protein content. The force that propagates vasogenic edema appears to be the mean arterial blood pressure which subsequently is influenced by the state of cerebral vasomotor autoregulation. Increased blood–brain barriers permeability effectively makes edematous brain tissue part of the extracerebral systemic extnacellu!ar space and therefore liable to expansion and nonosmotic hyperhydration. Similarly, the defective blood–brain barrier allows rapid penetration of osmotic agents into the affected areas. This accounts for the poor response of vasogenic edema to systemically administered osmotic agents. The characterization of sodium in the extracellular compartment by MR imaging is complicated by the quadrupolar nature of the sodium nucleus. The quadnupolar relaxation of a spin 3/2 nucleus decays as a weighted sum of two exponentials. The result is a two-component T2 relaxation. Vasogenic edema fluid corresponds best to a two-site exchange model. In such a model the sodium ion exchanges between a solvated free state and a bound site on a serum macromolecule. Sodium ions tightly bound to serum proteins will not contribute to the total intensity of the sodium signal.
It is demonstrated that approximately 1 % of serum sodium is bound and that it is in constant fast exchange between potential binding sites on serum macromolecules and aqueous solution. It is seen there is shortened T2 values for serum sodium compared with those of sodium bromide solutions. This effect was not attributed to protein binding but rather to the presence in serum of polyelectrolytes that are surrounded by ordered shells of water molecules, a configuration that increases the reorientation time of both water molecules and hydrated ions. In vivo sodium MR imaging provides an opportunity to study the electrolyte composition of edema fluid. Current imaging techniques enable in vivo measurement of the two major components of edema fluid: water and sodium. Water content is assessed by investigation of the proton density, T1, and T2. Sodium content is assessed by signal intensity and T2 relaxation characteristics. One hopes in the near future to be able to quantitate the sodium signal and thus provide an opportunity to investigate tissue osmolality. Sodium MR imaging offers the potential for providing new insights into the management of patients with vasogenic edema and may also permit in vivo estimation of the abnormalities, in extra cellular space associated with cerebral neoplasm. In the Fig. 11.1 are presented clinical results in the human model.
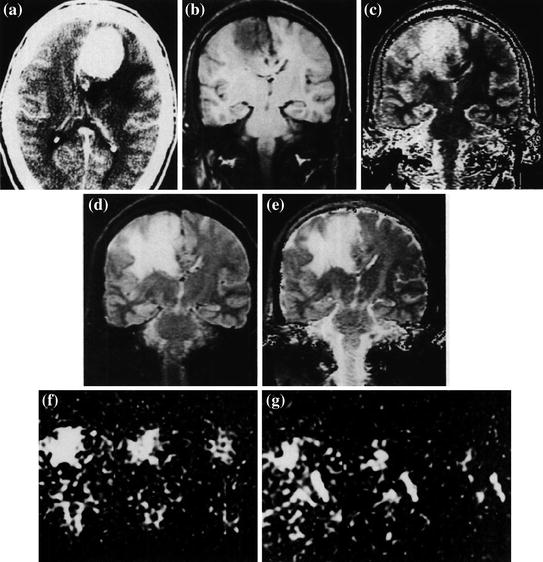

Fig. 11.1
a Contrast-enhanced axial CT scan of a patient with a flax meningioma. b Coronal MSE image (TR 600 ms) obtained along the posterior margin of the meningioma. The vasogenic edema is inconspicuous. c Calculated T1 image (long T1 represented as high intensity) poorly defines the edematous region. d Coronal image obtained with a MSE sequence (TE 100 ms, TR = 2,000). The edematous area is well delineated. e Calculated T2 image also demonstrates the edematous white matter clearly f, g Coronal sodium MR images at TE 13, 26, and 39 ms. The sodium signal intensity is markedly elevated in the region of vasogenic edema. g Coronal sodium images (TE 13, 26, and 39 ms) that include areas of normal brain tissue, vasogenic edema, and cerebrospinal fluid (CSF) in the occipital horn. The sodium signal in the edema fluid appears to have a slightly shortened T2 than in the CSF
11.2 Tissue Sodium Concentration Tissue Viability (Stroke): Human Model (Conventional MRI)
It is imporatnat in some situations to know the role of sodium MR imaging in a comprehensive MR imaging protocol for monitoring tissue viability [2] in stroke. One can use for this purpose TSC (tissue sodium concentration) as measured by sodium MR imaging with apparent diffusion coefficient (ADC) and blood pool parameters derived from proton MR imaging. It can be done in a nonhuman primate model of acute embolic stroke and in patients with acute or nonacute stroke. The TSC parameter was evaluated in the setting of stroke along with the diffusion and perfusion parameters. Representative images and maps for a 62-year-old man with a 1-day-old stroke are presented in Fig. 11.2 [4]. It demonstrates the results from the comprehensive MR imaging protocol. In the area of stroke the thrombus caused the bolus of contrast material to have a prolonged TTT (tissue transit time) and delayed TA (arival time). These were displayed as bright voxels. Conventional 1H MR imaging is insensitive for the detection of acute stroke. Diffusion-weighted imaging and its quantitative counterpart of ADC mapping are very sensitive in the early detection of ischemia. ADC and diffusion-weighted imaging show changes well before the thresholds of irreversible tissue injury related to water and ion homeostasis. The ADC and diffusion-weighted imaging are sensitive for detection of ischemia but do not provide a complete description of pathophysiologic conditions due to stroke in the primate brain. For any particular set of MR images to be useful in a clinical setting, particularly in a medically urgent situation such as acute stroke the technical success rate for yielding useful information must be considered.
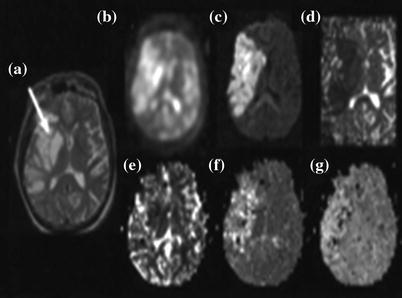

Fig. 11.2
Representative MR images in a 62-year-old man who presented with left-sided paralysis that lasted 24 h. a T2-weighted spin-echo 1H image (2,500/102) through a stroke lesion (arrow). b 23Na image (80/0.4). C Diffusion-weighted 1H image (6,000/152). d ADC map. e Relative CBV map. f TTT map. g TA map. Parameter values for the lesion and the contralateral normal region respectively are as follows: TSC, 78 and 46 mmol/L; ADC, 0.21 × 10⁻³ and 0.64 × 10⁻³ mm2/sec; TTT (tissue transit time), 37 and 14 s; and TA, 16 and 11 s. The relative CBV (cerebral blood volume) of the lesion was just less than half that of the contralateral homologous region
Sodium MR imaging has long been proposed as a useful method to assess pathologic changes in the brain but medical applications have not developed because of the lack of an acceptable clinical implementation. The potential benefits of this method in stroke have been overshadowed by the newer proton-based methods of diffusion and perfusion imaging. Whereas the ADC parameter was useful in detecting the stroke very rapidly after embolization it was less informative over the critical first 6 h as it remained relatively stable. In marked contrast TSC (tissue sodium concentration) showed a linear increase over 6 h characterized by a rate of increase of about 5.7 mmol/L/h and approached 70 mmol/L at 6 h by which time the tissue was shown at histologic examination to be infarcted. The progression of stroke to infarction is dependent on both perfusion level and duration of reduced flow. The steadily increasing TSC level marked the changing metabolic status of the lesion. As shown in the treated animal, thrombolytic therapy after 150 min when TSC was still be (low 55 mmo/L) markedly decreased the volume of the infarct as compared with the result with no intervention.
As new neuroprotective agents enter clinical practice as alternatives to thrombolysis triaging patients to undergo appropriate therapies may be helped by this comprehensive MR imaging assessment of the tissue physiologic condition and viability. The model of TSC for assessing hyperacute stroke physiology is described approximately as follows. Table 11.1 [2] shows the scheme that summarizes the relationship between TSC and loss of tissue viability for a two-compartment model in which the vascular and extracellular compartments are considered as one compartment. For an intracellular compartment volume V i and sodium concentration C i and an extracellular compartment volume V e, and sodium concentration C e, the conservation of mass gives the following: TSC (V i + V e) = V e C e + V i C i. For a voxel of volume V, V = V i + V e or V e = V − V i, which allows, TSC to be expressed in terms of the intracellular volume fraction V i/V, as follows: TSC = Ce + (Ci – Ce) (Vi/V). Thus for a fixed volume fraction increasing intracellular sodium concentration C i increases TSC. Alternatively as the intracellular volume fraction decreases with loss of cell integrity TSC approaches C e. It is important to realize this model is not just a redistribution of sodium within a voxel. The extracellular compartment is buffered with even minimal perfusion and the high diffusibility of sodium ions from the space of the entire body which is regulated systemically at a constant value of C e.
Table 11.1
Vasucular Compartment (3 % Na)
Vascular Compartment (3 % Na) = 140 mM | |
|---|---|
Intra-cellular Compartment (85 %) Na = 10 mM | Extra-cellular Comprtment (12 %) Na = 140 mM |
It represents diagram of the two-compartment model of TSC. The vascular compartment is a part of the extracellular compartment as the extracellular sodium concentration (in millimoles per liter) is always maintained because of the rapid diffusion of sodium ions from the vascular compartment that is buffered by the rest of the body. In normal brain tissue the large intracellular compartment maintains a low sodium concentration against a high sodium concentration in the small extracellular compartment. During stroke the normal intracellular space decreases and the extracellular compartment expands with loss of ion homeostasis as the cell integrity is lost. As the extracellular sodium concentration is maintained through the vascular compartment even at low levels of perfusion, TSC must increase, which is a direct measure of the loss of cell integrity. Percentages in parentheses are percentages of voxel volume (Table 11.2) [4].
Table 11.2
Vasucualr Compartment (4 %)
Vascular Compartment (4 % Na) = 140 mM | ||
|---|---|---|
Intra-cellular Compartment (Intact) [Na] = 10 mM | Intra-cellular Compartment (loss of ion homeostasis) [Na]> 10 mM | Extracellular Compartment [Expanding] [Na] = 140 mM |
It represents diagram of the two-compartment model of TSC. The vascular compartment is a part of the extracellular compartment as the extracellular sodium concentration (in millimoles per liter) is always maintained because of the rapid diffusion of sodium ions from the vascular compartment that is buffered by the rest.
11.3 Human Brain In-vivo Sodium MRI: Soft Inversion recovery (Conventional Versus Quantum MRI)
The ability to assess intracellular sodium concentrations [Nain] may greatly facilitate the diagnosis of diseased tissue in the human brain [3]. [Nain] appears to directly correlate with the rate of cell proliferation and monitoring [Nain] may be useful in the analysis of neoplasms and their response to chemotherapy. The ability to assess [Nain] may also be useful in the setting of acute stroke as dramatically increased [Nain] levels associated with anoxic depolarization and the subsequent relatively slow diffusion of sodium ions from other parts of the brain into the ischemic core appear to be directly linked to cell damage during ischemia. The valuable information pertaining to the diseased state of tissue can be obtained with sodium MRI techniques that facilitate quantification of bulk tissue sodium concentrations; strongly intracellular weighted imaging techniques that limit the signal contribution from the more highly concentrated extra-cellular space (ECS) (140 mM vs. 10–15 mM intracellular) may provide an improved means to characterize [Nain] in some cases. There is an approach to use of multiple-quantum filtering techniques. However, the signal intensity following a multiple-quantum spin sequence is a small fraction of the signal intensity following a single ideal 90o excitation pulse (10 % has been given as a typical in vivo value). There is an another approach that uses. an inversion recovery (IR) Technique. A considerable T1 relaxation differences exist between two environments. IR can be used to eliminate the signal contribution from either environment. Although it is well understood that the ECS (extra-cellular space) in the brain contains many different types of proteoglycans most attached to the cell membranes little is known about the density of these molecules.
It has been suggested that the density of this extra-cellular matrix is quite sparse allowing volume transmission through the ECS. Because T1 measurements have been shown to correlate with matrix density, sodium T1 relaxation in the ECS may be significantly longer than in the intracellular space (ICS). Shift reagent aided experiments using an implanted gliosarcoma in rats also suggest this to be the case. Minimal sodium exchange is expected between the ICS and ECS on the relevant sodium NMR timescale. If the sodium T1 in the ECS is significantly longer than in the ICS an IR sequence may be used to eliminate the ECS signal contribution from a sodium image. When the relaxation constants T1 and T2 are much longer than an RF pulse the effects of relaxation during the pulse can essentially be ignored. The calculation of flip angle is simple and is directly related to pulse power and length. While this is usually the case for the uncoupled 1H nuclide this is not the case for the quadrupolar sodium nucleus. An IR technique labeled soft inversion recovery fluid attenuation (SIRFLA) is proposed for sodium imaging of in vivo human brain. The efficacy of this technique is demonstrated through the minimization of sodium signal from the cerebrospinal fluid (CSF) brain images acquired at a static magnetic field strength of 4.7 T. The effectiveness of soft inversion pulses to separate sodium longitudinal magnetization in different environments has been shown analyzed along with the resultant benefit in the SIRFLA sequence. This separation is the direct result of the large quadrupole interaction experienced by the sodium nucleus and is not possible in conventional 1H NMR. It is because the inversion pulse length has a dramatic impact on signal acquired from the non-nulled environment.
The IR sequence implemented with long RF inversion pulses has been given the new designation SIRFLA. Considering the relaxation parameters the SIRFLA sequence may offer an SNR benefit over triple quantum filters (TQF) for intracellular imaging. The TQF sequence is also limited by SAR as three hard 90° RF pulses are required and increasing the RF pulse length decreases acquired signal intensity. A TQF sequence with three 1-ms 90° RF pulses and the same TR repetition time) presented for the SIRFLA sequence would dissipate twice the power of the SIRFLA sequence. The SIRFLA sequence can also theoretically facilitate “full elimination” of the ECS signal contribution. In vivo TQF studies suggest a 40 % residual contribution from the ECS. Several marked artifactual hyper intensities can be seen in Fig. 11.3a [3] that are not apparent in Fig. 11.3b [3]. The most significant affect begins above the sphenoid sinus and extends into the frontal lobe. Two other less pronounced artifacts exist on the outer edges of the parietal lobes. Susceptibility induced B0 inhomogeneities are well known to exist in these areas, a product of the surrounding sinuses and bone. Artifacts caused by these B0 inhomogeneities are apparent in other imaging modalities such as single-shot EPI. These artifacts Fig. 11.3a [3] are the result of the narrow bandwidth associated with the long inversion pulse and are minimized by the wider bandwidth of the short inversion pulse in Fig. 11.3b [3].
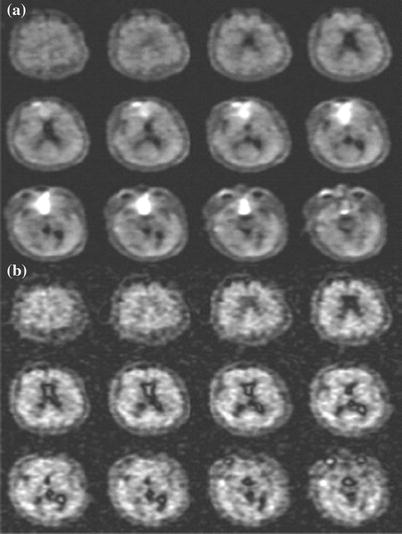

Fig. 11.3
a SIRFLA images acquired in healthy volunteer (inversion pulse length of 10 ms). SNR in the CSF is 4 and SNR in the brain tissue is 17. b Sodium IR images acquired with a much shorter inversion pulse length of 1 ms and a TR of 334 ms. SAR and voxel size are equivalent to a and the image duration was 10.7 min (or ~25 s shorter than (a)). SNR in the CSF is 2.5 and SNR in the brain tissue is 10. The SNR is 70 % greater in (a) with the longer inversion pulse than in (b). One disadvantage of the longer inversion pulse is its narrow bandwidth which results in an artifactual hyper intensity in the known areas of susceptibility a that is not seen in b. The images in (a) and (b) are not globally scaled
11.4 Statistically Optimal MRI Acquisition (General)
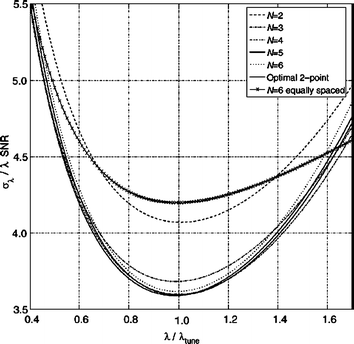
An exponentially decaying signal can be described by two parameters, its amplitude ρ and decay rate λ, given as [4] S(t) = [ρ (e−λt)]. Here t is the user-controlled encoding parameter (diffusion weighting or echo time). At least two measurements with different encodings e.g. t1 and t2 > t1, are needed to estimate λ. It has been shown that within all such ‘two point’ schemes the imaging time is used most efficiently when (t2 − t1) is chosen to be about 1.29/λ. One can examine whether multipoint acquisitions with several (more than two) encodings may be more efficient than two-point schemes in the same total measurement duration. One routinely uses the χ2-statistical fitting procedure as a measure of the precision of the decay rate estimation. It demonstrates that the most efficient multipoint scheme in fact approaches that of the two-point method. The optimal acquisition strategy is specified by a set of ti’s yielding the highest precision in the determination of the decay rate. It is naturally with the smallest σλ2 i.e., the variance. The expression in general for the variance Ai, in terms of the optimum variance σ0, can be written as ![$$\text{A}_{\rm i}=(1/\sigma_0)[({{e}_{\rm i}^{-\lambda t}})-{t}_{\rm i}\rho({{{e}_{\rm i}^{-\lambda t}}} )]$$](/wp-content/uploads/2016/08/A300799_1_En_11_Chapter_IEq1.gif) . One performs this optimization in the vicinity of the expected decay value, λ = λtune, and then evaluate σλ at arbitrary λ’s. If the actual value of λ deviates from λtune, the precision degrades as shown in Fig. 11.4 [5]. The precision loss seen is only 15 % over a wide range λ ~ (0.6, 1.5) λtune. If the decay constants to be measured are expected to vary by much more than a factor of 1.5/0.6 = 2.5 the two-point method will be inefficient at the edges of the range of λ’s.
. One performs this optimization in the vicinity of the expected decay value, λ = λtune, and then evaluate σλ at arbitrary λ’s. If the actual value of λ deviates from λtune, the precision degrades as shown in Fig. 11.4 [5]. The precision loss seen is only 15 % over a wide range λ ~ (0.6, 1.5) λtune. If the decay constants to be measured are expected to vary by much more than a factor of 1.5/0.6 = 2.5 the two-point method will be inefficient at the edges of the range of λ’s.
![$$\text{A}_{\rm i}=(1/\sigma_0)[({{e}_{\rm i}^{-\lambda t}})-{t}_{\rm i}\rho({{{e}_{\rm i}^{-\lambda t}}} )]$$](/wp-content/uploads/2016/08/A300799_1_En_11_Chapter_IEq1.gif) . One performs this optimization in the vicinity of the expected decay value, λ = λtune, and then evaluate σλ at arbitrary λ’s. If the actual value of λ deviates from λtune, the precision degrades as shown in Fig. 11.4 [5]. The precision loss seen is only 15 % over a wide range λ ~ (0.6, 1.5) λtune. If the decay constants to be measured are expected to vary by much more than a factor of 1.5/0.6 = 2.5 the two-point method will be inefficient at the edges of the range of λ’s.
. One performs this optimization in the vicinity of the expected decay value, λ = λtune, and then evaluate σλ at arbitrary λ’s. If the actual value of λ deviates from λtune, the precision degrades as shown in Fig. 11.4 [5]. The precision loss seen is only 15 % over a wide range λ ~ (0.6, 1.5) λtune. If the decay constants to be measured are expected to vary by much more than a factor of 1.5/0.6 = 2.5 the two-point method will be inefficient at the edges of the range of λ’s.
Fig. 11.4
Precision as a function of λ for several N-point protocols tuned for λtune. Here the SNR is the signal-to-noise ratio of the average of N images with minimal exponential weighting and in general, is a function of λ, if the minimal weighting, is not zero. Note that the precision of protocols with N ≥ 3 is already very close to optimal. Since the convexity of the curves is very small the precision stays within. 15 % of the best over a broad interval (0.6, 1.5) λtune. As an example of a commonly used scheme the precision for optimal 6-equally-spaced-point protocol is superposed
Measurement of exponential relaxation constants for which the two-point method is found to be the most efficient should not to be confused with the validation of the model of exponential signal decay. The latter is characterized by the goodness of the fit and requires acquisitions at multiple distinct encodings ti. Being optimal the two-point scheme lends itself admirably to applications relying on measurement of the change in the relaxation constants such as micro vessel density estimation. Indeed images acquired before and after the relaxation constant. is altered say by administration of a contrast agent naturally constitute the two points. Image intensity of the first point is given by ![$$[\rho\{e_{0}^{(-\lambda {t})}\}]$$](/wp-content/uploads/2016/08/A300799_1_En_11_Chapter_IEq2.gif) while of the second by
while of the second by ![$$[\rho e_{0}^{(-\lambda\text{t})} ]$$](/wp-content/uploads/2016/08/A300799_1_En_11_Chapter_IEq3.gif)
![$$[\rho\{e^{(-\triangle\lambda {t}) }\}]$$](/wp-content/uploads/2016/08/A300799_1_En_11_Chapter_IEq4.gif) . Since modification of the encoding parameter t between the points introduces unwanted sensitivity to the unknown “resting” tissue relaxation constant, λ0, t has to be common to both acquisitions.
. Since modification of the encoding parameter t between the points introduces unwanted sensitivity to the unknown “resting” tissue relaxation constant, λ0, t has to be common to both acquisitions.
![$$[\rho\{e_{0}^{(-\lambda {t})}\}]$$](/wp-content/uploads/2016/08/A300799_1_En_11_Chapter_IEq2.gif) while of the second by
while of the second by ![$$[\rho e_{0}^{(-\lambda\text{t})} ]$$](/wp-content/uploads/2016/08/A300799_1_En_11_Chapter_IEq3.gif)
![$$[\rho\{e^{(-\triangle\lambda {t}) }\}]$$](/wp-content/uploads/2016/08/A300799_1_En_11_Chapter_IEq4.gif) . Since modification of the encoding parameter t between the points introduces unwanted sensitivity to the unknown “resting” tissue relaxation constant, λ0, t has to be common to both acquisitions.
. Since modification of the encoding parameter t between the points introduces unwanted sensitivity to the unknown “resting” tissue relaxation constant, λ0, t has to be common to both acquisitions.The optimal acquisition strategy consists of choosing the value of t to yield the highest precision of Δλ. Interpreting ![$$[\rho\{e_{0}^{(-\lambda {t})}\}]$$](/wp-content/uploads/2016/08/A300799_1_En_11_Chapter_IEq5.gif) as the amplitude of the decay ρ and Δλ as decay constant, λ casts the problem, in terms of the relaxation constant estimation considered with one exception; ρ depends on the user selectable parameter t. However, in applications such as microvasculature imaging, requiring high doses of contrast agents λ0 is much smaller than Δλ. Therefore, for optimization purposes in the vicinity of Δλ the t dependence of ρ can be neglected. Thus, optimal exponential weighting, t as well as relaxation constant alternation are found by replacing λtune with Δλ. Figure 11.4 [4] represents summary of the graphical picture of the analysis.
as the amplitude of the decay ρ and Δλ as decay constant, λ casts the problem, in terms of the relaxation constant estimation considered with one exception; ρ depends on the user selectable parameter t. However, in applications such as microvasculature imaging, requiring high doses of contrast agents λ0 is much smaller than Δλ. Therefore, for optimization purposes in the vicinity of Δλ the t dependence of ρ can be neglected. Thus, optimal exponential weighting, t as well as relaxation constant alternation are found by replacing λtune with Δλ. Figure 11.4 [4] represents summary of the graphical picture of the analysis.
![$$[\rho\{e_{0}^{(-\lambda {t})}\}]$$](/wp-content/uploads/2016/08/A300799_1_En_11_Chapter_IEq5.gif) as the amplitude of the decay ρ and Δλ as decay constant, λ casts the problem, in terms of the relaxation constant estimation considered with one exception; ρ depends on the user selectable parameter t. However, in applications such as microvasculature imaging, requiring high doses of contrast agents λ0 is much smaller than Δλ. Therefore, for optimization purposes in the vicinity of Δλ the t dependence of ρ can be neglected. Thus, optimal exponential weighting, t as well as relaxation constant alternation are found by replacing λtune with Δλ. Figure 11.4 [4] represents summary of the graphical picture of the analysis.
as the amplitude of the decay ρ and Δλ as decay constant, λ casts the problem, in terms of the relaxation constant estimation considered with one exception; ρ depends on the user selectable parameter t. However, in applications such as microvasculature imaging, requiring high doses of contrast agents λ0 is much smaller than Δλ. Therefore, for optimization purposes in the vicinity of Δλ the t dependence of ρ can be neglected. Thus, optimal exponential weighting, t as well as relaxation constant alternation are found by replacing λtune with Δλ. Figure 11.4 [4] represents summary of the graphical picture of the analysis.11.5 Spin 3/2 Bi-Exponential Relaxation Multi-Quantum Filtration Technique (23Na Spectroscopy)
It is known that metal ions play a vital mediating role in many important biological processes. As a result of their relatively favorable properties NMR studies of the spin-3/2 nuclei, 7Li, 39K, 87Rb, and, most frequently 23Na have proved popular. The two main areas of interest [5] have been the study of these nuclei in intracellular environments and of their binding to biological molecules in solution. In both cases the spin-3/2 nuclei are likely to be tumbling in the slow-motion regime i.e. possessing a rotational correlation time τ comparable to the inverse of the Larmor frequency ωo and it is known that under these conditions both the transverse and the longitudinal quadrupolar relaxation are biexponential. Often, however biexponential relaxation is difficult to distinguish from simple exponential relaxation using conventional NMR methods. Recently it has been shown that biexponentially relaxing spin-3/2 nuclei can be filtered through a state of multiple-quantum coherence. Multiple-quantum filtration techniques can therefore provide unambiguous evidence of the presence of biexponential relaxation. In this fashion intracellular and extra cellular metal ions can be distinguished since the latter are almost always in the fast-motion regime (where they exhibit simple exponential relaxation) and the NMR signal from these ions will not pass the filter. The lineshape resulting from multiple-quantum filtration consists of the difference of two Lorentzians and analysis of this highly characteristic line shape in binding studies can indicate the motional and exchange behavior of the metal ions. In all studies of this type sensitivity is usually a prime concern because of the low concentration of metal ions in the slow-motion regime.
It has been demonstrated that a double-quantum filtration experiment for the detection of biexponential transverse relaxation in spin-3/2 nuclei works well. Some workers have apparently without exception adopted the double-quantum filtration techniques. Others also used a triple-quantum filtration experiment for the detection of bi-exponential longitudinal relaxation. It can all be done with greater sensitivity using triple-quantum filtration than using double-quantum filtration techniques. The signal amplitudes produced by the double- and triple-quantum filtration techniques for spin-3/2 nuclei are conveniently calculated using an irreducible tensor operator formalism. The density operator σ(t) for an isolated spin of quantum number S is expanded in the form σ (t) = Σl=0 to 2s Σ p=-1 to l Clp(t)Tlp, Here Tlp is an irreducible tensor operator of rank l and coherence order p. The matrix representations for S = 3/2 can be found in the MRI literature.
The transformation of an operator Tlp under a radiofrequency pulse of flip angle β, and phase φ, is given in the familiar “arrow notation” by Tlp − β (Iy cos φ – Ix sin φ) → Σp′Tlp′ dlp′ p′(β) exp{-i Δp φ)}, where p′ is the new coherence order, and Ap = p′ − p is the change in coherence order under the pulse. The amplitude of the transfer Tip to Tip′, is given by the reduced rotation matrix element dlp′p(β). By convention the dlp′p(β) are defined so that the phase φ represents a positive excursion with respect to the rotating frame y axis (i.e., φ = 0 for a y pulse, φ = 90° for a –x pulse, and so on). The rank 1 of a tensor may change under free precession or relaxation but this evolution is the same in both double and triple-quantum filtration experiments and has been calculated in detail. The pulse sequence and coherence transfer pathway diagram for multiple-quantum filtration of spin-3/2 nuclei exhibiting biexponential transverse relaxation are shown in Fig. 11.5 [5]. Significant transverse relaxation takes place during the evolution period τe and the acquisition period t2 but not during τm. The phase angle φ′ is 0° for excitation of double-quantum coherence (dotted coherence transfer pathways) and 90° for triple-quantum coherence (solid pathways) while the phase φ and the receiver are phase cycled to select the desired pathway.
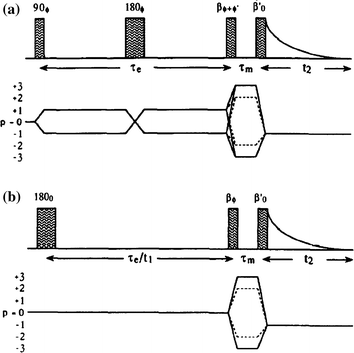

Fig. 11.5
Pulse sequences and coherence transfer pathway diagrams for multiple quantum filtration of spin-3/2 nuclei. The “transverse experiment” (a) is used to study biexponential transverse relaxation and the “longitudinal experiment” (b) is used to study longitudinal relaxation. The phase φ in (a) and (b) is stepped through the values 0°, 90°, 180°, and 270° for double-quantum filtration (dotted coherence transfer pathways) and through 30°, 90°, 150°, 2 l0°, 270° and 330° for triple-quantum filtration (solid pathways), while the receiver phase is alternated between 0° and 180°
The phase φ′ in (a) is 0° for double quantum and 90° for triple quantum filtration. Maximum sensitivity is achieved with flip angles β = β′ = 90°, except for the double quantum filtration version of (b) where β = 54.7°. To study biexponential longitudinal relaxation a variable evolution period t must be used in (b) rather than a fixed evolution period τe. The period τm, is typically a few microseconds to allow for phase shifting of the pulses. From the form of the third-rank reduced rotation matrix elements d3p′p(β) it can be shown that the signal amplitude from both techniques is maximum if the flip angles β and β’ of the two pulses in the filter are both 90°. With β′ = 90° the amplitude of coherence transfer through p = + 2 (or +3) is the same as that through p = −2 (or −3). Using the optimum phase cycling of the phase φ and the receiver the relative signal amplitudes from the double- and triple quantum filtration experiments can be determined from STQF/SDQF ~1.5 (mono-exponential case), ~1.3 (bi-exponential case). One can mathematically calculate relative signal amplitudes produced by the transverse and longitudinal experiments as function of ω0τc (ω0 = Larmor Frequency, τc = correlation constant and is plotted in Fig. 11.6 [5].
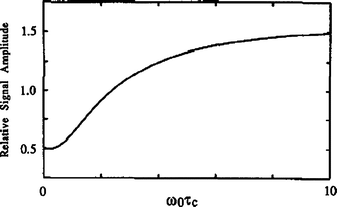

Fig. 11.6
Ratio of the signal amplitude from the optimized transverse experiment to that from the longitudinal experiment as a function of ω0 τc (ω0 = Larmor Frequency, τc = correlation constant) for pure quadrupolar relaxation. The optimum fixed evolution periods τe have been used at each value of ω0τc. The signal amplitude from the transverse triple-quantum filtration experiment is half that from the longitudinal experiment for ω0τc but is 1.59 times greater in the limit of infinitely large ω0τc
11.6 Sodium Twisted Projection Imaging (TPI)/Conventional MRI (ADC Maps) Human Model
Regulation of sodium homeostasis through counter-balancing low intracellular and high extra cellular sodium ion concentrations with potassium ions is of vital importance for cellular function [6]. These ion gradients across the cell membrane provide the potential energy for many important cellular transport processes. Action potentials intracellular pH regulation and many membrane transport processes are all directly dependent on the sodium ion gradient across the cell membrane. Damage to brain cell integrity and disruption of cell packing produce local increases in tissue sodium concentration (TSC). TSC determined by quantitative MRI has been shown to have a potential role in monitoring tissue viability in humans with diseases such as stroke and in monitoring treatment of brain tumors. Despite these potential medical applications described more than two decades ago quantitative sodium imaging has been slow to evolve.
The sodium MR signal has a detection sensitivity of four orders of magnitude lower than that of the proton signal. It exhibits biexponential relaxation behavior with fast and slow transverse relaxation characteristics (T2fast, 1–3 ms and T2slow, 12–25 ms, respectively) in biologic tissues. Therefore, sodium imaging requires an imaging sequence with a short excitation radiofrequency (RF) pulse and a short echo time (TE) to reduce signal loss from the rapid decay of the transverse magnetization. Twisted projection imaging (TPI) is a three-dimensional (3D) projection reconstruction sequence–based approach that can achieve short TE values and high acquisition efficiency.
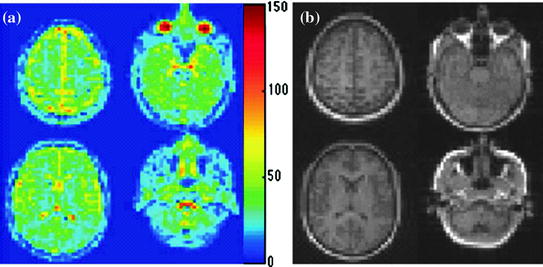
When performed at long pulse repetition times to allow full T1 relaxation quantification of TSC is possible. However the generation of TPI [6] gradient waveforms is often limited by the hardware slew rate constraint especially when starting twisting at low k-space radius is desired to reduce the number of projections needed to sample k-space at the Nyquist rate. Besides being potentially harmful to the subject and the gradient system violations of the slew rate constraint can also cause uncertainty in the k-space trajectory. The slew rate constraint can be met by using low gradient amplitude or numerical smoothing. However, these approaches result in either a long readout time that ultimately limits the achievable spatial resolution due to T2 relaxation, or k-space trajectory deviations that degrade the point-spread function (PSF) of the sequence. Meanwhile, the high data acquisition efficiency of TPI stems from its ability to sample more k-space locations in each repetition, with a relatively long readout window. This renders TPI sensitive to static field (B0) inhomogeneity even at the relatively low sodium resonance frequency. These B0 inhomogeneities must be corrected to avoid significant image blurring and distortion. In the Fig. 11.7 [6] and 11.8 [6] one would find a practical illustration of the results obtained by the TPI technique.

