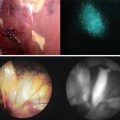
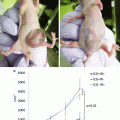
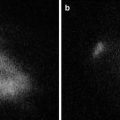
Fig. 17.1
Intraoperative ICG fluorescence liver imaging technique shows bright signals in the primary HCC nodule (arrowheads). White broken lines show the planned resection line of liver. (a) A photograph of scattered pattern (SP) by ICG fluorescence liver imaging. Tiny fluorescent signals (thin arrows) are identified throughout the residual planned liver. (b) A photograph of Non-SP. No spotty fluorescent lesions are identified
Correlations Between Intraoperative ICG Fluorescence Liver Imaging and Clinicopathological Factors
Between February 2007 and January 2008, 32 patients underwent curative hepatic resection for HCC at Osaka Medical Center for Cancer and Cardiovascular Diseases and were followed up for more than 2 years after surgery. Informed consent was obtained from every patient before surgery, and the study was approved by the Human Ethics Review Committee of Osaka Medical Center for Cancer and Cardiovascular Diseases. All data are expressed as mean ±SD. Comparisons between the two groups were performed using Student’s t-test for continuous variables and the χ 2 test or Fisher’s exact test for categorical variables. A P value <0.05 was considered to be statistically significant. All statistical analyses in this study were performed using SPSS software (SPSS Inc., Chicago, IL, USA).
The 27 men and 5 women had a mean age of 67 ± 10 years (range, 44–80 years). Twelve patients (37.5 %) were positive for hepatitis C virus (HCV) antibody, five patients (15.6 %) were positive for hepatitis B surface antigen, and 15 patients (46.9 %) were negative for both markers. The mean maximum tumor size was 28 ± 12 mm (range, 12–50 mm), and 27 patients (84.4 %) had a solitary tumor. Thirteen patients (40.6 %) underwent preoperative Transcatheter Arterial Chemoembolization (TACE). Liver cirrhosis was present in ten patients (31.3 %). Of the 32 patients, 17 (53.1 %) had a scattered pattern (SP) according to intraoperative ICG fluorescence liver imaging. Comparisons of patient clinicopathological characteristics according to presence or absence of SP are shown in Table 17.1.
Table 17.1
Patient demographics (n = 32)
SP group (n = 17) | Non-SP group (n = 15) | p-value | |
|---|---|---|---|
Clinical factors | |||
Gender (M/F) | 15/2 | 12/3 | 0.52 |
Age (years) | 65 ± 11 | 67 ± 10 | 0.60 |
HBV Ag (positive/negative) | 3/14 | 2/13 | 0.74 |
HCV Ab (positive/negative) | 7/10 | 5/10 | 0.65 |
AST (IU/L) | 35 ± 14 | 24 ± 9 | 0.02 |
ALT (IU/L) | 36 ± 15 | 24 ± 16 | 0.04 |
Total bilirubin (mg/dL) | 0.8 ± 0.4 | 0.7 ± 0.4 | 0.49 |
Albumin (g/dL) | 3.8 ± 0.4 | 3.8 ± 0.3 | 0.89 |
1CG-R15 (%) | 17.6 ± 10.4 | 13.3 ± 6.7 | 0.19 |
Prothrombin time (%) | 94 ± 13 | 94 ± 10 | 0.91 |
Tumor factors | |||
Number of nodules (single/multiple) | 14/3 | 13/2 | 0.74 |
Tumor diameter (mm) | 50 ± 24 | 41 ± 22 | 0.32 |
AFP (ng/mL) | 1,870 ± 6,830 | 1,580 ± 4,020 | 0.89 |
P1VKA-II (mAU/mL) | 3,060 ± 10,000 | 940 ± 2,610 | 0.43 |
Surgical factors | |||
Preoperative TACE (yes/no) | 8/9 | 5/10 | 0.49 |
Hepatic resection (anatomical/partial) | 8/9 | 9/6 | 0.50 |
Volume of resection (g) | 253 ± 50 | 187 ± 53 | 0.37 |
Pathological factors | |||
Intrahepatic metastasis (present/absent) | 3/14 | 1/14 | 0.60 |
Portal vein invasion (present/absent) | 3/14 | 1/14 | 0.60 |
Liver cirrhosis (present/absent) | 8/9 | 2/13 | 0.06 |
Preoperative serum aspartate aminotransferase (AST) and alanine aminotransferase (ALT) activities were significantly higher in the SP than in the non-SP group, while other clinical factors such as gender, age, etiology (HBV and HCV), and background liver function (total bilirubin, albumin, ICG rate at 15 min, and prothrombin time) were similar in the two groups. In addition, there was no difference in tumor factors (number of nodules, tumor diameter, AFP, or protein induced by vitamin K absence/antagonist II [PIVKA-II]), surgical factors (preoperative TACE, hepatic resection, and resection volume), and pathological factors (IM, microscopic portal vein invasion, and liver cirrhosis) between the two groups.
Predictors of Intrahepatic Recurrence After Hepatic Resection
All patients were followed at 3–4-month intervals after surgery. The diagnosis of intrahepatic tumor recurrence was based on computed tomography scanning or ultrasonography and supplemented with the detection of serum AFP or PIVKA-II level elevation. Recurrence-free survival (RFS) rates and curves were analyzed by the Kaplan–Meier method, and the differences between the two groups were compared using the log rank test. Multivariate analysis of the prognostic factors was performed using the Cox proportional hazard stepwise model. RFS curves of patients with and without SP are shown in Fig. 17.2. The RFS rates for patients with and without SP were 41.2 and 86.7 % at 2 years, respectively. The RFS of patients with SP was significantly shorter than that of patients without SP (P = 0.008). Preoperative AFP (≥8 ng/mL) and microscopic portal vein invasion (present) were also significantly correlated with decreased RFS rates, while other clinicopathological parameters were not. By multivariate analysis, a scattered ICG fluorescence liver imaging pattern, preoperative AFP (≥8 ng/mL), and microscopic portal vein invasion (present) were independent predictors of postoperative recurrence (Table 17.2).
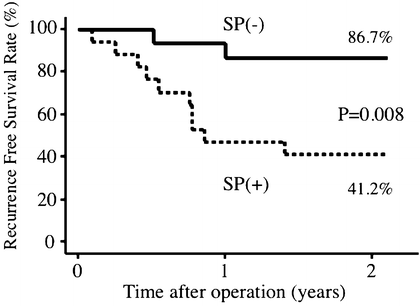

Fig. 17.2
Comparison of recurrence-free survival (RFS) rates in patients with and without scattered pattern (SP). The 2-year RFS rates are shown. The RFS of patients with SP was significantly shorter compared with survival of patients without SP (P = 0.008)
Table 17.2
Univariate and multivariate analysis of recurrence free survival (n = 32)
Variable | Patients No. | 2-year DFS (%) | Univariate P | Multivariate P | |
|---|---|---|---|---|---|
Clinical factor | |||||
Age | <65 | 15 | 73.3 | ||
≥65 | 17 | 52.9 | 0.17 | ||
Gender | Male | 27 | 66.7 | ||
Female | 5 | 40.0 | 0.16 | ||
HBV Ag | Negative | 27 | 63.0 | ||
Positive | 5 | 60.0 | 0.89 | ||
HCV Ab | Negative | 20 | 65.0 | ||
Positive | 12 | 58.3 | 0.77 | ||
AST (IU/L) | <28 | 15 | 66.7 | ||
≥28 | 17 | 58.8 | 0.55 | ||
ALT (IU/L) | <28
Stay updated, free articles. Join our Telegram channel
Full access? Get Clinical Tree
 Get Clinical Tree app for offline access

| ||||
