Principles of Elastography
2.1 Overview
Elastography is a recently developed technique in ultrasound that can provide clinically useful information about tissue stiffness not previously available. Elastography, or elasticity imaging, is an imaging modality based on tissue stiffness rather than anatomy. Palpation has been used to assess stiffness to evaluate for malignancies for over a thousand years.17 Ultrasound elastography can be considered the imaging equivalent of clinical palpation because it can quantify the stiffness of a lesion, which was previously judged only subjectively by physical exam.
There are two types of elastography: strain elastography (SE) and shear wave imaging (SWE).18 SE produces an image based on how tissues respond to a displacement force from an external (transducer or acoustic radiation force impulse [ARFI]) or patient source (breathing and/or heartbeat). This allows for a qualitative assessment of the lesion in terms of how stiff the tissue is compared with surrounding tissues in the field of view (FOV). In other words, with SE the “exact” stiffness is not known, only how stiff one tissue is in comparison with other types of tissue in the FOV. SWE uses ARFI imaging, or in lay terms a “push pulse,” which acts as the compressing force. A natural sequel to this push pulse is the production of shear waves, which, when their velocities are measured, allow quantification of stiffness.
2.2 Strain Elastography
SE determines the relative strain or elasticity of tissue within an FOV.18 The more an object deforms when a force is applied the higher the strain and the softer the lesion. To determine the strain of a tissue or lesion one must evaluate how the lesion deforms when an external force is applied. For example, if we had an almond in a bowl of gelatin (▶ Fig. 2.1a) and pushed down on the gelatin (▶ Fig. 2.1b), the gelatin would deform, indicating it has high strain and is therefore soft. However, the almond, having low strain, would not deform and is therefore stiff.
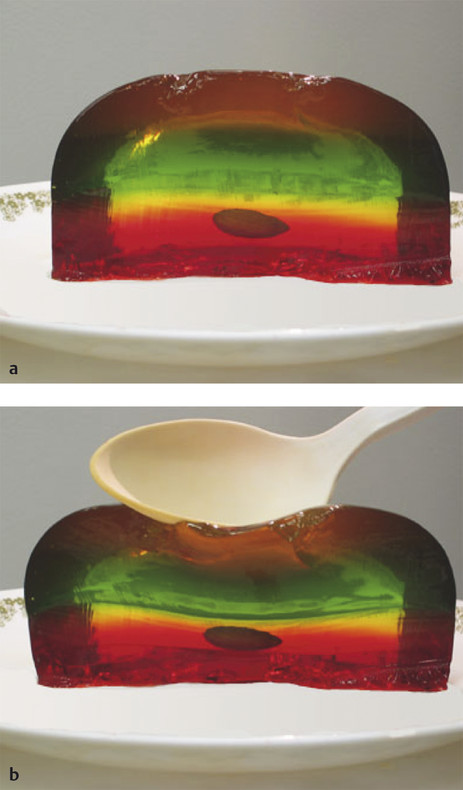
Fig. 2.1 (a,b) A simplistic model of the principal of strain elastography is to consider an almond in gelatin. If we apply a stress such as compressing the gelatin with a spoon, the gelatin changes shape because it is soft (more strain), whereas the almond does not change shape because it is stiff (less strain). The ultrasound strain system compares the frame-to-frame changes of tissue when the tissue is compressed/released. Tissues that deform the most are considered soft, whereas those that deform the least are considered stiff.
SE is performed on standard ultrasound equipment using specific software that evaluates the frame-to-frame differences in deformation in tissue when a force (stress) is applied. The force can be from patient movement (such as breathing, heartbeat) or external compression with rhythmic motion of the ultrasound transducer or acoustic radiation force impulse (ARFI) as the source of the movement.18 In SE the absolute strain (Young) modulus value (a numerical value quantifying the stiffness) cannot be calculated because the amount of the force cannot be accurately measured. The real-time SE image is displayed with a scale based on the relative strain (or stiffness) of the tissues within the FOV. Therefore, if the types of tissue in the FOV are different, a different scale may be used for the display map.
▶ Fig. 2.2 demonstrates a simplified explanation of how the mapping of SE data is performed on most systems. The boxes on the left represent tissue identified on B-mode imaging before the addition of any force. The boxes in the middle represent the size of the tissue on B-mode imaging after the compressive force. The tissues that do not change shape are very stiff, whereas those that are soft change size based on their relative stiffness. The strain elastography algorithm evaluates the relative changes in size of the tissues and assigns a color (or shade of gray) based on the distribution of the size changes. In our example in ▶ Fig. 2.2a, the tissue that does not change shape at all is color coded black because it is the stiffest of all the tissue being evaluated. The lower box changes the most and is therefore the softest and is color coded white. The tissue in between these extremes is given a shade of gray corresponding to the amount of change in the tissue; darker gray if stiffer and lighter gray if softer. However, if we did not include the stiffest tissue in ▶ Fig. 2.2a, different color coding of the other tissues would occur as in ▶ Fig. 2.2b. Note that the coloring of the first three tissues has changed because the second tissue is now the stiffest and therefore coded black. Thus the “dynamic range” of stiffness values changes depending on the tissues present in the FOV.
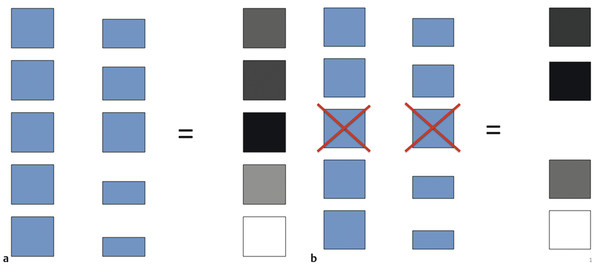
Fig. 2.2 The color-coding of the pixels in the elastogram is based on the changes that occur with the compression/release cycle. In the diagrams the boxes on the left depict different tissues within the field of view (FOV). When the compression is applied the boxes change shape based on their stiffness (center vertical column). The box that changes shape the most is color coded white, whereas the box that changes the least is color coded black. The boxes that change between these two extremes are color coded shades of gray based on the amount of change they experience (a). If the FOV is different and the stiffest tissue in (b) is not included the color mapping changes with the second box now the stiffest and therefore being color coded black. The dynamic range of the color coding is changed and the first and fourth tissues are now color coded with darker shades of gray.
Therefore if similar stiff tissues and soft tissues are included in each image acquisition a relatively constant color display will be obtained. In breast strain elastography, if a portion of the pectoralis muscle and some fat are included in the FOV, a more consistent color depiction of tissues between images will be obtained. The fat will be the softest tissue coding white and the pectoralis muscle will be the stiffest tissue (if a cancer is not present) coding black. The color scale (or dynamic range of stiffness values) will be fairly constant because the stiffness of fat and muscle are very constant between patients and within a patient. However, if a breast cancer is present within the FOV it will be the stiffest tissue and be color coded black with most other tissues being displayed as white or light gray.
The technique required to obtain the optimal images varies with the algorithm used by the manufacturer of the system.18 For SE the amount of external displacement needed varies depending on the algorithm used. With some systems very little if any manual compression/release is needed, with others a rhythmic compression/release cycle is required. With experience and practice the optimum compression/release technique for a specific system to obtain optimal image quality can be learned. Applying too large a compression/release cycle will result in image noise, whereas not applying enough will result in no image being obtained. Learning the “sweet spot” for the equipment being used is critical for optimal images and is discussed in detail in Chapter ▶ 3.
The algorithm used in SE requires that the strain changes be measured in a lesion that remains within the imaging plane. The same slice of the lesion needs to remain in the imaging plane during the entire compression/release cycle. Monitoring of the B-mode image to confirm the lesion is displaced only in depth (not in and out of plane) during scanning and moving only axially in the FOV will allow for optimal images. An organ cannot be surveyed with the displacement SE technique; scanning must be done in one stationary position.
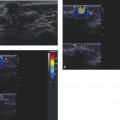
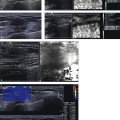
Results can be displayed in gray scale or with various color displays; preference is often determined by the user’s exposure to elastography and preference in interpretation. The display map preference is a postprocessing function, and on most equipment the map can be changed when the image is frozen. The default on many systems has the elastogram displayed over the gray scale B-mode image. Most systems display in a dual mode with a separate B-mode image also displayed. This helps in determining the location of the elastographic findings. However, if a gray scale map is chosen the background B-mode image in the elastogram should be turned off because the two superimposed gray scale images are difficult to interpret. This book uses a gray scale map with soft coded white and hard coded black without a superimposed B-mode image unless otherwise stated. It is important to remember that, even when using the color-coded SE a relative scale is displayed, which should not be confused with SWE where an absolute stiffness value is obtained and color coded on a per pixel basis. On SWE a lesion will have the same color (assuming the same color scale is used) regardless of the other tissues present in the FOV. On SE the lesion may appear a different color if the other tissues in the FOV are different.
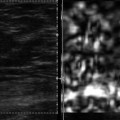
Because SE is a relative technique, a lesion may appear a different shade of gray (or color) depending on the other tissues in the FOV. For example, in a patient with normal dense breast tissue and fat, the fat will appear white (soft) because it is the softest tissue in the FOV. However, if only fat is in the FOV some of the fat will appear black (stiff) because it is the stiffest tissue in the FOV (▶ Fig. 2.3
Related posts:

Stay updated, free articles. Join our Telegram channel

Full access? Get Clinical Tree


