coordinate and pixel spacing, both given in millimeters. We denote the pixel positions in the patient coordinates as  . For sake of simplicity we also assume the feet-to-head, face-up (supine) orientation of the patient. The pixel gray values will be denoted as
  and we assume them to be in Hounsfield units.
Our approach is based on bone distribution signatures within slices. For a fixed slice at location  we are therefore first interested in a rough segmentation
  of the bones. Given the Hounsfield intensities
  , this can be achieved by an interval threshold, i.e., using two constants:
![$$\begin{aligned} \fancyscript{B}_{z} = \{\mathbf {p} = (p^x,p^y,p^z) \quad | \quad p^z = z \ \wedge \ g(\mathbf {p}) \in [400, 1050] \} \end{aligned}$$](/wp-content/uploads/2016/10/A331518_1_En_15_Chapter_Equ1.gif)
we are therefore first interested in a rough segmentation of the bones. Given the Hounsfield intensities , this can be achieved by an interval threshold, i.e., using two constants:(1)
3.1 Centroids and Deviations
The simplest features are based on the centroid of segmentations 

and on the length  of the associated standard deviation vector

Centroids  correlate with the spine reliably in the lumbar slices where pelvis, ribs, or head do not contribute to it.
(2)
of the associated standard deviation vector(3)
correlate with the spine reliably in the lumbar slices where pelvis, ribs, or head do not contribute to it.The lumbar part can be characterized by deviation lengths  related to size of a vertebra seen in an axial slice [9]. Values of
  larger than 40 mm indicate presence of non-vertebra bones.
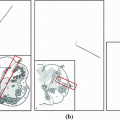
related to size of a vertebra seen in an axial slice [9]. Values of larger than 40 mm indicate presence of non-vertebra bones.Centroid refinement. While reliable in the lumbar area, the centroids  may drift remarkably from the spine if the pelvis or ribs contribute by their pixels (cf. Fig. 1).

may drift remarkably from the spine if the pelvis or ribs contribute by their pixels (cf. Fig. 1).Fig. 1
Examples showing centroids  (square), a circle of radius
  , the
, the  mm refinement window (rectangle), and refined center
  (star)
(square), a circle of radius , the mm refinement window (rectangle), and refined center (star)To avoid this we refine the centroids  within rectangular
  mm windows, asymmetrically spanned around them:

The size of the windows is set to be sufficiently big to accommodate any vertebra in an axial view [9] and to account for relative positions of the centroids and vertebrae in pelvis slices. The centroids  are refined to the center
  of bone pixels in this window:
within rectangular mm windows, asymmetrically spanned around them:(4)
are refined to the center of bone pixels in this window:(5)
3.2 Shape Histograms: AP Versus LR Distribution
To identify leg slices, we propose to discriminate slices with bone distributions dominant in the left-to-right direction and zero contributions in the anterior-posterior direction (see Fig. 2).
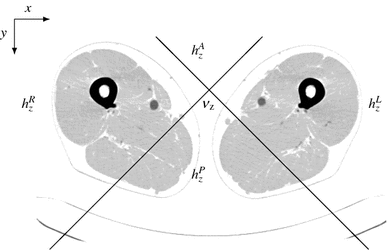

Fig. 2
Right, left, ante, and poste histogram bins centered at  overlaid over a negative of a CT slice at position
  showing legs and table
overlaid over a negative of a CT slice at position showing legs and tableFig. 3
An example CT scan in a frontal maximum intensity projection (MIP) (a), its histogram profile (b) and deviation profile (c)
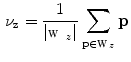
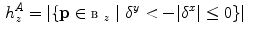
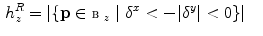
We construct 4-bin histograms located in the refined centers  . Putting
  we define the following four quantities:
 and a threshold to yield this:
Note that we exclude the posterior voxels  from (10) in order to ignore eventual contribution of a CT table.
 Models for Descriptive Patient-Specific Neuro-Anatomical Modeling: Towards a Digital Brainstem Atlas
 Radiological Grading of Spinal MRI
 Supervised Segmentation and Meshing of 3D Intervertebral Discs of the Lumbar Spine for Discectomy Simulation
 Vertebral Segmentation Using Part-Based Decomposition and Conditional Shape Models
 of Vertebrae on DXA Images Using Constrained Local Models with Random Forest Regression Voting
 Segmentation of the Thoracic and Lumbar Vertebrae


. Putting we define the following four quantities:(6)
(8)
and a threshold to yield this:(10)
from (10) in order to ignore eventual contribution of a CT table.3.3 Bone Profiles
In the previous section we have introduced two bone distribution descriptors, i.e. scalars  and
and  for every slice
  . Next we aggregate them into two 1D arrays indexed by
  and refer to as the bone profiles. A symmetric plot of bone profiles along the z-axis is shown in Fig. 3.
and for every slice . Next we aggregate them into two 1D arrays indexed by and refer to as the bone profiles. A symmetric plot of bone profiles along the z-axis is shown in Fig. 3.4 Applications to Spinal Column Localization
In this section we show how the bone profiles and the refined centers  can be used to bound the spinal column and to identify a reliable initialization seed for subsequent computations.
can be used to bound the spinal column and to identify a reliable initialization seed for subsequent computations.4.1 Discarding the Slices up to the Ischium
When dealing with spines, leg slices should be taken out of consideration. We observed that the first occurrence of vanishing  in the top-to-bottom order may correspond either to the bottom of sacrum or the bottom of the pelvis—the ischium (cf. Fig. 3b).
in the top-to-bottom order may correspond either to the bottom of sacrum or the bottom of the pelvis—the ischium (cf. Fig. 3b).In order to have a security margin between the spine and the slices to drop we suggest to identify ischium slices. We identify them by the first  mm long segment of zeros in the histogram profile, i.e. a sequence longer than the average distance from ischium to bottom of sacrum.
mm long segment of zeros in the histogram profile, i.e. a sequence longer than the average distance from ischium to bottom of sacrum.4.2 Seeding a Spinal Canal Search
Algorithms using incremental/propagated search need to be initialized [5]. To obtain a reliable seed point near the spinal canal we consider the refined center  in a slice with minimal deviation
  (cf. Eq. 11). In this case no other bones except for vertebra contribute to the signatures and the point
  yields an estimate of the spinal canal. Such slices are predominantly found either in the lumbar area between pelvis and the first rib (cf. Fig. 3c) or in the neck area.

in a slice with minimal deviation (cf. Eq. 11). In this case no other bones except for vertebra contribute to the signatures and the point yields an estimate of the spinal canal. Such slices are predominantly found either in the lumbar area between pelvis and the first rib (cf. Fig. 3c) or in the neck area.(11)
4.3 Bounding the Spinal Column
Machine learning methods need to compute a vector of features at every voxel. Reducing the amount of voxels to be classified to a minimum can therefore significantly speed up such algorithms. After the leg slices have been discarded we wish to further prune the space by setting coronal and sagittal bounding planes.
For healthy spines the previously found seed  could be reused to set up a bounding box of a predefined size. Such an approach would, however, fail for scolioses and other spine curvature related disorders.
could be reused to set up a bounding box of a predefined size. Such an approach would, however, fail for scolioses and other spine curvature related disorders.To deal with such cases we derive coronal and sagittal planes from the bounding box of the  mm windows (cf. Eq. 4) spanned symmetrically around a subset of centers
  . The refined centers
  are first sorted by a drift reliability
  =
=  from the original centroids
  : the smaller the drift the more reliable the center. A fraction of sorted
  involved in spanning bounding planes balances the tightness of bounding around spinal column and the data reduction. It is the last and the only free parameter in our method.
mm windows (cf. Eq. 4) spanned symmetrically around a subset of centers . The refined centers are first sorted by a drift reliability = from the original centroids : the smaller the drift the more reliable the center. A fraction of sorted involved in spanning bounding planes balances the tightness of bounding around spinal column and the data reduction. It is the last and the only free parameter in our method.Related posts:
Models for Descriptive Patient-Specific Neuro-Anatomical Modeling: Towards a Digital Brainstem Atlas
Supervised Segmentation and Meshing of 3D Intervertebral Discs of the Lumbar Spine for Discectomy Simulation
Vertebral Segmentation Using Part-Based Decomposition and Conditional Shape Models
Stay updated, free articles. Join our Telegram channel
Full access? Get Clinical Tree
