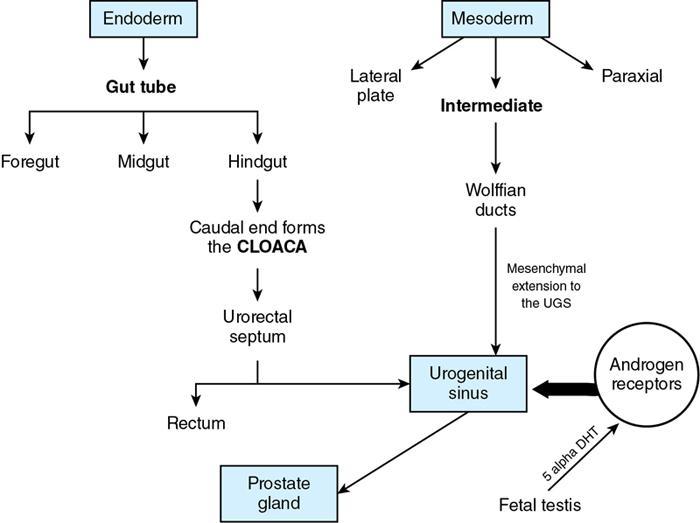
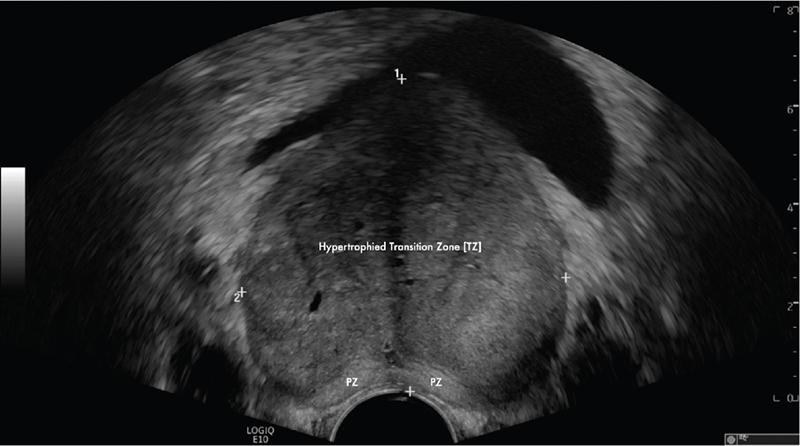
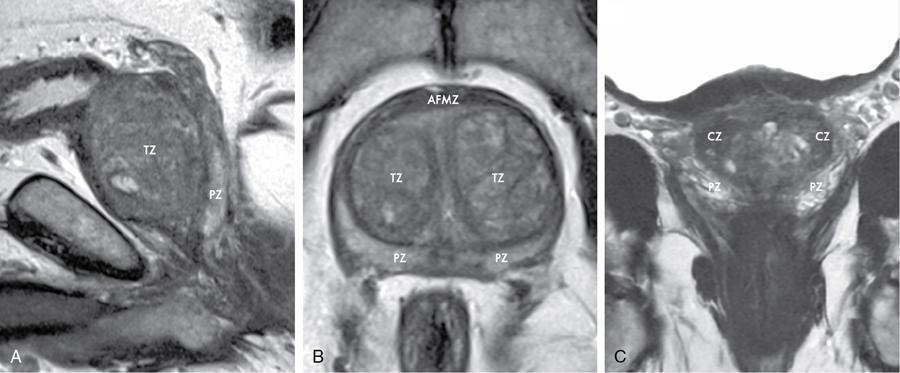
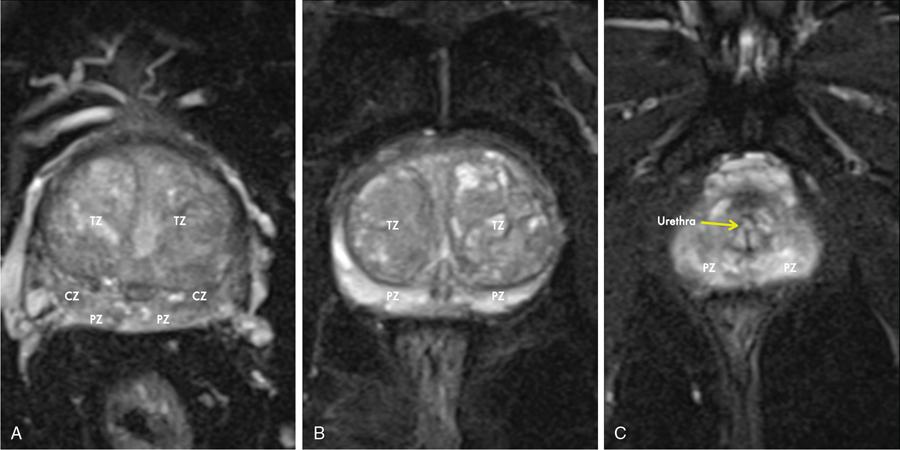
Karthik Ganesan, Disha Lokhandwala, Ujjwal Bhure, Jay Mehta Morphogenesis of the male genitourinary system is governed by the coherent interaction of three units, namely the Wolffian duct, urogenital sinus and foetal gonads. The Wolffian ducts are the embryonic precursors of the male internal genitalia, arising in the anterior intermediate mesoderm at 4 weeks of gestation. They elongate as a cord of cells that caudally extend to the urogenital sinus. Between 5 and 8 weeks of gestation, the urorectal septum divides the cloaca into a ventral compartment, which forms the urogenital sinus, and a dorsal compartment, which forms the rectum. The gonads form as epithelial thickenings on the ventromedial surface of the mesonephros and produce testosterone at 8 weeks of gestation, reaching a peak at 10–15 weeks. Under the effect of testosterone produced by the foetal testis, the prostate anlage forms at the tenth week of gestation. Precursor of the anlage begins with proliferation of solid epithelial buds from the epithelium of the urogenital septum into the adjoining mesenchyme in response to interaction of 5α-dihydrotestosterone with mesenchymal androgen receptors. As growth progresses, solid cords of epithelial cells are formed, growing into the mesenchyme in a specific three-dimensional arrangement (establishes the lobar divisions of the prostate gland). These solid cords develop a central lumen at birth and are lined by a layer of flat basal epithelium and a luminal layer of tall columnar secretory epithelium. Mesenchymal component forms the stroma, which has a large proportion of smooth muscle. Postnatally, the epithelial cords continue to arborize till puberty without any change in volume or glandular architecture. Although the foetal prostate has been described to have a histologically distinct peripheral zone (PZ) as early as 12 weeks of gestation, the mature zonal anatomy develops in concordance with the androgen surge at puberty. The most commonly utilized ultrasonographic technique for the evaluation of the prostate is via a suprapubic approach. The abdominal transducers used in this approach are relatively low frequency and while it offers the advantage of greater depth of penetration without intracavitary probe insertion; however, it does not depict the zonal anatomy and its chief application lies in volume estimation. Hence, transrectal ultrasonography (TRUS) completely outweighs the transabdominal approach in terms of depicting zonal anatomy, visualizing and localizing small lesions, demonstrating vascularity and performing biopsies. TRUS is performed using high frequency transducers (5–7.5 MHz) to optimize soft tissue resolution. An enema is administered 1 h prior to the examination to clear the field of insonation. Patient is positioned in left lateral decubitus, with knees bent toward the chest and ideally a digital rectal examination (DRE) is conducted prior to probe insertion. The transducer is first draped with a sterile barrier and lubricated, After insertion, the barrier is filled with 40–50 cc of water, making sure that no air enters. On completion, water is aspirated and the probe is withdrawn. The gland is initially scanned in the axial plane from the base to the apex, beginning at the level of the seminal vesicles, and the probe is gradually withdrawn to view the entire glandular parenchyma in axial sections up to its caudal aspect. This approach allows a cursory evaluation of glandular symmetry as both halves of the prostate can be evaluated simultaneously. Subsequently, sagittal views are acquired by rotating the probe across the transverse span of the gland, demonstrating the seminal vesicles, midline gland (visualizing both the apex and the base), with sequential scanning up to the contralateral margin of the gland. Sonographically, the prostatic capsule is seen as a smooth well-delineated, hyperechoic structure. With the newer ultrasound systems, the zonal anatomy can be delineated by TRUS; PZ appears echogenic relative to the central zone (CZ) and the transition zone (TZ), which are hypoechoic in juxtaposition (Fig. 11.12.1). Anterolaterally, the preprostatic venous plexuses are seen as anechoic tubular structures with intervening echogenic preprostatic fatty tissue. Glandular volume is estimated using an ellipsoid formula by obtaining the maximum anteroposterior, superoinferior and transverse dimensions and multiplying their product by π/6. Colour Doppler imaging is utilized to illustrate vascularity, as majority of the normal prostatic tissue (excluding the neurovascular bundles [NVBs] and pericapsular and periurethral regions) has symmetrical but sparse flow and an increased microvessel density raises the suspicion of prostatic carcinoma. However, the appearances of prostatic carcinoma can be variable on colour Doppler imaging, ranging from focal increase in vascularity around a nodule to an asymmetric increase in size and number of vessels on the affected side and conventional Doppler has found to elevate specificity by about 5%–10%. Additionally, Doppler imaging has also demonstrated some utility in distinguishing fibrotic tissue from local recurrence. However, vessels supplying cancerous tissue are of the order of 10–50 μm, which is well below the 1-mm resolution limit of conventional Doppler techniques. Contrast-enhanced colour Doppler imaging overcomes this limitation and facilitates imaging of microvessels, using intravenously administered microbubbles (less than 10 μm diameter) of an inert gas (sulphur hexafluoride) with a lipid or galactose shell, allowing quantification of blood flow in the cancerous microvessels. Additionally, these microbubbles act as vascular tracers and by monitoring the passage of a bolus injection through the tissue of interest, time–intensity curves are created. This permits the formulation of functional indices, including bolus arrival time, time to peak intensity, area under the curve and wash-in/wash-out curves. These indices can further extrapolate functional images, on a pixel-by-pixel basis, overlaid on grey-scale images. Quantitative methods to demonstrate perfusion are based on the destruction of microbubbles by high-power ultrasound pulses, and then observing the rate of microbubble replenishment in the field of interest to calculate flow rate. Halpern et al. utilized contrast-enhanced ultrasound and intermittent harmonic imaging with power Doppler, and exhibited an increment in sensitivity from 38% to 65% with a specificity of 80% in prostate cancer detection. Cadence contrast pulse sequencing (CPS) is a low-power multipulse imaging technique utilizing pulses with variable amplitudes and phases followed by a summation of the resulting echoes, permitting tissue suppression, allowing detection of even a small amount of contrast agents retained in the tissues. Real time elastosonography evaluates and quantifies tissue stiffness (Young’s modulus) by measuring strain under an applied stress (transducer compression) and maps areas of variable stiffness in colour-coded and grey-scale images simultaneously and shows potential in improving prostatic carcinoma detection. In a study comparing elastography and T2-weighted (T2-w) endorectal magnetic resonance imaging (MRI), similar sensitivity rates and negative predictive values (NPVs) were attained in the detection of prostatic carcinoma. Prostate gland is an inverted cone-shaped subperitoneal retropubic gland, with its base located rostrally and apex located caudally. The base is attached to the bladder neck and the apex sits on the urogenital diaphragm and abuts the medial surface of the levator ani muscles, namely the pubourethralis portion, which is separated from the inferolateral surfaces of the gland on either side by the prostatic venous plexus. Normal prostate gland measures approximately 4 × 3 × 3 cm, 15–20 g in weight, with a median volume of 11.5 mL (range, 1.6–20.6) in patients between 21 and 25 years and a median volume of 39.6 mL (range, 13–169.8) in patients between 38 and 83 years. The first comprehensive publication describing the anatomical subdivision of the prostate gland was in 1912 by Lowsley, based entirely on the embryonic glandular morphology at a series of gestational age groups. The budding prostatic ducts were seen to proliferate in five distinct clusters from the primitive urogenital sinus, which formed the basis of its lobar subdivision. It was divided into a ventral lobe (anterior to the urethra), two lateral lobes (lateral to the ejaculatory ducts), a posterior lobe (between the ejaculatory ducts) and a middle lobe (above the ejaculatory ducts). This classification had several shortcomings, the foremost being inclusion of only the embryonic prostate during its conception. Frank highlighted these aspects in 1953 and stated that no definite lobar boundaries exist in the adult prostate and further criticized the exclusion of periurethral glands (inner gland), identifying them as the sole site of origin of benign prostatic hyperplasia (BPH). The chief drawback of all research prior to 1968 was the lack of a concrete histological basis to support the seemingly arbitrary subdivision. McNeal was the first to ascertain histological heterogeneity within the glandular tissue and used it as the basis of his well-acclaimed prostatic zonal classification. The zonal anatomy of the prostate gland conceived by McNeal divided the gland into four distinct zones, namely the TZ, PZ, anterior fibromuscular zone (AFMZ) and the CZ (Fig. 11.12.2). McNeal used the plane of the distal urethra to describe the zonal relationships and divide the gland broadly into three parts, namely the base, midgland and the apex (Fig. 11.12.3). The improved understanding of the prostate anatomy coincided with the development of MRI in the late 1980s, which could depict the zonal anatomy, unlike ultrasonography (USG) or computed tomography (CT). Patterns of ductal growth and radiation from the prostatic urethra form the basis of the zonal anatomy of the gland. Ducts arising from the proximal urethral segment grow towards the urinary bladder. Tiny ducts which are confined by the preprostatic sphincter form the small periurethral gland, whereas ducts which develop distal to the lower border of the preprostatic sphincter extend laterally and then anteromedially to form the TZ. Ducts arising from the verumontanum in the vicinity of the ejaculatory duct orifices and are directed towards the base along the course of the ejaculatory ducts form the CZ, whereas ducts which arise from the lateral recess of the posterior urethral wall of the verumontanum and distal urethra radiate laterally to form the PZ and rostrally posterior to the CZ at the base of the gland. PZ is the dominant glandular component of the prostate gland comprising approximately 70% of the glandular tissue. On T2-w images, the normal PZ has a high T2 signal intensity (SI), owing to the abundant ductal and acinar elements with sparsely interwoven smooth muscle, and can broadly divided into three sections as per the sector map in Prostate Imaging Reporting and Data System Version 2.1 (PI-RADS v2.1), namely posterior medial, posterior lateral and anterior sections (Fig. 11.12.4). At the apex, the anterior sections have a horn-like morphology, curving anteromedially, to nearly encircle the urethra and abut the AFMZ. At the midgland level, the PZ comprises the posterior, both lateral and the anterolateral parts of the gland. At the base, the PZ is located posterior and superior to the CZ and TZ. CZ is an ovoid-shaped structure at the base of the gland, comprising approximately 25% of the glandular tissue, with its apex located at the verumontanum, surrounding the ejaculatory ducts. Beyond age 35, volume of the CZ starts to gradually diminish, as well as the CZ is compressed by the enlarged TZ. In the initial MR studies of prostate, the CZ could not be easily delineated from the TZ. Vargas et al. demonstrated in a population with a mean age of 60 years undergoing MR for prostate cancer assessment, the CZ was visible in 81%–84% of patients. Hansford et al. identified the CZ in 92%–93% of patients on T2-w images and 78%–88% of patients on apparent diffusion coefficient (ADC) maps. Histologically, substantial differences exist between the CZ and PZ, which reflect in the differential appearance on T2-w imaging. These differences are probably attributable to the differential origin, as the CZ is derived from the Wolffian duct, and the PZ and TZ are derived from the urogenital sinus. In the CZ, the acini appear larger and more irregular, with numerous epithelial covered ridges or septa project from the walls of the acini into the lumen, forming a characteristic Roman bridge architecture and intraglandular lacuna, with a prominent basal layer, crowded epithelial cells with granular eosinophilic cytoplasm, decreased luminal fluid and compact stroma. PI-RADS v2 has discouraged the use of the term central gland, as it is not reflective of zonal anatomy or reported on pathologic specimens. CZ demonstrates homogeneously low signal on the T2-w images and ADC maps and can, therefore, mimic prostate cancers. CZ is best identified on the coronal plane T2-w images paralleling the plane of the distal urethra, and appears as a symmetric paramedic paired structures surrounding the ejaculatory ducts from the base of the gland to the verumontanum (Fig. 11.12.5). TZ comprises approximately 5% of the glandular tissue of the prostate. On T2-w images, the TZ normally appears as a homogeneously hypointense structure surrounding the proximal urethra at the base and the midgland level; however, it can also demonstrate inconsistent SI, depending on the relative proportion of glandular and stromal elements (Fig. 11.12.6). Glandular hyperplasia produces higher SI (dominance of acinar elements and secretions), while stromal hyperplasia exhibits lower SI (dominance of muscular and fibrous elements). The TZ is easily demarcated from the PZ by a thick homogeneously low T2 signal surgical capsule, which becomes pronounced in BPH. With increasing age, the TZ demonstrates variegated signal on the T2-w images and ADC maps, due to differential growth of the stromal and glandular elements. AFMZ is a nonglandular muscular tissue that drapes the anterior surface of the gland, superiorly blending into the smooth muscles of the bladder neck and inferiorly extending to the prostatic urethra at the glandular apex. AFMZ is comprised of smooth muscles, which blends with the smooth muscle fibres surrounding the urethra, and rostrally merges with the bladder neck and preprostatic sphincter. High smooth muscle content of the AFMZ is responsible for the MR signature, where in it appears markedly hypointense on the T2-w images and ADC maps, and hypoenhances on the multiphase contrast series (Fig. 11.12.7). With the advancing age, temporal reduction in the size of the AFMZ is noted due to the compressive effects of the BPH. Capsule surrounds the prostate gland, anteriorly merging with the AFMZ anteriorly. Two discrete defects are identified in the prostate capsule, at the base of gland where the ejaculatory ducts enter the prostate and at the apex where in the stroma blends with the sphincter. The capsule is perforated along the anterolateral aspect by multiple vessels and nerves. The capsule appears as a thin dark rim surrounding the gland on the T2-w images and may reveal delayed enhancement on the postcontrast images (Fig. 11.12.8). Primary goal of radical prostatectomy (RP) is to achieve oncologic efficacy, both in terms of short-term and long-term clinical outcomes. However, as the majority of prostate cancers have an indolent clinical course, preservation of function in terms of continence and potency is equally important, and the key to this is a keen understanding of the fascial anatomy and neuroanatomy of the prostate gland. Fascial anatomy of the prostate gland is anatomically complex and poorly understood, and a thorough understanding of the interfacial planes is crucial to avoid mechanical or thermal injury to the NVBs. Periprostatic fascia comprises of a condensation of layers of connective tissue that encapsulate the gland and suspend it from anterior pelvic wall via puboprostatic ligaments. Laterally, the visceral and parietal endopelvic fascial layers fuse to form the fascial tendinous arch. Periprostatic fascia covers the prostate gland and capsule, comprises of two fascial layers, including an inner layer (prostatic fascia) and an outer layer (levator ani fascia), with thin interfascial planes separating these fascia from one another and the prostate capsule. Posteriorly, a continuous fascial layer known as Denonvilliers’ fascia covers the prostate and seminal vesicles. Distribution of periprostatic nerves is highly variable, with growing evidence of nerves both along the dorsolateral and ventrolateral surfaces of the prostate gland. Most of the periprostatic nerves are found posterolaterally; however, a significant portion of the nerves are located ventrally as seen by Eichelberg et al. (21.5%–28.5%) and Lee et al. (19.9%–22.8%). Although anatomic studies have confirmed the presence of ventrolateral periprostatic nerves, the exact clinical importance and functionality of these nerve fibres has not been proven. The cavernous nerves are situated posterolaterally and are the basis of nerve-sparing RP procedure proposed by Walsh and Donker. Unlike the initial theory of Walsh and Donker, few papers have proposed that the nerves are diffusely scattered along the surface of the gland in the form of a curtain or spray-like arrangement without clear bundle formation. Kourambas et al. assessed the precise relationship of the NVBs and cavernous nerves to Denonvilliers’ fascia and proposed that the nerves were not restricted posterolaterally, but were rather diffusely scattered within the fascia extending up to the midline (Lunacek et al., Takenaka et al.). On the basis of more diffuse arrangement of the periprostatic nerves, surgical techniques have been modified, resulting in a more anterior dissection called the ‘curtain dissection technique’ or alternatively a ‘superveil’ technique to preserve the NVBs within the lateral prostatic fascia. The NVB lies within areolar connective tissue surrounding the gland, which separates the capsule from the periprostatic fascia and provides a plane of dissection during nerve-sparing prostatectomy. Prostate gland is supplied and drained by periprostatic vessels, which also supply and drain the penis. Arterial supply of the gland is highly variable and is typically from branches of the internal pudendal artery, which course inferior to the gland prior to supplying the penile cavernosal tissue. Off late, these vessels have gained prominence in radiation-induced erectile dysfunction (ED) (potential vasculopathy), which have led to the development of newer vessel-sparing radiotherapy techniques. Further, with the advent of prostate arterial embolization in benign prostatic hypertrophy (BPH), the vascular supply of the gland is becoming increasingly vital to understand. Gland drains into the obturator, internal iliac, external iliac, common iliac and presacral lymph nodes. Dorsal venous complex is identified immediately ventral to the gland and also drains the penis. Periprostatic nodes are uncommon, are usually discovered near the base of the gland, and are only occasionally seen on MRI. Urethra is the principal anatomic reference point in the prostate gland. Urethra can be divided into a proximal segment and a distal segment, the point of differentiation being located at the verumontanum wherein the urethra makes an approximately 35-degree angulation. The angulation is highly variable and is further affected by the growth of the TZ. On MRI, the distal segment is more conspicuous vis-à-vis the proximal segment and appears a hyperintense core surrounded by a low signal rim on T2-w images. Preprostatic sphincter encases the proximal urethra from the base of the gland to the base of the verumontanum and merges with the AFMZ anteriorly. Verumontanum appears hyperintense on the T2-w images, lies within the distal urethral segment, beyond which the distal urethral segment is partially encircled by striated muscles which blend with the external sphincter beyond the apex of the gland. External sphincter is located distal to the apex is incomplete posteriorly and is anchored into the PZ and surrounds the membranous urethra. Damage to the external sphincter during RP or transurethral resection of the prostate (TURP) may lead to urinary incontinence. Seminal vesicles are paired structures identified posterosuperior to the base of the prostate gland, which appear as convoluted fluid-filled structures. Due to the high fluid content within the normal seminal vesicles, these structures appear as paired structures with intermediate signal walls surrounding a hyperintense core on T2-w images (Fig. 11.12.9). Vas deferens are paired structures located rostral to the base of the gland and anteromedial to the seminal vesicles and appear as cord-like structures with variable signal on the T2-w images. Duct of the seminal vesicle and vas deferens unite in the posterior aspect of the base of the gland to form the ejaculatory duct, which courses caudally to the verumontanum along the plane of the distal urethra, and drain into the orifices in the midconvexity of the verumontanum. Prostate-specific antigen (PSA) is a serine protease, secreted by epithelial cells of the prostate gland and has been found in normal, benign and malignant prostatic tissues. Traces of PSA have also been isolated from endometrial tissue, breast tissue, adrenal neoplasms and renal cell carcinomas; however, for all clinical purposes, PSA is considered as an organ-specific biomarker. Papsidero first demonstrated and quantified serum PSA, which steered the epoch of prostate cancer screening and early detection of prostatic carcinoma. Subsequent studies showed that PSA screening often led to overdiagnosis of low-grade prostate cancers, with no survival difference between the PSA screened and nonscreened groups. Additionally, PSA levels were found to be elevated in a spectrum of prostatic pathologies apart from carcinoma, including prostatitis and benign hyperplasia. The likelihood of overdiagnosis coupled with the lack of specificity set grounds for the longstanding PSA controversy. Did the benefits of screening outweigh the risks of overtreatment? To elevate the specificity of serum PSA testing, a plethora of indices were devised, including free PSA and total PSA, free-to-total PSA (f/t PSA) ratio, age-specific PSA, PSA velocity (PSA-V) and PSA density (PSAD). Serum PSA exists in three forms; the major form (approximately 75%) is bound to alpha-1-antichymotrypsin, followed by free PSA (constituting 5%–50% of serum PSA). The third form (PSA bound to alpha-2-macroglobulin) is not clinically relevant and cannot be detected by any commercial test. A study by Stenman et al. established that a higher proportion of bound PSA and hence a lower ratio of f/t PSA is associated with prostate cancer. Conversely, free PSA can be utilized during follow-up for men with an initial negative biopsy result, wherein declining free PSA with a persistently elevated total PSA would raise suspicion of a neoplastic aetiology. As per the ACS guidelines (Table 11.12.1) for early detection of prostate cancer, men with a 10-year life expectancy or higher should have the opportunity to make an informed (regarding benefits, risks and uncertainties associated with PSA screening) decision for serum PSA testing, with or without DRE. For those who choose to undergo PSA screening, subsequent screening interval is determined on the basis of baseline PSA value. For values below 2.5 ng/mL, screening interval can be extended to 2 years and for PSA between 2.5 ng/mL and 4 ng/mL, an individualized approach is adopted following risk assessment to recommend either further referral or screening on a yearly basis. A PSA level of 4 ng/mL or higher warrants referral for further evaluation or biopsy, for men at average risk for prostate cancer. Although age-specific PSA (Table 11.12.2) is not a component of the ACS guidelines, it is considered as a beneficial parameter in determining the need for biopsy. As there is an expected rise in PSA values with age, setting a lower cut-off value for younger men would increase the sensitivity of detecting organ confined cancers and a higher value in older men would increase specificity. aThere is no proven rationale for using a single PSA-V threshold value. PSA screening guidelines for treated localized prostate cancers are variable and the definition of biochemical (PSA) recurrence remains debatable. Due to this inconsistency, the Prostate Cancer Guidelines Update Panel recommended a standard definition for biochemical recurrence (BCR) after RP and set a cut-off serum PSA (acquired between 6 weeks and 3 months of surgery) of 0.2 ng/mL or greater, along with a second confirmatory PSA. While there is a significant fall in PSA values after RP and a single raised PSA is sufficient to raise suspicion of recurrence, postradiotherapy recurrence requires a rising trend rather than a single cut-off value. The ASTRO Consensus Panel defined postradiotherapy prostate cancer recurrence as three consecutive raises in PSA values after a baseline has been reached. A hiatus in this definition was that no specific time interval between consecutive increases in PSA was determined. In addition to its utility as a screening tool, PSA is also a good prognosticator when used in conjunction with biopsy Gleason score and clinical T-stage, and several pretreatment prostate cancer risk stratification systems are based on these indices. D’Amico et al. proposed a three-group risk stratification system in 1998, which categorized nonmetastatic (M0) carcinomas as low risk, intermediate risk and high risk. Low-risk prostate cancer was defined as 1992 AJCC T1/T2a, PSA ≤10 ng/mL and Gleason score ≤6. Intermediate-risk prostate cancer was defined as 1992 AJCC T2b, and/or PSA 10–20 ng/mL and/or Gleason 7 disease. High-risk disease included any one of the following: 1992 AJCC ≥T2c, PSA >20 ng/mL or Gleason 8–10 disease. In 2001, the GUROC published the results of a consensus meeting which categorized the groups as follows: low risk – 1997 AJCC T1–T2a, PSA ≤10 ng/mL and Gleason ≤6; intermediate risk – 1997 AJCC T1–T2, PSA ≤20 ng/mL and Gleason ≤7 not otherwise low risk and high risk – 1997 AJCC T3–T4 or PSA >20 ng/mL or Gleason 8–10. In due course, newer classification systems have been developed (Table 11.12.3), including the National Comprehensive Cancer Network (NCCN, USA), National Institute for Health and Clinical Excellence (NICE, UK), European Society of Medical Oncology (ESMO), American Urological Association (AUA) and the European Association of Urology (EAU). The NCCN guidelines also incorporate very low-risk (T1c, and Gleason score ≤6, PSA ≤10 ng/mL, <3 positive biopsy cores each ≤50% involved and PSAD of <0.15 ng/mL/g) and very high-risk (T3b–T4) categories. AUA, American Urological Association; EAU, European Association of Urology; GUROC, Genitourinary Radiation Oncologists of Canada; NICE, National Institute for Health and Clinical Excellence; CAPSURE, Cancer of the Prostate Strategic Urologic Research Endeavour; NCCN, National Comprehensive Cancer Network; ESMO, European Association of Urology; T, T-stage; GS, Gleason score; PSA, prostate-specific antigen. Note: Use of the 1997 TNM staging system (T2a one lobe involvement, T2b two lobes involvement, no T2c category). PSA, DRE and TRUS form the diagnostic triad for prostatic carcinoma. It has been well established that manipulations of the prostate gland, including prostatic massage, cystoscopy and perineal biopsy cause a potential increase in serum PSA levels. This raised the question of TRUS affecting PSA levels and it was found to cause a very small rise in PSA only in patients with prostatitis. The effect of DRE on serum PSA levels is also controversial, while some studies found a transient increase in PSA, others found no significant rise in PSA levels after DRE. Therefore, it is advisable to obtain blood samples for PSA testing either prior to DRE and TRUS or after at least 7 days. PSA-V refers to the change in PSA over time using serial measurements. Ideally, at least three consecutive measurements over at least 18–24 months should be used. Carter et al. first defined PSA-V and found that a value of 0.75 ng/mL per year or greater was indicative of carcinoma with a high sensitivity and specificity. Consequently, several studies disproved a definite relationship between PSA-V and prostate cancer, stating that there was no rationale behind a single threshold value for PSA-V. Further, it was found that calculating PSA-V was arduous and while elevated PSA values on serial examinations should raise alarm, there was no added benefit of formally calculating PSA-V. As per NCCN guidelines, the PSA-V cut-off should be based on the initial PSA value with a PSA-V of 0.35 ng/mL/y, when the PSA is ≤2.5 ng/mL and 0.75 ng/mL/y, when the PSA is 4–10 ng/mL PSAD was developed in order to correlate prostate volume and PSA values. The basis of PSAD was that cancer cells produce more PSA per unit volume than normal cells. It is calculated as PSA value divided by the prostate volume as determined by TRUS. This reliance on TRUS leads to interobserver variability and hence PSAD values would differ with the performing sonologist. The chief utility of PSAD is in the diagnostic grey zone of PSA values between 4 and 10 ng/mL and the most commonly used cut-off value is 0.15 ng/mL/cc. However, more recent studies have shown that a value of 0.08 ng/mL/cc has an NPV of 95% in predicting prostate cancer. Additionally, PSAD in conjunction with MRI (PI-RADS score) has proved to be a reliable prognosticator for Gleason score upgrading. The most significant application being avoiding unnecessary biopsies as PI-RADS scores of 1–3 along with PSAD values <0.15 ng/mL/cc showed no Gleason score upgrading on repeat biopsies. In summary, most guidelines recommend shared decision-making for screening of prostate cancer. Limited testing should be conducted in men with low PSA values and a lower life expectancy. The aim should be to overcome challenges posed by the inherent nonspecific nature of serum PSA and reduce superfluous testing, unwarranted biopsies and overdiagnosis. Reliance on parameters like PSA-V that do not have a proven scientific basis is avoidable. Whereas applications of PSA like PSAD along with MRI can greatly reduce patient burden by avoiding follow-up biopsies. Lastly, PSA has no role in assignment of a PI-RADS category, which is based on multiparametric MRI (mpMRI) findings alone. Several ‘novel biomarkers’ are now being developed which are more specific in detecting high-grade prostatic carcinomas. Other human kallikrein proteins have been identified, as prostate cancer biomarkers, of which, human kallikrein 2 (hK2) has shown a high specificity. While hK2 and PSA have an overlapping primary structure, malignant cells express hK2 to a higher degree than benign epithelial cells, particularly in aggressive cancers. Engrailed-2 (EN2) is an HOX gene family transcription factor seen exclusively in malignant prostate tissue, with a reported sensitivity and specificity of 66% and 88%, respectively. Annexin A3 is a calcium-binding protein measured in urine samples following prostatic massage, potentially reducing unnecessary biopsy in men with a PSA of 2–10 ng/mL. However, extensive prospective evaluation of these biomarkers is necessary to replace PSA testing in clinical practice. Positron emission tomography (PET)/CT has evolved over the last two decades to make a paradigm shift in the field of imaging, moving from morphological imaging to molecular level and completely changing the approach to how we view the disease. Though the main workhorse tracer in the field of PET/CT is 18-fluorine-fluorodeoxyglucose (18F-FDG), it has limitations with regard to prostate cancer, especially in indolent or well-differentiated ones. However, that void has been filled up by the new kid on the block and that is prostate-specific membrane antigen (PSMA)-based radiotracer. PSMA is a type II transmembrane protein with intracellular (19 amino acids), transmembrane (24 amino acids) and extracellular (707 amino acids) domains, which functions biochemically as a glutamate carboxypeptidase. After a ligand binds to PSMA, internalization occurs and it is either retained in lysosomal compartments or released into the cytoplasm. PSMA expression and localization in the normal human prostate is associated with cytoplasm and apical side of the epithelium surrounding prostatic ducts but not basal epithelium and neuroendocrine or stromal cells. Neoplastic transformation of prostate tissue results in the transfer of PSMA from the apical membrane to the luminal surface of the ducts. PSMA is an ideal target for molecular imaging of prostate cancer as its expression is significantly upregulated in prostatic carcinoma cells compared to benign prostatic tissue, in density (100 to 1000 times) as well as activity (8 to 10 times). PSMA expression increases with increase in Gleason score, stage and grade of tumour, with further increased expression with transition to androgen-independent/castration-resistant prostate cancer. PSMA-binding analogues, because of their high sensitivity and specificity, possess precise imaging characteristics required for critical decisions in the management of prostate cancer (PCa). The most commonly used PSMA radiotracer is 68Gallium-PSMA-11, followed by 18F-PSMA. The availability of 18F-labelled PSMA radiopharmaceutical has helped to advance the reach of PSMA PET imaging to wider locations owing to higher available amount of the radiotracer due to its production from a cyclotron, compared to 68Ga-PSMA which is eluted from individual in-house generator. Additional benefit is accrued with excellent image quality owing to optimized radiotracer doses, higher imaging statistics and favourable decay properties of 18F radioisotope. The normal physiological biodistribution of PSMA-based radiotracers is seen in lacrimal and salivary glands, liver, spleen, kidneys and intestine. Physiological activity is also seen in celiac and cervicothoracic ganglia. Unbound PSMA radiotracer is excreted by the kidneys into the urinary bladder. PSMA PET/CT has established roles of varying degrees in the imaging of different aspects of prostate cancer including primary diagnosis, staging, BCR after primary prostate cancer treatment (prostatectomy), identification and significance of oligometastasis, restaging and treatment response assessment and monitoring. PSMA PET/CT is useful at the stage of diagnosis in that subset of patients with tumour-negative biopsy samples, by contributing the useful molecular information to mpMRI, helping to precisely delineate suspicious lesions for targeted biopsies. In intermediate-risk to high-risk primary prostate cancer patients, PSMA-based imaging has shown improvement in detection of metastatic disease compared to the CT and mpMRI, which has led to reduced demand and dependence on additional cross-sectional imaging or bone scintigraphy. Furthermore, PSMA PET/CT has also established its clear advantage over conventional imaging in patients with biochemically recurrent prostate cancer with improved and increased detection of metastatic sites even at low serum PSA values. As it happens in cancer, biopsy is the standard of diagnosis and likewise in PCa, it is the multicore biopsy, which is the gold standard. However, because of its size, location, approach and sensitive and delicate nature, yield and accuracy can often be restricted, especially in inexperienced hands. The diagnostic yield of biopsy can go down as low as 40% and false negative (FN) rate can climb as high as 25%–30%. PSMA overexpression follows high-grade PCa cells and increases with Gleason score. In normal prostate tissue, PSMA to PSA ratio is about 1, which decreases in BPH, increases in primary PCa cells, further increases with intratumoural angiogenesis, higher in metastatic lesions than in primary PCa cells and further upregulated in castration-resistant situation. In a study by Litwin and Tan in 2017, the FN rate of multicore biopsy was around 21%–28% and about 15% of the cases were undergraded vis-à-vis final prostatectomy results. While the diagnostic accuracy of random multicore biopsy was around 76.3%, that of 68Ga-PSMA PET/CT was upward in the range of 85.5%. The role of PSMA PET/CT in the primary/initial diagnosis of prostate cancer is generally limited to clinically intermediate-risk to high-risk patients with negative biopsy or reluctance to biopsy or noncooperation or nonfeasibility and for confirmation and staging in clinically high-risk patients. In low-risk patients, metastatic spread is very unlikely and hence it is a relative indication at the time of initial diagnosis in low-risk patients. And, its role in screening is variable and debatable (Fig. 11.12.10). Staging is crucial as it has considerable influence on deciding further line of management and treatment choices, which includes RP, radiotherapy or palliative systemic treatment, deciding on the extent of the pelvic nodal dissection during surgery, planning the radiotherapy field and consideration of multimodal therapy. Accurate staging helps to make the most appropriate choice of treatment modality (Fig. 11.12.11). In a meta-analysis of five studies with histopathology as gold standard, which included 216 patients, the per-lesion sensitivity of 68Ga-PSMA PET/CT ranged from 33% to 92% (33% value being an outlier due to the retrospective analysis based only on the reports, in absence of the images) with higher specificity of 82%–100%. For T-staging, PSMA PET/CT showed a significantly higher tumour detection rate of 92% vis-à-vis 66% with MR alone. In regard with N-staging, the majority of metastatic nodes from prostate cancer are small subcentimetre-sized, less than 8 mm, which are overlooked, missed or inconclusive on morphological imaging (CT and MRI) (falling below size criteria for morphological imaging). Accurate N-staging is important because lymph node involvement is a critical prognostic factor in cancer management, and precise pelvic nodal clearance could be curative and could make a difference in treatment success and long-term outcome in prostate cancer (Fig. 11.12.12). Also, accurate prediction of pelvic nodal metastases may spare nodal dissection, shorten surgical time and in turn help to reduce undesirable complications. In one study from 2016 involving 130 patients with intermediate-risk to high-risk prostate cancer, the metastatic nodal detection rate by 68Ga-PSMA PET was around 66% compared to 44% with MRI. PSMA PET has shown superior predictive value for surgical response over Gleason score, pT stage and PSA (at the time of imaging). In a literature overview by Luiting et al. in 2019 involving 9 retrospective and 2 prospective studies, the specificity of PSMA PET/CT in detection of pelvic nodal metastases before initial treatment reached as high as 80%–100%. PSMA PET/CT increases the confidence level in the evaluation of nodal metastases and an NPV reaching up to 86%. With imaging becoming more precise and adding different modalities together, the question arises about the tiny nodes less than 5 mm size. In a study by van Leeuwen et al. in 2017, the mean size of missed lymph node metastases was 2.7 mm. In a recent study by Ferraro et al. in 2020, about the impact of PSMA PET staging on clinical decision-making in intermediate-risk to high-risk prostate cancer patients, PSMA PET provided new information in 36% of patients and this helped to change treatment decision in nearly 27% of patients, which means in every fourth patient they studied. PSMA PET in combination with CT or MRI can achieve complete and precise Tumor, Nodes and Metastases (TNM) staging including staging of local tumour, nodal assessment and bone and organ/visceral metastases, in one single imaging session, with improved accuracy and better outcome, and in turn leading to precise treatment planning, eventually superseding conventional imaging. Accurate localization of prostate cancer lesions in patients with BCR is a major challenge. Especially at low serum PSA values (as low as less than 0.5 ng/mL), the precise determination of localized disease and metastatic spread is of great importance for further disease management. Conventional imaging modalities including CT scan or bone scintigraphy have limited detection rate for metastatic disease at low serum PSA values in this setting of BCR. PSMA PET/CT imaging plays a very valuable role in the evaluation of BCR (Fig. 11.12.13), which is indeed very critical and important aspect in prostate cancer management. The international consensus on BCR includes PSA >0.2 ng/mL for two times after prostatectomy, or PSA nadir + 2 ng/mL after radiotherapy or brachytherapy. With the incorporation of PSMA PET/CT in the imaging armamentarium, the overall detection rate for local recurrence as well as metastases with BCR after prostatectomy reached up to 90%. The detection rate increases with rising PSA level, jumping over 90% with PSA level going above 1 ng/mL. In a homogeneous consecutive cohort of 248 patients with BCR after RP with mean serum PSA value of 1.99 ng/mL, studied by Eiber et al., 68Ga-PSMA PET/CT showed detection rates of 57.9%, 72.7%, 93.0% and 96.8% for patients with serum PSA values of 0.2–<0.5 ng/mL, 0.5–<1 ng/mL, 1–<2 ng/mL and ≥2 ng/mL, respectively. Tumour Gleason score or androgen deprivation therapy (ADT) did not significantly influence the detection rates (Fig. 11.12.14). These detection rates for 68Ga-PSMA PET are substantially higher than those reported for choline-based PET radiotracers, which fell between 19% and 36% at serum PSA levels of <1.5 ng/mL. The improved detection rates are due to the incremental value of molecular imaging as 68Ga-PSMA PET exclusively showed findings not evident on diagnostic CT in 32.7% of patients with information about additional involvement of different anatomical region in 24.6%. A high PSA-V and short PSA doubling time showed a tendency towards increased detection rates, though not statistically significant. As salvage radiotherapy is most effective at low serum PSA values, optimized radiotherapy planning with precise definition of target volume for concerned lesions for appropriate boost radiotherapy can be achieved with the help of PSMA PET/CT imaging. Lesion detection rate with PSMA PET/CT in the setting of BCR: PSMA PET/CT imaging helps to identify patients with oligometastatic disease who are suitable for salvage therapy with PSMA-radioguided surgery. PSMA radioligands, by the virtue of their high sensitivity and specificity, can be used for intraoperative tracking of even small metastatic prostate cancer lesions that can be well localized and subsequently removed using this radioguided surgery for salvage procedures. Identification and treatment of oligometastatic disease (3 to 5 positive sites) with targeted therapies such as surgery or radiotherapy may allow deferral of systemic therapies such as ADT, thereby delaying and reducing potential morbidity associated with systemic salvage therapy. The fusion of PSMA PET and MRI, instead of CT, may improve detection rates further in patients with very low serum PSA values (<0.5 ng/mL). The addition of mpMRI to PET can improve the diagnostic accuracy because of the higher soft tissue resolution and detection efficacy of mpMRI for local recurrence compared to CT. Advantages of PET/MRI include excellent anatomical and zonal resolution of the prostate gland with T2-w sequences, and additional useful information about suspicious lesions from functional MRI sequences like diffusion-weighted images (DWI) and dynamic contrast-enhanced (DCE) imaging. Early and accurate detection of tumour burden helps to plan further management strategy including salvage pelvic radiotherapy or salvage nodal dissection and eventually improve the prognosis. PSMA PET/CT also plays an important role in mapping the overall tumour burden, and separating oligometastatic disease from multiple metastases (Fig. 11.12.15). PSMA PET/CT also plays an important role in monitoring the treatment efficacy as well. 99mTc-methylene diphosphonate (99m Tc-MDP) (gamma camera-based radiotracer – single-photon emission computerized tomography (SPECT)/CT) or 18F-sodium fluoride (NaF) (PET/CT-based radiotracer) are bone-specific biomarker of osteoblastic activity. 18F-NaF has superior diagnostic performance compared to 99mTc-MDP (phosphonates) bone scintigraphy in detection of bone metastases, because of different radiotracer characteristics (different energy levels) and different scanners (PET/CT scanners vs conventional gamma scanner) leading to better resolution and clarity with 18F-NaF PET/CT scans. NCCN recommends bone scintigraphy in patients with PSA levels of more than 20 ng/mL or patients with T2 disease with PSA levels more than 10 ng/mL. However, their routine use in clinical practice is limited by relative lack of sensitivity and specificity vis-à-vis PSMA PET/CT and also not able to assess soft tissue lesions, which is possible with PSMA PET/CT (Fig. 11.12.16). Bone scans often fail to detect a lesion when PSA is less than 10 ng/mL in the setting of PSA recurrence post-RP, whereas PSMA PET/CT has been sensitive in the detection of lesions even at the PSA level of less than 0.5 ng/mL. Prostate cancer is a leading cause of cancer-related death in men; however, many patients with the prostate cancer do die of other causes. Hence, it is of paramount clinical importance to accurately risk stratify patients, to distinguish those with low risk to intermediate risk who could be managed conservatively or alternatively those with high risk for morbidity and mortality who would benefit from an aggressive line of therapy. Detection, risk stratification, staging, individual centred management, monitoring and surveillance of prostate cancer have undergone substantial evolution with time. MRI of the prostate gland was first described by Hricak et al. in 1983 and for long was used for staging patients with biopsy-proven prostate cancer and also occasionally served as a problem-solving tool. With recent advancements in MR technology, multiparametric imaging has become the cornerstone of the prostate cancer management, aiding in detection, characterization, risk stratification, biopsy guidance, surveillance and monitoring. This has been further enhanced and strengthened with the introduction of PI-RADS v2.0 in 2015 which helped standardize communication between the radiologists and urologists, and aided in the clinical decision-making process. As the role of MRI has expanded from detection to surveillance and monitoring, the entire clinical context needs to be available to the radiologist prior to performing an mpMR in order to optimize reporting. Both the imaging techniques and its interpretation may vary with the clinical context. In patients with no prior history of therapy, both T2-w images and DWI have a greater impact on reporting and interpretation, whereas in patients with prior therapy T1-w DCE imaging plays a more critical role in interpretation. In routine clinical practice, PI-RADS v2 recommends that PSA levels, detailed results of prior prostate biopsies and therapies be available to the radiologist at the time of performing and interpreting MR findings. Postbiopsy intraglandular haemorrhage occurs after image-guided prostate biopsies and is a confounder, which may obscure an underlying cancer. The greater extent of haemorrhage is attributable to the production of citrate within the prostate gland, which acts as an anticoagulant. The rate at which haemorrhage resolves is highly variable, often fully resolving in a shorter period in some patients and alternatively persisting for many months. Haemorrhage exclusion sign is a useful imaging finding, which may allow the radiologist to localize prostate cancer, as cancerous tissue has low levels of citrate and hence the propensity to haemorrhage in cancerous tissue is lower vis-à-vis benign glandular tissue. In addition, postbiopsy haemorrhage produces milder hypointensity on the T2-w and ADC maps vis-à-vis cancerous tissue. Ideally, a timeframe of 6–8 weeks has been suggested between the biopsy and the mpMRI. However, in routine clinical practice, the need to accommodate patients immediately postbiopsy or within a shorter time frame does exist, as the information provided by mpMR does overweigh the impact on haemorrhage on intraglandular tumour detection. Rectal over distension with faecal matter or gas impairs the quality of prostate mpMRI and especially seems to exacerbate artefacts on DWI. These issues seem to impact imaging with phased array coil rather than endorectal examinations. To avoid these artefacts, patients may be instructed to evacuate shortly before the examination, use a laxative or minimal enema prior to the procedure, have a preparatory enema or use antispasmodic agents to reduce potential artefacts from bowel peristalsis. Though various approaches do exist to adequately empty the rectum and minimize the artefacts, there is a lack of consensus on the optimum technique. mpMRI of the prostate gland can be performed on a 1.5 Tesla (1.5 T) or a 3 Tesla (3 T) scanner. Vastly improved signal-to-noise ratio (SNR) is the critical advantage of a 3 T scanner over a 1.5 T scanner, which in terms of prostate imaging translates into acquisition of high quality images with improved spatial and temporal resolutions, and also acquisition of higher quality functional sequences for quantitative imaging. Therefore, increasing field strength results in better detection and characterization of prostate cancer. On the contrary, higher field strength can amplify susceptibility artefacts arising from rectal air or metallic prosthesis. Other than field strength, many factors impact image quality and resolution including scanner model, gradient quality, slew rate, coil architecture and design and the sequence MR acquisition parameters. Prostate examinations are performed using a phased array coil placed over the pelvis. In certain institutions, an additional endorectal coil may also be used to achieve a higher SNR which improve the visualization of the prostate capsule and NVBs. Utilization of endorectal coils has certain drawbacks and results in patient discomfort, increased cost and scan duration and causes gland distortion. Endorectal coils improve imaging quality and local staging; however, with recent advances in coil technologies, phased array surface coils do provide similar high quality resolution images, which allows for accurate local staging. Currently, PI-RADS v2.0 does not insist on the use of endorectal coil and allows radiological practices to select hardware and optimize sequences that are most appropriate for the given clinical setting. mpMRI of the prostate gland is a combination of anatomical (morphological) and functional sequences. As per the PI-RADS v2 guidelines, the key sequences recommended include triplanar high-resolution axial T2-w images, high b-value axial DWI and ADC map and axial T1-weighted (T1-w) DCE images. High-resolution axial T2-w images and DWI are used to initially localize the ‘index lesion’ in the prostate gland. High-resolution sagittal and coronal T2-w images aid in colocalization of the ‘index lesion’ in terms of its spatial relationship with the gland. High-resolution T2-w images are the principal sequences of mpMR and are acquired with a small field-of-view (120–140 mm) in sagittal, oblique axial and oblique coronal planes. The high-resolution oblique axial and oblique coronal T2-w images are acquired orthogonal and parallel to the long axis of the prostatic urethra. These anatomical images provide exquisite demonstration of prostatic zonal anatomy, prostate capsule and periprostatic structures, which allows to accurately detect extraprostatic extension. An alternative to the acquisition of three separate T2-w sequences is the acquisition of a single volumetric 3-D T2-w imaging sequence with small near-isotropic voxels, which can then be retrospectively reconstructed in any plane. However, few concerns regarding the 3-D acquisition exist, including long acquisition time that may predispose to greater motion artefacts, reduced in-plane resolution and superimposed T2 and T1 contrast, which may diminish lesion conspicuity. PZ: Normal PZ has high SI on the T2-w images due to its high water content. Most prostate cancers exhibit low SI on T2-w images; however, mucinous adenocarcinomas may have a predominantly high SI. Low SI in the PZ may appear focal or diffuse and is not sine qua non for cancer, and may be seen in chronic prostatitis, glandular atrophy, postbiopsy haemorrhage or represent posttreatment sequelae. Rosenkrantz et al. demonstrated a diagnostic accuracy of 60% for T2-w imaging and showed that T2-w images is only moderately accurate for the detection of cancer and is not adequate for the diagnosis and localization of prostate cancer. T2-w images exquisitely demonstrate important morphological features of the lesion, which may aid in differentiation of cancerous tissue from its benign mimics, including size, shape and margin. Morphological features may overlap between benign lesions and low-risk to intermediate-risk cancers, but are very conspicuous in high-risk cancers. Benign lesions tend to appear linear-shaped or wedge-shaped and have indistinct margins, whereas prostate cancer appears as focal, crescentic or lentiform-shaped lesions. Lesion size is also a predictor for benign versus malignant, with larger lesions more likely to represent prostate cancer with a greater propensity to develop extracapsular extension. T2-w imaging is not the dominant sequence used to assess lesions in the PZ. T2-w PI-RADS v2 categories for PZ lesions are based on the SI, size, shape and margin of the lesion. PI-RADS category 1 is assigned to a homogeneously high SI normal PZ. PI-RADS category 2 lesions are linear-shaped or wedge-shaped, or present as areas of mildly low SI with indistinct borders. PI-RADS category 3 lesions have moderately low SI, but are heterogeneous or noncircumscribed are considered indeterminate. PI-RADS category 4 lesions have a high probability for clinically significant prostate cancer, are focal mass-like, circumscribed, exhibit homogeneously moderate to marked low SI and are less than 1.5 cm in size and do not exhibit extracapsular extension. PI-RADS category 5 lesions have a high probability for clinically significant prostate cancer, are focal mass-like, circumscribed, exhibit homogeneously moderate to marked low SI, are greater than or equal to 1.5 cm in size and/or exhibit extracapsular extension. Findings of extraprostatic extension (EPE) include focal capsular bulge with whiskering of the periprostatic fat, capsular irregularity, NVB asymmetry, obliteration of rectoprostatic angle and seminal vesicle invasion (SVI). TZ: Accurate detection and characterization of focal lesions in the TZ is the greatest challenge in the assessment of mpMRI. The challenge is most profound in middle age and elderly patients, the same population subset at risk for developing prostate cancer. T2-w imaging is not the dominant sequence used to assess lesions in the PZ. T2-w imaging is the dominant sequence used to assess lesions in the TZ in view of its ability to assess lesion texture and margins. BPH affects the periurethral TZ and glandular tissue and is characterized by the development of multiple variable size encapsulated nodules exhibiting variegated T2 signal due to the differential proportions of stromal hyperplasia and glandular hyperplasia, termed as organized chaos. Stroma rich BPH nodules pose a serious diagnostic challenge as this entity appears as low SI on T2-w images and hence lesion morphology plays a pivotal role in distinguishing this entity from prostate cancer. PI-RADS category 1 is assigned to a homogeneously intermediate SI normal TZ (Fig. 11.12.17). PI-RADS category 2 lesions are well-circumscribed and encapsulated nodules with low or heterogeneous T2 SI and are typically benign (Figs. 11.12.18 and 11.12.19). PI-RADS category 3 lesions are considered indeterminate, exhibit heterogeneous SI with obscured margins and are of any size (Fig. 11.12.20). PI-RADS category 4 lesions have a high probability for clinically significant prostate cancer, are lenticular or indistinct foci of homogenous moderately low SI, are less than 1.5 cm in size and do not exhibit extracapsular extension (Fig. 11.12.21). PI-RADS category 5 lesions have a high probability for clinically significant prostate cancer, are lenticular or indistinct foci of homogenous moderately low SI, are greater than or equal to 1.5 cm in size and/or exhibit extracapsular extension (Fig. 11.12.22).
11.12: Prostate
Prostate gland embryology
Ultrasonography of prostate
MR anatomy of prostate gland and periprostatic structures
Prostate gland zonal anatomy
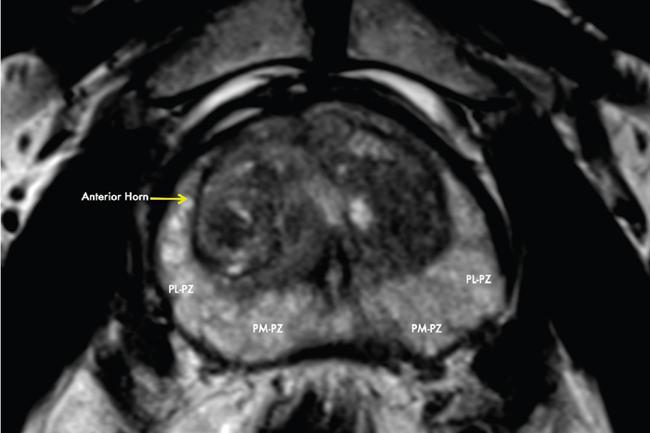
Peripheral zone
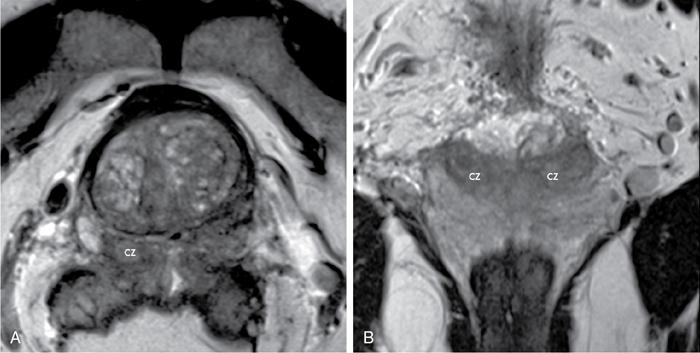
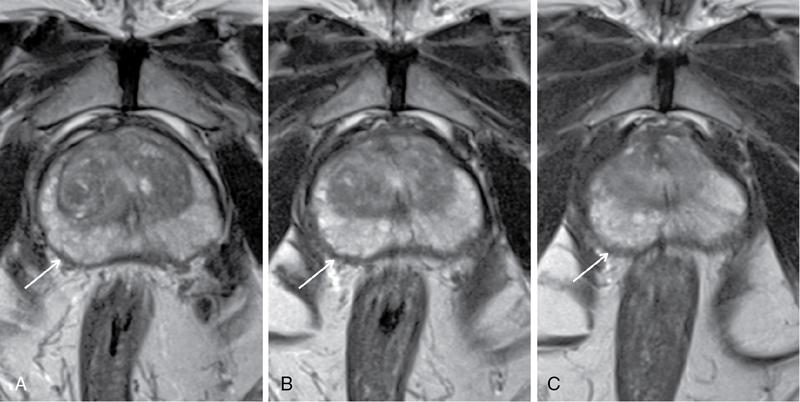
Central zone
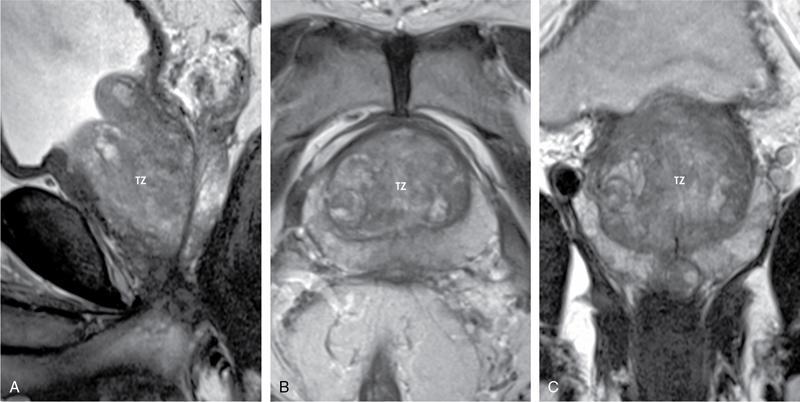
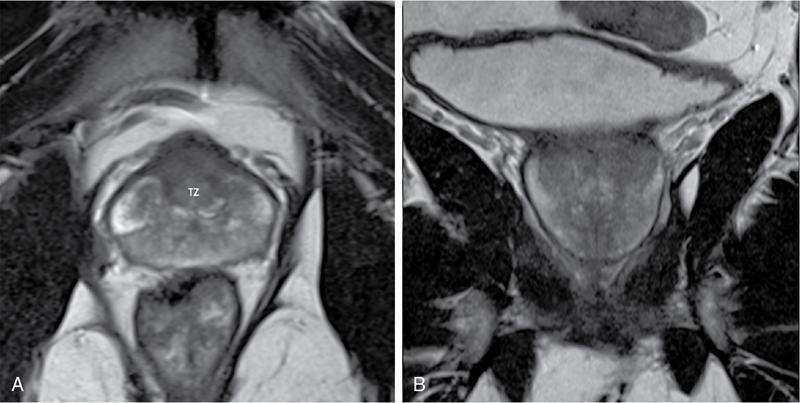
Transition zone
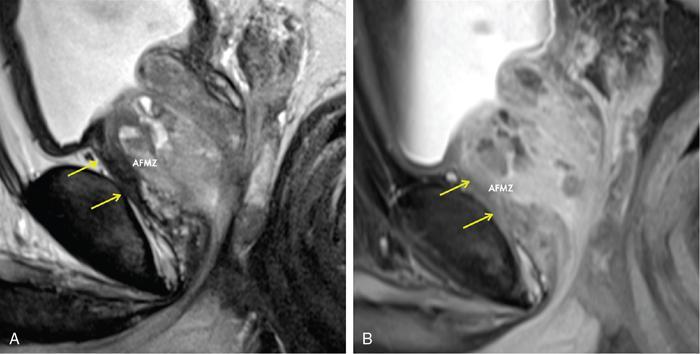
Anterior fibromuscular zone
Prostate capsule
Periprostatic fascia and neuroanatomy of prostate
Periprostatic vasculature and lymphatic drainage
Prostatic urethra
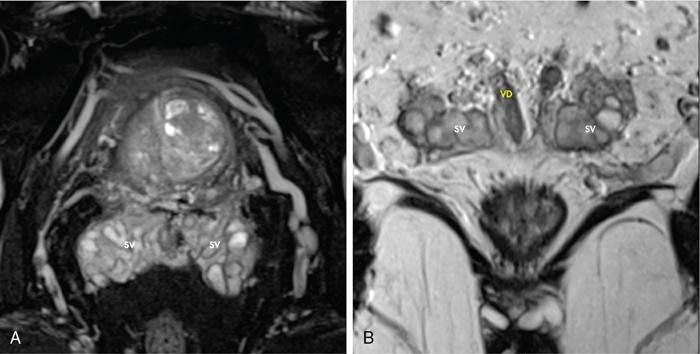
Seminal vesicles, vas deferens and ejaculatory ducts
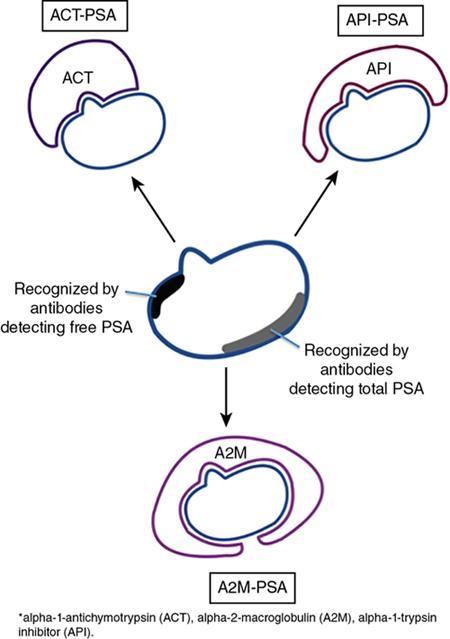
Prostate-specific antigen
PSA (ng/mL)
Recommendations
<2.5
Screen every 2 years
2.5–4
Individual risk assessment and yearly screening
>4
Referral for further evaluation or biopsy
PSA density
<0.15 ng/mL/cc along with PI-RADS score of 1–3 indicates a stable Gleason score
PSA velocity
>0.75 ng/mL/year raises suspicion of cancera
AGE-SPECIFIC PSA FOR WESTERN POPULATION
Age Group (Years)
PSA Range (ng/mL)
40–49
0–2.5
50–59
0–3.5
60–69
0–4.5
>70
0–6.5
AGE-SPECIFIC PSA FOR INDIAN POPULATION
Age Group (Years)
Mean PSA (ng/mL)
SD
40–49
1.22
1.19
50–59
1.97
3.17
60–70
2.08
2.63
Institution/Organization
Low Risk
Intermediate Risk
High Risk
Harvard (D’Amico) AUA EAU
T1–T2a and GS ≤6 and PSA ≤10
T2b and/or GS = 7 and/or PSA >10–20 not low risk
≥T2c or PSA >20 or GS 8–10
GUROC NICE
T1–T2a and GS ≤6 and PSA ≤10
T1–T2 and/or Gleason ≤7 and/or PSA ≤20 not low risk
≥T3a or PSA >20 or GS 8–10
CAPSURE
T1–T2a and GS ≤6 and PSA ≤10
T2b and/or GS = 7 and/or PSA >10–20 not low risk
T3–T4 or PSA >20 or GS 8–10
NCCN
T1–T2a and GS 2–6 and PSA ≤10 not very low risk AND very low-risk category: T1c and GS ≤6 and PSA <10 and fewer than 3 biopsy cores positive and ≤50% cancer in each core
T2b or T2c and/or GS = 7 and/or PSA >10–20 not low risk
T3a or PSA >20 or GS 8–10 not very high risk AND very high-risk category: T3b–T4
ESMO
T1–T2a and GS ≤6 and PSA <10
Not high risk and not low risk (the remainder)
T3–T4 or PSA >20 or GS 8–10
Role of PET/CT in the management of prostate cancer
Introduction
Different radiopharmaceuticals/radiotracers
PSMA-based radiotracers
Normal distribution
Where can we use PSMA PET/CT?
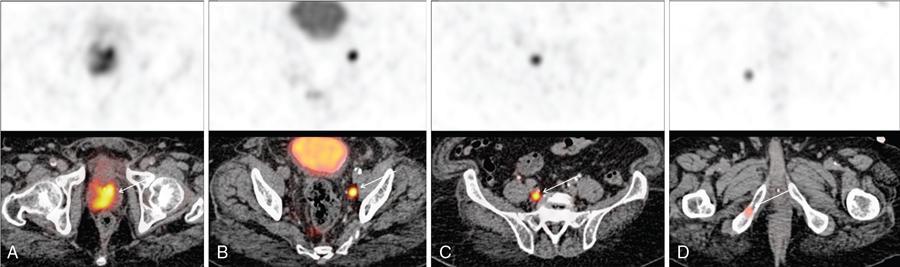
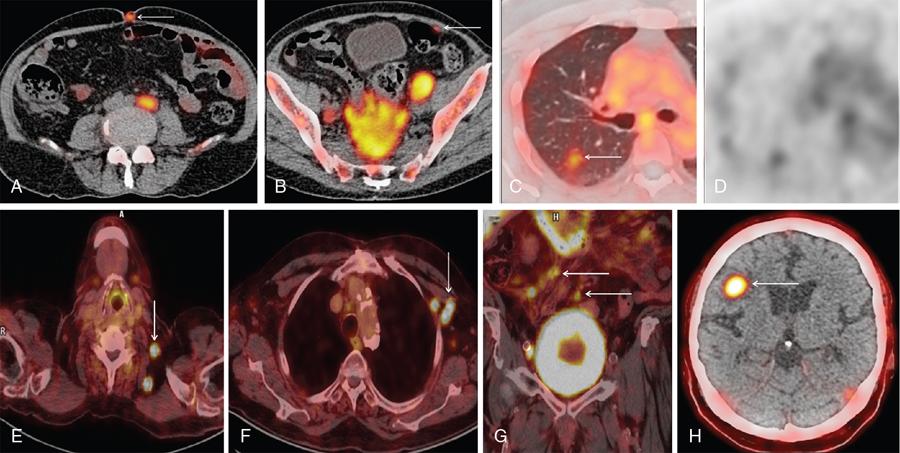
Initial/primary diagnosis
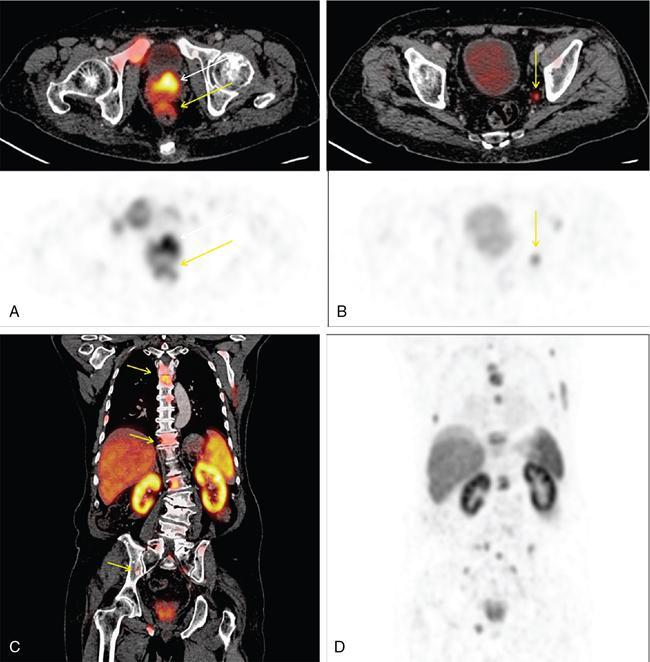
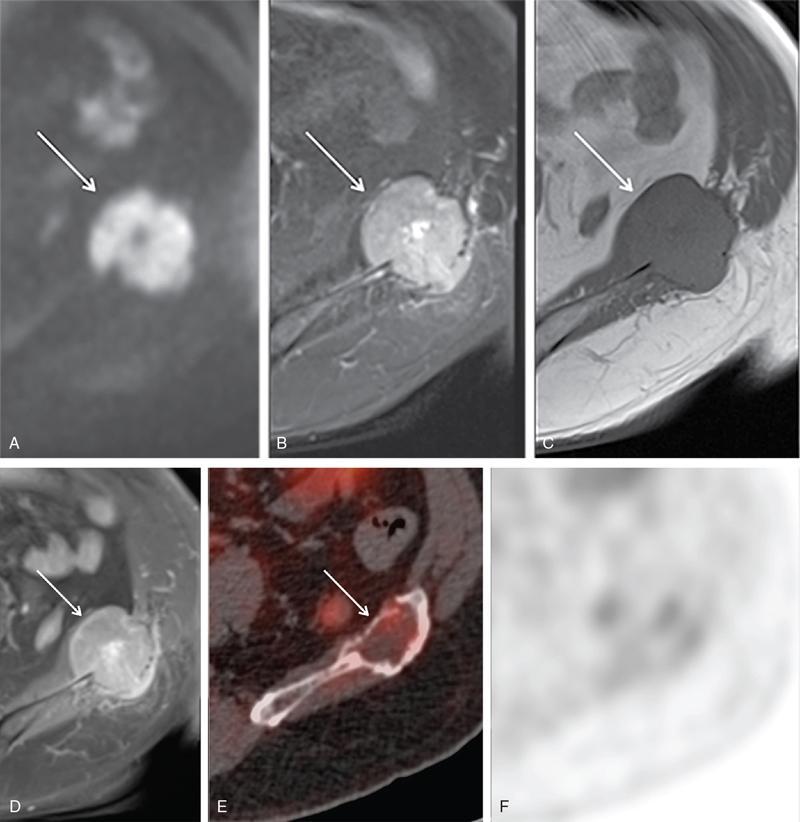
Staging
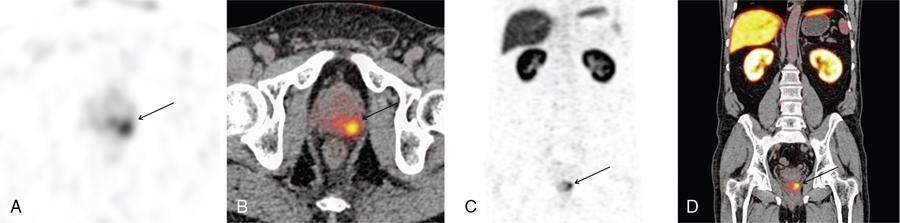
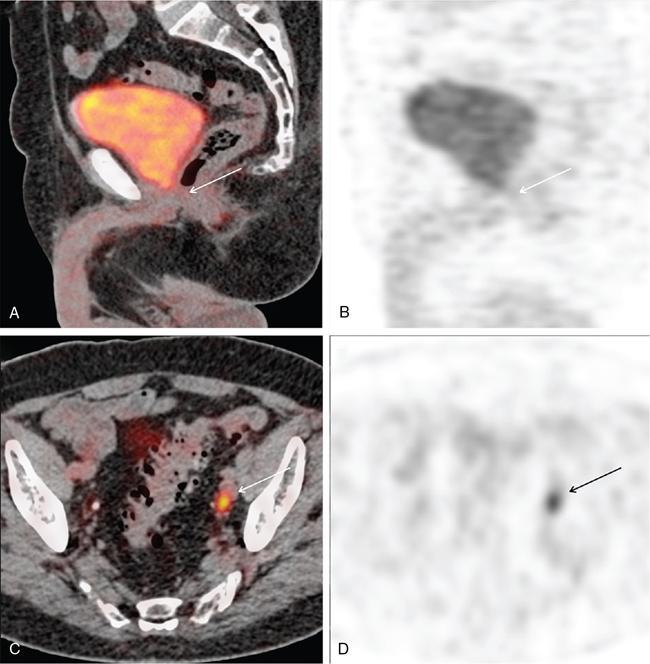
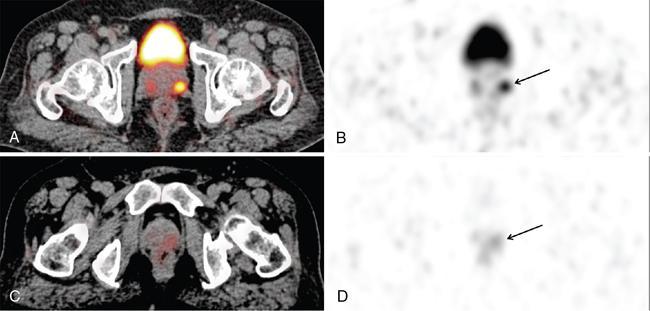
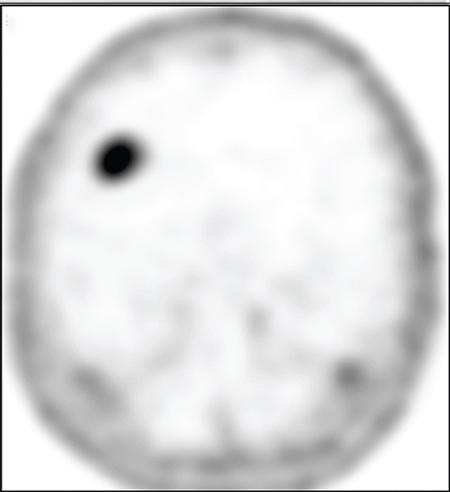
Biochemical recurrence
Serum PSA Values (ng/mL)
Detection Rate
0.2–<0.5
57.9%
0.5–<1
72.7%
1–<2
93%
≥2
96.8%
Role of 99mTc-MDP/18F-sodium fluoride bone scan in prostate cancer
Multiparametric magnetic resonance imaging of prostate gland
Clinical information prior to multiparametric magnetic resonance imaging
When to perform multiparametric magnetic resonance imaging after prostate biopsy?
Patient preparation
MR hardware
Sequences
T2-weighted imaging
Related posts:


Stay updated, free articles. Join our Telegram channel

Full access? Get Clinical Tree


