General protocol
For all of the ultrasound (US) shear wave elastography (SWE) techniques (vibration controlled transient elastography [VCTE], point shear wave elastography [pSWE] and two-dimensional shear wave elastography [2D-SWE]), adherence to a strict protocol when assessing liver stiffness is required. The recommended items and the quality criteria that must be used follow.
We use the convention that the region of interest (ROI) is the larger area (field of view [FOV]) where the color-coded values are displayed in 2D-SWE and the measurement box is the area selected where the measurement is taken.
Acoustic radiation force imaging–based techniques
Patients should fast at least 4 hours before the examination
It should be kept in mind that SWE techniques assess tissue stiffness, which is directly correlated with liver fibrosis but can also increase due to several other factors including but not limited to congestion and inflammation. Within 5–30 minutes after a meal, blood flow to the digestive organs increases. This is a normal physiological phenomenon that lasts for up to 3 hours. The resultant increase of blood flow to the liver through the portal vein and hepatic artery leads to an increase of liver stiffness.
Several studies have demonstrated an increase of liver stiffness after ingestion of food. A study in patients with chronic liver disease reported that liver stiffness significantly increased immediately after food intake for up to 60 minutes and normalized after 180 minutes. An increase of at least 1 kPa after food intake was found in more than half of patients who had baseline stiffness ≤10 kPa.
Ingestion of food can only increase the liver stiffness; therefore, if patients are not in a fasting state and their stiffness value is normal, they have no or mild fibrosis.
Measurement should be taken at an intercostal space with the patient in the supine or slight lateral decubitus (30 degree) position with the right arm in extension.
This is not an arbitrary recommendation or an expert opinion. In fact, the highest consistency and intra- and interobserver reproducibility of liver stiffness measurements and the highest accuracy are observed for measurement taken in the intercostal space. This is likely due to factors related to both the operator and the patient. In utilizing the intercostal space, the effect of pushing with the transducer, which may lead to an increase of stiffness value due to compression of the organ, is somehow weakened by the ribs and the intercostal muscles. Moreover, it is easier to maintain the transducer perpendicular to the liver capsule. On the contrary, measurement taken with a subcostal approach may be hampered by gas in the abdomen requiring a patient to take a deep breath to displace the gas, and external compression with the transducer is also applied; both may lead to an overestimation of liver stiffness. All these factors are subject to some degree of variability from patient to patient and affect the variability of measurement in an unpredictable manner. In addition, the reported rate of failure for measurements performed with a subcostal approach in patients with supposedly normal livers reached 62% in one study. Measurements performed in the left lobe of the liver are hampered by motion due to the heartbeat, and higher stiffness values than those in the right liver lobe using an intercostal approach are obtained. Moreover, the measurement success rate is significantly higher in the right liver lobe (91%–98% vs. 77%–84%, respectively). , The agreement in stiffness values between the liver lobes has been reported to be moderate to poor. , ,
To increase the width of the intercostal space for a correct positioning of the transducer between the ribs, the patient should extend the right arm above the head in the supine position. The expert opinion is that a slight left lateral decubitus, not more than 30 degrees, might be of help in obese or difficult-to-scan subjects. To keep the angle less than 30 degrees, a pillow just beneath the upper right side of the patient is of help. A higher degree of decubitus positioning is not recommended because it has been shown that it affects the portal vein blood flow and therefore causes stiffness ( Figs. 4.1 and 4.2 ).


In liver transplant patients with a left-lobe graft, the epigastric approach can be used. However, the higher variability and higher stiffness values for measurements taken in the left liver lobe should be considered; therefore the stiffness can be overestimated using the cutoffs that were obtained in the right liver lobe through an intercostal approach. In these cases, the change over time of the baseline stiffness value may help overcome this issue, allowing the monitoring of the efficacy of the treatment or the progression of the disease.
It is important to have the transducer perpendicular to the liver capsule in both the superior/inferior and right/left planes. The liver capsule should be a bright fine white line. When the transducer is angled to the liver capsule, the ARFI pulse is refracted and therefore weakened. This causes weaker shear waves with the resultant decrease in signal-to-noise leading to more error in the measurement ( Figs. 4.3 and 4.4 ).


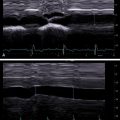
Measurements should be taken at neutral breathing during a breath hold
Generally, patients undergoing an US examination of the upper abdomen know that they will be asked to take deep breaths for better visualization of the liver. Hence, they may be expecting that when the operator is exploring the liver for the best acoustic window for liver stiffness measurement they should take a deep breath and hold it.
It is suggested to instruct the patients before taking a stiffness measurement, advising quiet breathing while looking for the optimal scanning window and then asking them to stop breathing when the image on the monitor is free of vessels or ligaments.
It is the expert opinion that breath hold (a few seconds) during quiet breathing leads to the most optimal results. Taking a deep breath or using a Valsalva maneuver or deep expiration changes hepatic venous pressures, which can affect the stiffness measurement ( Fig. 4.5 ).

Of note, a study found that deep inspiration significantly increased stiffness values by 13%.
When using a pSWE technique in patients unable to hold their breath, the stiffness values can be measured at the end of the expiratory phase when there is an automatic pause with almost no motion for two seconds. This is not possible with 2D-SWE because the elastogram may take a slightly longer time to stabilize. In this case, as suggested for children (see Measurements in Pediatric Patients with the ARFI Techniques), a cine loop can be recorded and the image with the most stable pattern can be utilized for the stiffness measurement.
ROI placement to avoid liver vessels and/or bile ducts and rib shadows
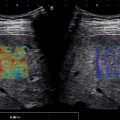
The ROI must be placed in a homogeneous area of the liver, avoiding vessels and/or bile ducts as well as artifacts. Using 2D-SWE, the inclusion of small vessels at the edges of the ROI is acceptable; however, the measurement box must always be placed at least 5 mm away from them.
There could be a false increase of liver stiffness adjacent to vessels ( Figs. 4.6 and 4.7 ). In 2D-SWE, these artifacts can be identified and avoided. Depending on the US’s vendor, artifacts may not be color-coded or appear as areas of increased stiffness. These areas must be avoided when placing the measurement box. These artifacts are not visualized in pSWE, and therefore measurements must be obtained at least 5 mm from these structures ( Fig. 4.8 ).


Measurement location
Measurement should be taken at least 15–20 mm below the liver capsule in pSWE. The 2D-SWE ROI can be positioned closer to the liver capsule if reverberation artifacts are avoided.
Using 2D-SWE it is quite common to find reverberation artifacts when the proximal edge of the ROI is too close to the liver capsule ( Figs. 4.9 and 4.10 ). These artifacts are presented in detail in Chapter 6. Because they are well visualized in 2D-SWE, the operator can avoid them and not include them in the measurement box. With pSWE the reverberation artifact is not visualized, therefore the operator must avoid positioning the sample box up to 15–20 mm below the liver capsule ( Fig. 4.11 ).


Of note, a study performed early in the evaluation of the first commercially available pSWE technique found a statistically significant difference between the mean shear wave velocity values obtained at 5.5 cm from the liver capsule and that obtained immediately under the liver surface (1.56 vs. 1.90 m/s).
Location of maximum arfi push pulse
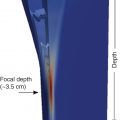
In most systems, the maximum ARFI push pulse is at 4–4.5 cm from the transducer, which is the optimal location for obtaining measurements.
Most vendors have placed the focus of the ARFI pulse between 4 and 5 cm from the transducer. This is the region of highest energy deposition, and therefore shear waves with the highest amplitude are generated. This recommendation is also based on the results obtained with studies on phantoms, , which have shown that the results with the lowest variability are obtained at a depth of 4–5 cm with a convex probe. The acoustic push pulse is progressively attenuated as it traverses the tissue. The amplitude of the shear waves is proportional to the strength of the push pulse. Therefore measurements taken at deeper depths will have lower amplitude shear waves leading to less signal-to-noise ratio in the estimate of the shear wave speed (SWS; Fig. 4.12 ).

Studies on phantoms have also reported that the influence of the depth on estimating liver stiffness is not negligible. In viscoelastic phantoms, the deepest focal depth (7.0 cm) generated the greatest intersystem variability for each phantom, reaching a maximum of 17.7% as evaluated by the interquartile range. On the other hand, although most vendors allow measurements up to 8 cm from the transducer, it should be underscored that the ARFI push pulse is attenuated by 6–7 cm, limiting adequate shear wave generation.
It should also be pointed out that the SWS is proportional to the mean ARFI frequency. For the US systems using ARFI technique there is a bandwidth of the ARFI pulse. Especially in steatotic or stiff livers, the mean ARFI frequency will change with depth as the higher frequency components will be attenuated sooner, leading to a change in the liver stiffness value measurement. Therefore, when performing follow-up examinations in addition to using the same US system and transducer, the same depth of measurement should be maintained. For VCTE and magnetic resonance elastography (MRE), this does not occur as the measurements are taken at a fixed frequency (no bandwidth).
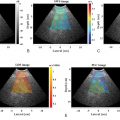
As of July 2021, Siemens Healthineers is the only vendor that has designed and commercialized a transducer (Deep Abdominal Transducer, DAX) able to penetrate deeper into the abdomen, up to 40 cm. It has been designed to work in all advanced modes including SWE. It allows for SWE measurements up to 14 cm. In addition, the lower frequency of the transducer allows for SWE measurements in some patients with high body mass index in whom other systems may not be able to obtain accurate SWE measurements ( Fig. 4.13 ). However, it must be emphasized that studies aimed at assessing the intraobserver and interobserver variability and the accuracy of stiffness measurement obtained with this new transducer are not yet available.

Attenuation of the US beam is higher in stiffer and steatotic livers. Therefore measurements are more variable in patients with severe fibrosis or high degrees of steatosis.
An image of the recommended transducer positioning and placement of the measurement box is provided in Fig. 4.14 . Table 4.1 summarizes the protocol recommended for accurate liver stiffness measurements.

|
|
|
|
|
|
|
|
|
|
Results can be reported in meters per second or in kilopascals
Every US system directly measures the SWS in meters per second. By assuming that the SWS does not change with the magnitude or frequency of the applied force or with the position and direction in the tissue, it can be converted to the Young modulus in kilopascals: E = 3(vS 2 ρ), where E is the Young modulus, vS is the SWS, and ρ is the density of the tissue in homogeneous isotropic tissues. The assumption is made that the tissue density is 1 g/mL. It is worth mentioning that the Young modulus E (strain modulus) is the unit of measure used for all US SWE, whereas the shear modulus G, which is also reported in kilopascals but is approximately three times smaller than the Young modulus E, is used in MRE. Thus the values are not directly comparable. MRE measurements in kilopascals are approximately a third of the measurement obtained with US SWE in kilopascals.
The choice of whether to display the SWS in meters per second or the Young modulus in kilopascals is generally one of user preference. Theoretically, it is better to report results in units of meters per second rather than kilopascals. In fact, this is the unit of SWS, which is the quantity measured by all US systems. The conversion to kilopascals using a simple equation is based on many assumptions, including that the tissue has very simple behaviors (i.e., that is linear, isotropic, and homogeneous) and is incompressible, that may not be correct. Nonetheless, the measure of stiffness using the Young modulus in kilopascals has become quite common in clinical practice since the availability of the FibroScan and clinicians are more familiar with kilopascals than with the SWS measurement. Therefore the update to the Society of Radiologists in Ultrasound (SRU) consensus has allowed both possibilities. Many systems provide the measurements in both meters per second and kilopascals, and reporting both is helpful so the referring physician can use whichever measurement they feel comfortable with.
Number of measurements required
Ten measurements should be obtained with pSWE, and the result should be expressed as the median together with the interquartile range/median (IQR/M). Fewer than 10 measurements with pSWE can be obtained if necessary (at least 5); however, the IQR/M should be within the recommended range. For 2D-SWE, five measurements should be obtained when the manufacturer’s quality criteria are available, and the result should be expressed as the median together with the IQR/M.
When performing a measurement on biological tissues with a device, a technical or biological within-subject variability must be taken into consideration. The technical variability is associated with the analytical performance in terms of measurement errors; it can be strictly controlled but not completely removed. The within-subject biological variability represents the physiological changes that may occur in each individual due to biological factors. Therefore a single measurement is likely inaccurate because it will ignore the possibility of correlated variability.
For multiple measurements, the mean (average) is usually the best measure when the data distribution is continuous and symmetrical. This is not the case with SWE measurement in which the data set generally has a skewed distribution due to the presence of outliers (i.e., values that are unusual compared to the rest of the data set by being abnormally smaller or larger). The mean value will include the outliers in the computation, and therefore it may be misleading. The median value is preferred because it is a robust statistic of the central tendency, and the outliers have little effect on the result.
For pSWE, 10 measurements are usually recommended. However, studies have shown that acquiring 5 measurements does not decrease the accuracy if the IQR/M is within the recommended range. It is recommended to take 10 measurements when starting a liver stiffness program. Only after mastery of the technique with good results should fewer measurements be taken.
When using 2D-SWE, artifacts can be visualized and avoided. Selection of an area of higher accuracy can be identified using confidence or quality maps. Therefore only five measurements are recommended. The IQR/M should be ≤30% in kilopascals and ≤15% in meters per second as in pSWE.
Another quality criterion that should be applied is that >60% of the measurements should be “good” measurements. A good measurement in pSWE is when a value is obtained, not 000 or xxx. When the result is 000 or xxx the system cannot calculate an estimate of the SWS due to poor quality. In 2D-SWE a bad measurement is usually not colored in the velocity/elasticity map. The expert opinion is that if 50% or more of the velocity/elasticity map in 2D-SWE is not colored, it should be considered a bad measurement. Note that a good measurement does not mean it is accurate. When <60% of the measurements are good, it is unlikely that any of the measurements are accurate. Taking more measurements to obtain the 5 or 10 suggested measurements is unlikely to produce accurate measurements. This often occurs in patients with high body mass indexes.
Reliability criteria
The most important reliability criterion is an IQR/M ≤30% of the 10 measurements (pSWE) or 5 measurements (2D-SWE) for kilopascals and ≤15% for measurements in meters per second (SWS).
The interquartile range, also called the “middle fifty,” is a measure of the statistical dispersion of the data being equal to the difference between the upper and lower quartiles. Several studies have reported that the level of variability between consecutive acquisitions, assessed by means of the IQR/M, is the most important quality criterion. An IQR/M value ≤30% for measurements taken in kilopascals and ≤15% for measurements taken in meters per second suggest that a data set is good. The difference between IQR/M for kilopascals and meters per second is due to the conversion of meters per second to kilopascals, which is not linear. When the IQR/M is >30% for measurements given in kilopascals and >15% for measurements in meters per second, the accuracy of the technique decreases and values should be judged as unreliable ( Fig. 4.15 ). The IQR/M can be presented also as decimals (e.g., ≤0.30 or ≤0.15).