▪
Introduction
CT pulmonary angiography (CTPA) to assess for pulmonary embolism (PE) makes up the lion’s share of most radiologists’ exposure to the pulmonary vascular system and is the focus of this chapter. The pulmonary vascular anatomy is detailed because this can be the crucial determinant to differentiate embolism from artifact. Other modalities for pulmonary vascular assessment, including radiography, MRI, and catheter angiography, are briefly discussed. Finally, select congenital and other pulmonary vascular pathologies are described.
▪
Pulmonary Vascular Anatomy
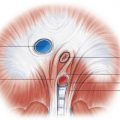
The adult pulmonary circulation consists of the pulmonary arteries (PAs), pulmonary veins, and bronchial arteries. In anatomically normal individuals, the main pulmonary artery (MPA) or pulmonary trunk arises from the right ventricular (RV) outflow tract distal to the pulmonic valve and then divides into the right and left pulmonary arteries (RPA and LPA, respectively). This bifurcation is readily visible on axial CT slices and is usually conveniently located near the carina, which makes this a popular location to place a bolus-tracking region of interest for CTPA. The LPA arches over the left main stem bronchus and gives rise to the left upper and lower lobar PA branches. The RPA is longer, arches over the right main stem bronchus, and gives rise to upper, middle, and lower lobar PAs. This anatomic relationship between the RPA and LPA and their associated bronchi is critical for determining situs in congenital heart disease, although this is of limited usefulness in most adult patients. The right upper lobe PA divides into apical, posterior, and anterior segmental PAs. The right middle lobe PA divides into lateral and medial segmental arteries. The right lower lobe PA divides into superior, anterior, posterior, medial, and lateral segmental arteries. On the left side, the upper lobe artery divides into apicoposterior, anterior, and lingular arteries, which further divide into superior and inferior segmental arteries. The lower lobe artery divides into superior, anteromedial, lateral, and posterior basal segmental arteries. The word central is also often used to refer to the main, left, and right PAs. PAs travel next to bronchi, whereas pulmonary veins travel separately from the bronchi ( Fig. 27.1 )—a useful pearl to differentiate arteries from veins when they cannot be followed back to the heart.

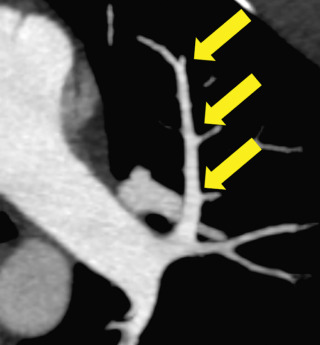
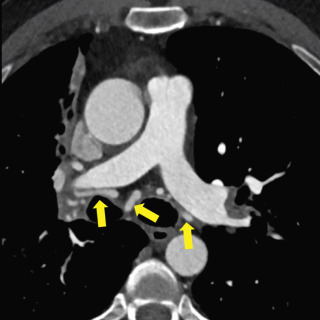
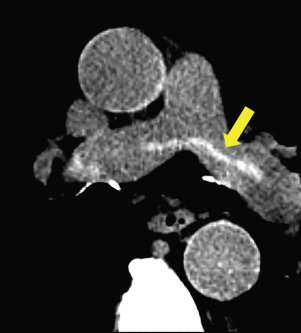
PAs should be of similar caliber as adjacent bronchi; a substantial disparity in size should raise suspicion for pathology. PAs narrow as they branch ( Fig. 27.2 ); this anatomic feature can be helpful when differentiating an embolus from an artifact because emboli should catch at these branch points.
Pulmonary venous anatomy is more variable than pulmonary arterial anatomy. In most patients, there are two left and two right pulmonary veins that drain to the left atrium, but many normal variations have been described. The distal veins parallel to the course of the PAs until the proximal segmental regions; thereafter, each takes a distinct course. Usually, the right upper lobe veins course adjacent and lateral to the superior vena cava (SVC). The right middle lobe vein combines with the upper lobe vein to form a common confluence and then drains into the left atrium. The right inferior lobe pulmonary vein drains posteriorly and medially into the left atrium as a separate ostium. On the left, the upper lobe pulmonary vein takes a posterior and medial course after the convergence of the superior segment and lingular veins, draining into the left atrium. The left lower lobe vein has a long posterior and medial course; the descending thoracic aorta often indents the vein, but this is typically of no clinical significance.
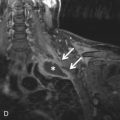
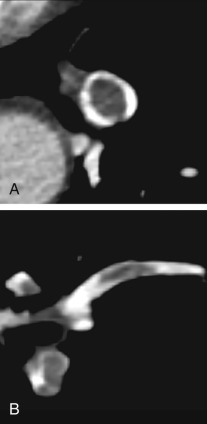
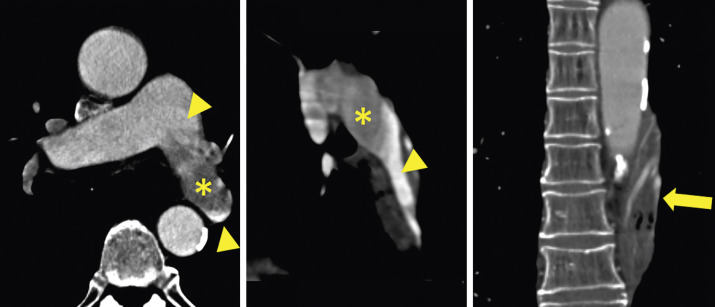
Bronchial arteries are the final component of the pulmonary vasculature. There are typically two left bronchial arteries that arise from the descending thoracic aorta. There is usually a single right bronchial artery that arises from the first aortic intercostal artery or by a trunk with the left upper bronchial artery. In the adult, the bronchial arteries usually contribute little to the pulmonary circulation. However, in pathologic states that cause diminished pulmonary arterial circulation (e.g., due to tetralogy of Fallot or PA stenosis), the bronchial arteries serve as an important collateral pathway ( Fig. 27.3 ).
▪
Imaging Modalities
Chest Radiography
Chest radiographs remain the first-line modality in the evaluation of pulmonary vascular disease and are especially useful for excluding nonvascular disease such as pneumonia or effusion. Although radiographic findings have been described in many of the pulmonary vascular diseases discussed in this chapter, as a whole they lack both sensitivity and specificity and have been superseded by other techniques.
Ventilation-Perfusion Scintigraphy
The ventilation-perfusion (V/Q) scan is a nuclear medicine technique introduced in the 1960s for the assessment of pulmonary ventilation and blood flow. Perfusion scintigraphy is performed with intravenous (IV) injection of technetium-99m ( 99m Tc)-labeled macroaggregated albumin, which ranges in size from 10 to 40 µm and localizes in precapillary arterioles. Ventilation scanning is performed typically with inhaled xenon-133 or 99m Tc-labeled aerosols. Prior to the early to mid-2000s, V/Q scanning was the first-line diagnostic test for PE, along with compression sonography of the lower extremities for deep venous thrombosis (DVT). The major limitation of V/Q for PE was its probabilistic nature, with a large proportion of inconclusive results, particularly in patients who had abnormal chest radiographs. In the United States, V/Q has since been largely replaced by CTPA, which allows for direct visualization of the PAs and pulmonary emboli. However, it is worth remembering the advantages of V/Q for select patient populations. V/Q delivers substantially less radiation dose to the breasts, and for this reason the 2012 American Thoracic Society/Society of Thoracic Radiology guidelines favored V/Q over CTPA for young or pregnant women with a normal chest radiograph and no lower extremity DVT on compression sonography. V/Q also does not require iodinated contrast and thus is useful for patients with renal insufficiency or contrast allergy.
Multidetector CT
CTPA performed with multidetector CT (MDCT) has revolutionized the assessment of the pulmonary vasculature and has in practice replaced invasive pulmonary angiography as the gold standard for diagnosis. With modern scanners, the entire thorax can be imaged in a single breath-hold. CT offers exquisite spatial, contrast, and temporal resolution and can demonstrate even small subsegmental pulmonary arterial branches. At the same time, disease processes affecting the lungs and other portions of the chest beyond the pulmonary vasculature can be assessed.
A typical CTPA protocol uses a test bolus or bolus tracking technique to determine the appropriate scan delay after contrast injection at which the attenuation of the PAs is maximized. Some prefer a caudocranial CTPA acquisition based on reports of a lower rate of artifacts, but other studies have found no substantial difference between caudocranial and standard craniocaudad techniques. For the diagnostic scan, a bolus of 70 to 140 mL of contrast at a concentration of 300 to 375 mg iodine/mL is injected preferentially via an 18- to 20-gauge IV placed in an antecubital vein at a typical rate of 3 to 5 mL/s, followed by a saline flush. Radiation doses may be decreased by lowering the peak kilovoltage (kVP) while increasing the product of tube current and exposure time (mAs) to maintain image quality. Iterative reconstruction algorithms also allow dose reduction without sacrificing image quality compared to standard filtered backprojection algorithms. Because the subsegmental PAs are quite small, the image reformats should be generated to maximize spatial resolution. The axial slice thickness should be ≤1.25 mm. The reconstructed field of view should be limited to the lungs (ribs to ribs) to maximize xy plane spatial resolution. Coronal and sagittal reformations are often helpful for problem solving.
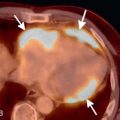
There has been considerable recent interest in the potential added value of dual-energy CT in evaluating pulmonary vascular disease, such as PE. Dual-energy CTPA is obtained using two different photon spectra—for example, at 140 and 80 kV. In addition to the standard grayscale CT images, an iodine distribution map is generated, which correlates with perfusion to the lung. This allows assessment of the extent and severity of perfusion deficits to the lung caused by various pulmonary vascular insults (e.g., arterial obstruction by emboli), which may be correlated with prognosis or alter management.
MRI/Magnetic Resonance Angiography
MRI/magnetic resonance angiography (MRI/MRA) is a promising tool for assessing the pulmonary vasculature. Unlike competing modalities, such as CT or V/Q scintigraphy, there is no ionizing radiation. Although evaluation for PE is best performed with IV gadolinium contrast agent, MRA can be performed without IV contrast, a welcome alternative in patients with renal impairment. Both anatomic and perfusion imaging can also be simultaneously acquired. Nevertheless, a number of challenges limit the more widespread use of pulmonary vascular MRA. These include long examination times, which may be difficult for dyspneic patients, lower spatial resolution (≈1–2 mm vs. <1 mm for CT), poorer sensitivity for small pulmonary emboli, and high technical difficulty. With continuing improvements in MRI and familiarity with techniques, the use of pulmonary vascular MRA may become more common.
Invasive Pulmonary Angiography
Once the gold standard for imaging the pulmonary vasculature, catheter-based invasive pulmonary angiography is now infrequently performed as a diagnostic test. It is generally reserved for situations in which an intervention is planned, such as drug or mechanical thrombolysis, embolization of aneurysms, malformations, or collateral vessels, and stent placement. In addition, catheter angiography can provide direct physiologic measurement of the degree of shunting and pulmonary pressures.
▪
Acute Pulmonary Embolism
Currently, most PA imaging is performed for the evaluation of PE. A PE is a clot that has migrated, or embolized, from a distant source, usually the deep veins of the lower extremities, and becomes lodged within the PAs. It is the third leading cause of cardiovascular disease after myocardial infarction and stroke, affecting 600,000 people annually and accounting for more than 10% of in-hospital deaths, with an untreated mortality rate as high as 30%. PE is notoriously difficult to diagnose clinically. Presenting symptoms such as chest pain, tachycardia, and tachypnea are nonspecific. Clinical prediction rules such as the modified Wells criteria and use of the serum D-dimer have low specificity. The PIOPED II (Prospective Investigation of Pulmonary Embolism Diagnosis II) established CTPA as the de facto gold standard for the diagnosis of PE, with subsequent studies finding a sensitivity and specificity approaching 100% and 97%, respectively. Alternative modalities include V/Q scintigraphy (V/Q scan), MRA, and invasive pulmonary angiography. In following sections, the distinguishing imaging features of PE in its varied forms are discussed, with an emphasis on MDCT and an attention to diagnostic pitfalls.
Practical Approach to Interpreting CT Pulmonary Angiography for Pulmonary Embolism
Quality
The quality of the CTPA should first be assessed to determine whether PE can be confidently excluded and to what level. This usually hinges on the contrast bolus and respiratory motion. It has been reported that a mean attenuation of 250 Hounsfield units (HU) in the MPA is necessary to exclude PE; in actual practice, main, lobar, and even segmental pulmonary emboli can sometimes be excluded with worse opacification. If the study is limited, this uncertainty and to what level (main, lobar, segmental, subsegmental) PE can be confidently excluded should be reported so that the health care provider can decide whether additional testing is necessary.
Search Pattern
There is no one correct way to read a CTPA for PE, but for the sake of instruction, we present our search pattern. Start with a gestalt pass (i.e., look at the entire image) through the stack of thin (≤1.25-mm) axial images and then focus on individual quadrants (upper left, lower left, upper right, lower right) while scrolling through the axial images. Finally again take a last gestalt pass through a set of coronal multiplanar reformatted images (MPRs). Coronal (or sagittal) MPRs can be very helpful to identify pulmonary emboli oriented in the axial plane and for completely occluded segmental or subsegmental PAs that would be difficult to perceive on axial images. Standard mediastinal window and level settings could wash out emboli by making the PAs appear too bright, so a PE-specific window width/level setting of 700/100 has been proposed. In practice, we find that the best window varies substantially based on the contrast bolus. RV trabeculations should be visible on PE windows because they have a similar to slightly higher attenuation than clot ( Fig. 27.4 ).
CT Pulmonary Angiography Findings of Acute Pulmonary Embolism
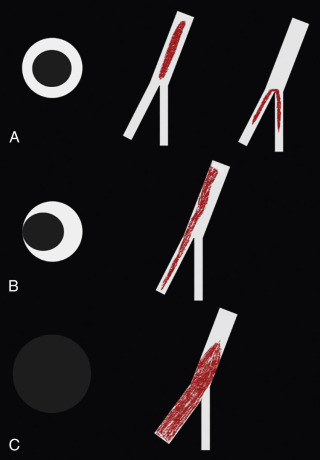
Pulmonary emboli should have a serpentine shape because they were originally casts of deep veins. The embolus should be longer than it is wide and oriented down the barrel (long axis) of the artery ( Fig. 27.5 ). PAs narrow as they branch (see Fig. 27.2 ), so emboli should catch at these branch points. The embolus should have a sharp, well-defined border ( Fig. 27.6 ). Any filling defect that does not fit these criteria should be scrutinized as a possible artifact.
Artifacts
At most centers, only 5% to 7% of CTPA findings are positive for PE. Treatment of PE, in most cases 3 months to a lifetime of anticoagulation, carries substantial cost and inconvenience. Furthermore anticoagulation carries an approximately 0.5% annual risk of major hemorrhage, with a substantially higher rate during the first 3 months of treatment and in patients with bleeding risk factors. Thus the misdiagnosis of PE has the potential to cause substantial harm.
When a possible filling defect is detected on CT, the first step is to confirm that it lies within a PA and not a vein. The pulmonary veins enhance heterogeneously and can mimic pulmonary emboli ( Fig. 27.7 ); pulmonary vein thrombus is very rare and is usually seen in the setting of direct malignant invasion or as a postprocedural complication. On chest CT, this is easily accomplished by following the vessel back to the right ventricle (PA) or left atrium (pulmonary vein). On abdominal CT, the heart is often not included, so the fact that the PAs travel in parallel with the bronchi should be used as described in Fig. 27.1 . When there is uncertainty about whether a finding is a PE, a practical approach is to look first for additional emboli. Pulmonary emboli often occur in multiples, and if a second definite PE is present, there is no need to perseverate over a difficult finding.
Respiratory Motion Artifact
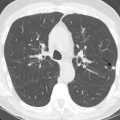
This is the most common cause of indeterminate CTPA. When the patient breathes during the CT acquisition, portions of the lung, bronchi, and PAs can overlap, and this volume averaging can mimic PE ( Figs. 27.8 and 27.9 ). This is usually easily detected by switching to lung windows, which will demonstrate blurring of the lung parenchyma and occasionally what is known as a characteristic seagull sign .
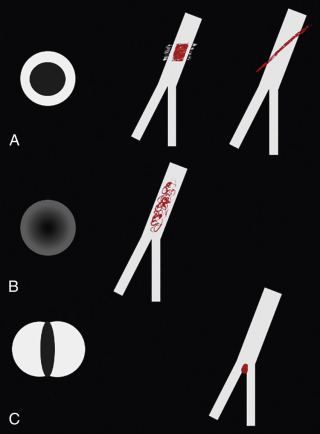
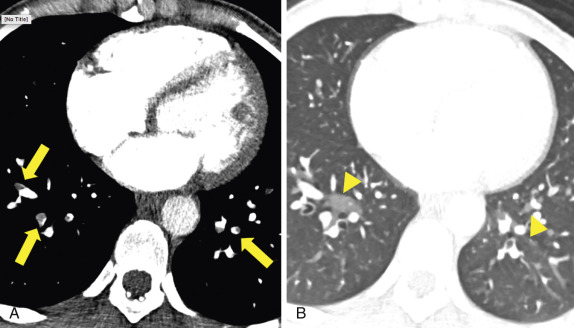
Image Noise or Quantum Mottle
This degrades image quality and is particularly detrimental for the evaluation of small segmental and subsegmental PAs. Image noise is usually an issue in obese patients who cannot raise their arms and have large pleural effusions or an elevated hemidiaphragm. Higher contrast flow rates, higher kVp and mAs settings, and thicker slice and iterative image reconstruction algorithms can help reduce image noise.
Mixing or Flow-Related Artifacts
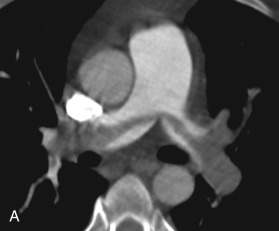
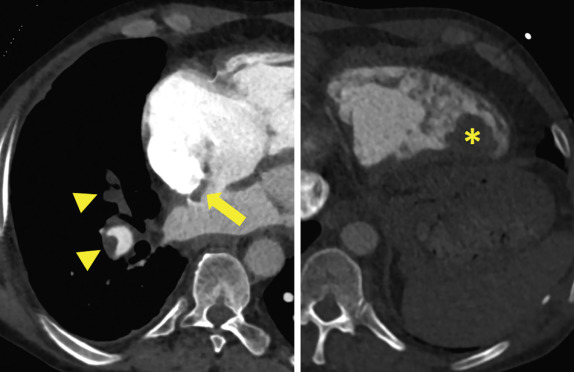
These are among the most difficult to resolve on CTPA. Transient interruption of contrast can occur if the patient performs a Valsalva maneuver or deep inspiration during the contrast injection, resulting in a transient increase in the proportion of unopacified inferior vena cava (IVC) blood emptying into the right side of the heart. This results in a portion of the PA having lower attenuation than its proximal and distal neighbors. Similarly, locally increased pulmonary vascular resistance can occur upstream of parenchymal changes, such as atelectasis or pneumonia. Flow artifacts often have ill-defined borders or demonstrate a density gradient, which can be very helpful for distinguishing from PE ( Fig. 27.10 ; see Fig. 27.8 ). When the morphologic features fail, attenuation can be helpful for differentiating flow artifact from PE. Although attenuation can vary substantially based on the scan protocol, it has been reported that small acute pulmonary emboli have a mean attenuation around 35 HU (range, 5–65 HU); chronic emboli are more dense, with a mean attenuation of 90 HU (range, 50–160 HU; Fig. 27.11 ). In general, attenuation is much less helpful than morphology for differentiating acute versus chronic PE, but it is useful for flow artifacts. The closer the attenuation is to 35 HU, the more likely is a PE. On the other hand, ill-defined margins and an attenuation near or above 90 HU favors flow artifact. Because attenuation can vary with the CTPA protocol, it is better to rely on the morphology of the filling defect first and use attenuation as supporting evidence only. When there is diagnostic uncertainty, it is reasonable to repeat CTPA.
Edge Enhancement Artifact
This results from the use of high spatial frequency reconstruction kernels (lung and bone algorithm). These so-called hard kernels improve visualization of such structures as the airways and pulmonary interstitium, but they also tend to create artifacts at the periphery of the PAs that mimic PE. Therefore, PE should be assessed using standard soft tissue reconstruction kernels.
Low-Density Mucus Plugs
Occluding bronchi surrounded by a relatively high density bronchial wall can be misinterpreted as PE. This artifact is easily resolved by following the filling defect back to the heart or trachea.
▪
Prognosis and Treatment
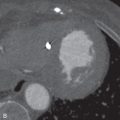
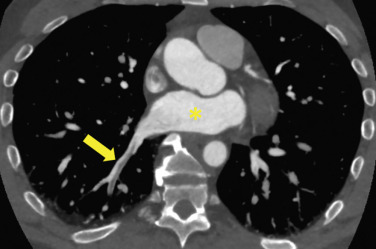
Once the diagnosis of acute PE has been made, attention should shift to prognostic findings that can help guide patient management. Death from PE occurs due to RV dysfunction and failure. The best-studied and most reliable measure of RV dysfunction on CT is a dilated right ventricle ( Fig. 27.12 ). Normally, the left ventricle should have a greater diameter than the right; when the RV/left ventricular (LV) diameter ratio is >1, the right ventricle is enlarged (see Fig. 27.2 ). A meta-analysis of 49 studies in over 13,000 patients found that an increased RV/LV diameter ratio conferred a 2.5-fold risk of all-cause mortality and a 5-fold increased risk of PE-related mortality compared to persons without an abnormal RV/LV ratio. Approximately 50% of patients with PE will have an RV/LV diameter ratio >1, and up to 25% of patients with no PE on CTPA will also have an enlarged right ventricle by this criterion. Thus RV enlargement is not a specific sign of RV dysfunction and should be interpreted in the context of clinical stability, RV hypokinesis on echocardiography, and serum biomarkers such as troponin or brain natriuretic peptide. Comparison with prior CTs can be very helpful to determine whether the right ventricle is acutely enlarged and increases specificity.