and Lori Ann Lewis1
(1)
Clinical Research Center of North Texas, Denton, TX, USA
Abstract
Although much has been written about quality control procedures in densitometry, many of these articles have been concerned with data collection in clinical research rather than patient data collected as part of medical care. Quality control, while absolutely necessary in clinical research, is no less necessary in clinical practice. The original indications for bone mass measurements from the National Osteoporosis Foundation published in 1989 and the guidelines for the clinical applications of bone densitometry from the International Society for Clinical Densitometry published in 1996 called for strict quality control procedures at clinical sites performing densitometry [1, 2]. The Canadian Panel of the International Society for Clinical Densitometry published specific guidelines for quality control procedures in 2002 [3]. Such procedures are crucial to the generation of accurate and precise bone density data. When quality control is poor or absent, the bone density data may be incorrect. The interpretation made by the physician based on that incorrect information would be in error. The medical management of the patient may be adversely affected. The patient will also have been exposed to a small amount of radiation inappropriately and wasted time and money. In clinical trials, the results from hundreds or thousands of individuals are usually averaged and conclusions based on the average values. Small errors in machine performance are made insignificant by the averaging of so many results. In clinical practice, this luxury does not exist. Decisions are made based on one measurement from one patient, which means that strict quality control in clinical practice is even more important than in clinical trials. In spite of inherently superb accuracy and precision in today’s densitometers, alterations in the functioning of the machines can and will occur. Quality control procedures to detect these alterations in machine function should be utilized by every clinical site performing densitometry regardless of the frequency with which clinical measurements are performed.
Although much has been written about quality control procedures in densitometry, many of these articles have been concerned with data collection in clinical research rather than patient data collected as part of medical care. Quality control, while absolutely necessary in clinical research, is no less necessary in clinical practice. The original indications for bone mass measurements from the National Osteoporosis Foundation published in 1989 and the guidelines for the clinical applications of bone densitometry from the International Society for Clinical Densitometry published in 1996 called for strict quality control procedures at clinical sites performing densitometry [1, 2]. The Canadian Panel1 of the International Society for Clinical Densitometry published specific guidelines for quality control procedures in 2002 [3]. Such procedures are crucial to the generation of accurate and precise bone density data. When quality control is poor or absent, the bone density data may be incorrect. The interpretation made by the physician based on that incorrect information would be in error. The medical management of the patient may be adversely affected. The patient will also have been exposed to a small amount of radiation inappropriately and wasted time and money. In clinical trials, the results from hundreds or thousands of individuals are usually averaged and conclusions based on the average values. Small errors in machine performance are made insignificant by the averaging of so many results. In clinical practice, this luxury does not exist. Decisions are made based on one measurement from one patient, which means that strict quality control in clinical practice is even more important than in clinical trials. In spite of inherently superb accuracy and precision in today’s densitometers, alterations in the functioning of the machines can and will occur. Quality control procedures to detect these alterations in machine function should be utilized by every clinical site performing densitometry regardless of the frequency with which clinical measurements are performed.
Quality control procedures used in densitometry were derived from procedures originally developed for quality control in analytical chemistry and industry [4]. The adaptation of these procedures for use in bone densitometry is generally credited to Drs. Orwoll and Oviatt [5]. The most commonly used methods are control tables, visual inspection of a Shewhart chart, Shewhart rules, and the cumulative sum chart (CUSUM). All of these methods require that a phantom be scanned to establish a baseline value and, then regularly, to establish longitudinal values.
Phantoms
Manufacturers of X-ray-based bone densitometers routinely provide phantoms for use with their machines. Some phantoms, like the anthropomorphic Hologic spine phantom, are used with densitometers from other manufacturers. Other phantoms, such as the European spine phantom (ESP) or the Bona Fide phantom, were developed independently of any one manufacturer and intended for use on multiple machines. The manufacturer-supplied phantom is often designed with the specific attributes of the manufacturer’s machine in mind, making it the preferred phantom to use with that machine. The perfect phantom that could be used on all machines to test all things does not as yet exist.
Some, but not all, manufacturers provide two phantoms to be used for different purposes. One phantom may be used for daily quality assurance functions during which the mechanical operation and calibration of the machine are tested. The second phantom may be designed to mimic a region of the skeleton and used for quality control to detect a shift or drift in BMD values.
Phantoms that attempt to replicate a particular region of the skeleton are called anthropomorphic phantoms. These phantoms are made of hydroxyapatite or aluminum. Although hydroxyapatite is preferred by the Food and Drug Administration for such a phantom, aluminum is appropriate as well since aluminum behaves very much like bone when X-rayed. The phantom may be encased in an epoxy resin or plastic block or placed within some other type of material to simulate human soft tissue. Water or uncooked rice can be used for this purpose. The perfect anthropomorphic phantom would replicate the size and shape of the bone or bones in question, have varying densities within a single bone or region, contain a range of densities likely to be encountered clinically, and be surrounded by a material that adequately mimics human soft tissue. Replicating the size and shape of the particular bone or bones and having a nonuniform density throughout the bone test the edge-detection methodology of the particular system. In other words, it tests the machine’s ability to distinguish bone from soft tissue. If the phantom bears no resemblance in size or shape to the particular bone or has very sharp, smooth edges or if the density of the material is uniform within the bone, the edge-detection program of the machine will not be adequately tested. If the material surrounding the phantom does not adequately replicate human soft tissue, once again, the ability of the machine to tell bone from soft tissue will not be not maximally tested. In order to test a system’s abilities at various levels of bone density, it is desirable to have a range of densities contained within the phantom. At the same time, this range should reflect values that are likely to be encountered in clinical practice for the test to truly be useful. Most of the manufacturer-supplied phantoms in use today have some of these attributes but not all. Which attributes are emphasized by a manufacturer generally depends on those attributes that the manufacturer wishes to test as a part of the routine quality control program for their machine.
The European Spine Phantom
The development of the European spine phantom (ESP) was one attempt to develop a more perfect spine phantom that could be used on all central devices. It was developed independently of any manufacturer under the direction of the Committee d’Actions Concertés-Biomedical Engineering (COMAC-BME) [6]. The ESP is a semi-anthropomorphic phantom. Its three vertebrae are made of hydroxyapatite and vary in density, with standardized BMDs of 500, 1,000, and 1,500 mg/cm2 [7]. The vertebrae are encased in a plastic and epoxy resin material equivalent to about 10 % fat that is molded into an oval shape with flattened sides measuring 28 cm by 18 cm. The phantom is shown in Fig. 6-1. The use of the ESP has generally been restricted to clinical research trials, primarily because of its expense. It was originally hoped that the ESP could be used to standardize BMD on any central bone densitometer. Unfortunately, this has not proven to be the case. It is an excellent phantom for cross-calibration of central DXA densitometers however.
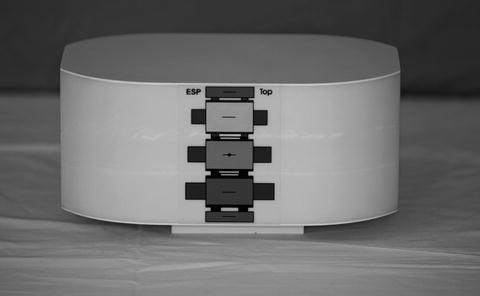
Fig. 6-1.
The European spine phantom (ESP). Photo courtesy of BioClinica Inc., Newtown, PA.
The Bona Fide Spine Phantom
The Bona Fide phantom is a calcium hydroxyapatite step wedge encased within an acrylic block. The acrylic provides a soft tissue equivalent of 26 % fat while the phantom spans a range of densities from 0.7 to 1.5 g/cm2 [8]. The block may remain in its cloth carrying case during scanning, increasing ease of use. Like the ESP phantom, the Bona Fide phantom is not manufacturer specific and is an excellent phantom for cross-calibration of central DXA devices. This phantom is shown in Fig. 6-2.
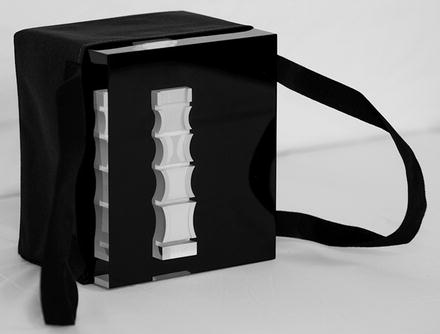
Fig. 6-2.
The Bona Fide spine phantom. Photo courtesy of BioClinica Inc., Newtown, PA.
The Hologic Spine Phantom
The new Hologic anthropomorphic spine phantom is intended for use with Hologic DXA devices. The phantom itself consists of four anatomically correct vertebrae made of cast aluminum. The vertebrae are on plastic and have similar pixel densities and total area as the human model used in the derivation of the phantom. Each Hologic spine phantom will have a factory-specified L1–L4 BMD. The new Hologic anthropomorphic spine phantom provides more precise tracking of results than the previous version. This new spine phantom from Hologic is shown in Fig. 6-3.
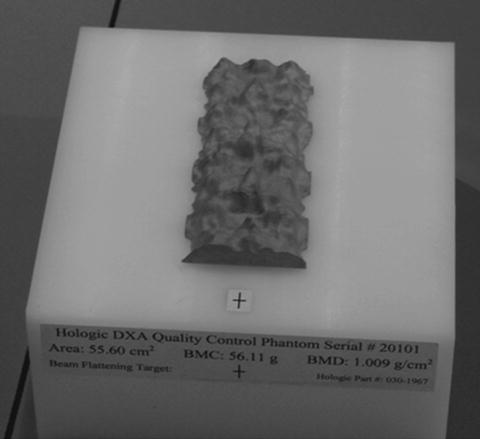
Fig. 6-3.
The Hologic spine phantom. Photo courtesy of Hologic, Inc., Bedford, MA.
The Lunar Spine Phantom
The Lunar spine phantom, shown in Fig. 6-4, is a rectangular aluminum bar which is intended to replicate the lower half of T12, all of L1, L2, L3, and L4, and the upper half of L5. Each vertebra has a different density that is achieved by varying the thickness of the aluminum. The area of each vertebra is different as well. The densities of L1 to L4 are 0.92, 1.076, 1.239, and 1.403 g/cm2, respectively. The L2–L4 BMD is 1.256 g/cm2. To simulate soft tissue, the aluminum phantom is submerged in a water bath with a depth of approximately 15 cm. The aluminum phantom is also available encased in an epoxy resin block, avoiding the necessity of a water bath and improving ease of use.
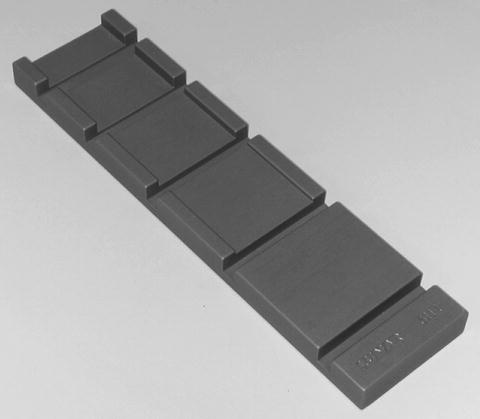
Fig. 6-4.
The Lunar aluminum spine phantom. Photo courtesy of BioClinica Inc., Newtown, PA.
The Norland Spine Phantom
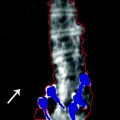
The Norland spine phantom shown in Fig. 6-5 is an anthropomorphic spine phantom composed of hydroxyapatite equivalent materials. All Norland scanners are calibrated against a primary AP spine phantom with a BMD of 0.835 ± 0.01 g/cm2 and against a primary body composition phantom [9]. Each scanner is factory-calibrated to within 1 % for BMD and to within 2 % for BMC, bone area, lean, and fat mass. A transfer AP spine phantom, such as the one shown in Fig. 6-5, is shipped with every scanner, to be used during initial and daily calibrations. As shown later in Fig. 6-8, Norland Illuminatus software monitors precision and accuracy for bone, lean, and fat using Shewhart chart protocols, which are discussed in the next section.
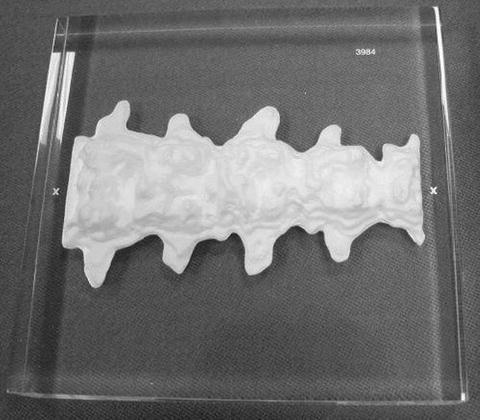
Fig. 6-5.
The Norland spine phantom. Photo courtesy of Norland, a CooperSurgical Company, Ft. Atkinson, WI.
Using the Phantom to Create Control Tables and Charts
Most daily quality assurance procedures to detect mechanical failures on today’s densitometers are automated. The program will indicate a passing or failing condition. Before outright mechanical failure occurs however, regular scanning of the quality control phantom and the application of Shewhart charts and rules or CUSUM charts can detect drifts or shifts in machine values that require correction in order to ensure continued accuracy and precision. Abrupt shifts in values are generally easy to detect. Drifts can be more subtle and, therefore, more insidious. The confirmed occurrence of either indicates that the machine is OOC or “out of control.”
Manufacturers generally recommend scanning the phantom ten times on the same day without repositioning the phantom in between studies. This is also the procedure often used as part of quality control procedures in longitudinal clinical research trials. Subsequent phantom scans are then performed at least three times a week and on every day that a patient is scanned.
The average value of the ten phantom scans should be calculated. The range that represents the average value ±1.5 % should also be calculated. The average value +1.5 % and the average value −1.5 % become the upper and lower limits of BMD within which all subsequent measurements of the phantom should fall. These upper and lower limits are called control limits. A control table as shown in Table 6-1 can then be created. One column lists the date of the phantom scan. The second column gives the actual BMD value. In the third column, a yes or no entry indicates whether the phantom BMD value fell within the established control limits.
Table 6-1
A control table. Control limits of ±1.5 % or 1.164–1.200 g/cm2 were established based on a 10-phantom average BMD of 1.182 g/cm2
Date | Phantom value | Within control limits |
|---|---|---|
10/9/2000 | 1.179 | Yes |
10/10/2000 | 1.187 | Yes |
10/11/2000 | 1.162 | No |
10/11/2000 | 1.170 | Yes |
10/12/2000 | 1.184 | Yes |
A control graph offers some advantages over the control table. A control graph is created using the same average value from ten consecutive phantom scans and control limits based on ±1.5 % of the average value. The vertical or “y” axis of the graph reflects the BMD values in g/cm2. The horizontal or “x” axis reflects time in days. The BMD that corresponds to the 10-phantom average should be indicated by drawing a solid horizontal line across the graph. The upper and lower control limit values are similarly indicated by drawing a dashed line across the graph. Subsequent phantom values are easily tracked by plotting the results on the control graph. Such a graph is called a Shewhart chart.
The results of ten scans of the anthropomorphic Hologic spine phantom that were performed on a Lunar DPX are shown in Table 6-2. The average value for the ten scans was calculated as 1.182 g/cm2. To find the upper and lower control limits, the average value was multiplied by 1.5 %. This was determined to be 0.018 g/cm2 (1.182 g/cm2 × 0.015). Therefore, the range of values within which all subsequent phantom scan values should fall is 1.182 ± 0.018 g/cm2 or from 1.164 to 1.200 g/cm2. Figure 6-6 is the Shewhart chart that was created for this set of ten phantom scans onto which subsequent phantom scan values have been plotted. The phantom BMD values obtained over time from a scanner that is operating perfectly should randomly fall on either side of the 10-phantom BMD average value but remain within the control limit boundaries of ±1.5 %. If a value falls outside the boundaries, the phantom scan should immediately be repeated. If it falls outside the boundaries again, or “fails,” the manufacturer should be contacted for additional instructions.
Table 6-2
Ten Hologic spine phantom scans performed on a Lunar DPX on the same day to establish a baseline phantom BMD value for quality control
Phantom scan | Date | BMD L1–L4 (g/cm2) |
|---|---|---|
Scan 1 | 4/22/00 | 1.181 |
Scan 2 | 4/22/00 | 1.173 |
Scan 3 | 4/22/00 | 1.176 |
Scan 4 | 4/22/00 | 1.180 |
Scan 5 | 4/22/00 | 1.190 |
Scan 6 | 4/22/00 | 1.174 |
Scan 7 | 4/22/00 | 1.189 |
Scan 8 | 4/22/00 | 1.192 |
Scan 9 | 4/22/00 | 1.177 |
Scan 10 | 4/22/00 | 1.187 |
Fig. 6-6.
A quality control chart with control limits of ±1.5 %. The average BMD of the phantom was established by scanning the phantom ten times on the same day. Arrow 1 indicates a point at which values appear to be drifting downward. Arrow 2 indicates a violation of the 1.5 % rule.
A visual inspection of the Shewhart chart can also provide more subtle clues to machine malfunction or a machine that is OOC. The pattern of the values should be reviewed to ensure that the values appear to be randomly falling on either side of the average value in addition to being within the control limits. If this randomness appears to be lost, the machine may be drifting. If an imaginary straight line drawn through the center of the phantom values is above or below the average value, a shift may have occurred. In either of these cases, the manufacturer should again be contacted for instructions. An inspection of the Shewhart chart in Fig. 6-6 suggests a possible drift in values. Arrow #1 on the graph in Fig. 6-6 indicates a point at which it appears that the phantom values are no longer randomly scattered on either side of the average but instead are concentrated below the average. This suggests that the scan values may be starting to drift downward. These situations can and do occur even though the absolute BMD values obtained from the daily phantom scans remain within the established range and other daily quality assurance procedures continue to give “PASS” indications.
The control table described earlier is simpler to create and maintain than the Shewhart chart, but the ability to visually inspect the data for drifts or shifts is lost. The creation of a Shewhart control table or chart constitutes the minimum quality control program that should be in use in every facility performing densitometry.
The creation of an average baseline phantom value by scanning the phantom ten times on the same day without repositioning may not reflect the day-to-day variability in machine values and the effects of repositioning that would be expected as the phantom is scanned over time. Several groups have consequently recommended that the baseline phantom value be established by scanning the phantom once a day for15–25 consecutive days and then averaging these 15–25 scans. It is thought that this will more accurately reflect the day-to-day variability in machine values and result in fewer “false alarm failures.” For example, the average BMD of the same Hologic spine phantom when scanned on 25 consecutive days as shown in Table 6-3 was 1.177 g/cm2 resulting in a range for the average ± 1.5 % of 1.159 g/cm2 to 1.195 g/cm2. In both cases, 1.5 % of the mean value was 0.018 g/cm2, but the range of acceptable values was different from that seen when the phantom was scanned ten times on the same day without repositioning. Figure 6-7 is the graph of subsequent scans now plotted against the baseline phantom value obtained after scanning the phantom once on each of 25 consecutive days.


Table 6-3
25 Hologic spine phantom scans performed on a lunar DPX on 25 consecutive days to establish a baseline phantom value for quality control
Related posts:
Stay updated, free articles. Join our Telegram channel
Full access? Get Clinical Tree
