Quality Dashboards


Quality Dashboards


Jeffrey P. Kanne


Business intelligence or business analytics is a field focused on mining and analyzing raw data from across many sources and presenting them in a useful manner to improve productivity, reduce inefficiencies, and identify new opportunities.1 Business intelligence has been extremely successful across many industries2 and is increasingly used in the health-care industry.3,4

Managing a radiology department requires detailed knowledge of operational, quality, safety, and fiscal information. Traditional monthly or quarterly reports are rapidly becoming a thing of the past, as the ability to aggregate data for immediate analysis is becoming or already has become a reality for many practices. Digital “dashboards” are tools that display real-time data consisting of key performance indicators (KPIs) in a useful format tailored to an individual’s specific needs. A dashboard has been defined as “a concise, context-specific display of KPIs for quick evaluation of multiple subsystems.”5 Dashboards can enable communication of the current state of a practice and can facilitate identifying specific goals for practice improvement.6


TYPES OF DASHBOARDS

Three primary types of dashboards have been described: operational, tactical, and strategic (Table 13.1). Operational dashboards provide real-time monitoring of core operational processes. In radiology, these may include radiologist report turnaround time (TAT) and patient wait time. Tactical dashboards look at trends, with data updated less frequently, usually daily or weekly. Tactical dashboards in radiology may include access (e.g., the next available appointment for a specific exam), IV contrast extravasation rates, and patient “no-show” rates. Strategic dashboards focus on KPIs related to the overall enterprise and are used to monitor and reflect on common goals. In a radiology department, a strategic dashboard might present data on patient satisfaction, referring physician satisfaction, and financial health.


GOALS OF DASHBOARDS

The primary reason for developing a dashboard should be focused and defined upfront. Limiting objectives can allow managers to quickly identify critical issues and allocate appropriate resources to key issues. Objectives usually fall into one of three categories: financial, operational, and quality (Table 13.2).7,8 Common financial
KPIs include cost per relative value unit (RVU), collections by modality, days in accounts receivable, actual expenses, and total revenue. Operational KPIs include total examination volume, examination volume per modality, and examination volume per location. Quality KPIs include TAT, accuracy of interpretation (peer review), correct exam, patient access, and prompt communication of critical tests and critical results.6,9


Table 13.1 TYPES OF QUALITY DASHBOARDS.


Type of Dashboard


Function


Examples in Radiology


Operational


Real-time monitoring of core operational processes


Report turnaround time


Patient wait time


Tactical


Monitor trends in operations


Access


IV contrast extravasation Patient “no-show” rate


Strategic


Monitor and reflect on enterprise goals


Patient satisfaction


Referring physician satisfaction


Financial health


Table 13.2 TYPES OF KEY PERFORMANCE INDICATORS (KPIs).


Type of KPI


Examples in Radiology


Financial


Cost per relative value unit


Collections by modality


Days in accounts receivable


Actual expenses


Total revenue


Operational


Total examination volume


Examination volume by modality


Examination volume by location


Quality


Report turnaround time


Accuracy of interpretation (peer review)


Correct patient imaged


Correct exam performed


Correct side imaged


Patient access


Communication of critical tests and critical results


DESIGNING A DASHBOARD

For a dashboard to be useful, it must contain meaningful information that can be acted upon promptly. Thus, a clear mission must be in place when designing a dashboard (Fig. 13.1). First, a team of major stakeholders should be assembled, consisting of key leaders including physicians, nurses, technologists, and information technology (IT), financial, and operations managers.10 Having representation from all aspects of a practice can ensure that common goals are set and are aligned with the goals of the overarching organization, that appropriate KPIs are included, and that functionality can meet expectations. Furthermore, investing in the initial planning stage can reduce both dashboard development time and need for redesign.11,12


FIG. 13.1Process of creating a quality dashboard. KPI, key performance indicator.


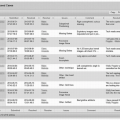
FIG. 13.2 • Example display of critical result reporting, a regulatory requirement put forth by The Joint Commission.

After assembling the dashboard design team and defining the goals of the dashboard, specific KPIs need to be selected to include on the dashboard. Chosen KPIs should be aligned to the goals of the dashboard, relevant to the specific practice, and draw from data that can be readily obtained.13,14,15 KPIs that are part of regulatory requirements, such as those needed for accreditation and credentialing, should be flagged and included on the dashboard so that these can be actively monitored and reported on (Fig. 13.2).3,13 Having too few KPIs can lead to a dashboard with little utility, whereas selecting too many KPIs can result in a dashboard that is too “busy” to be useful for review at a glance. A dashboard consisting of 15 to 25 KPIs is optimal.7

Only gold members can continue reading. Log In or Register to continue

Stay updated, free articles. Join our Telegram channel

Oct 14, 2018 | Posted by in GENERAL RADIOLOGY | Comments Off on Quality Dashboards

Full access? Get Clinical Tree

Get Clinical Tree app for offline access