Intracellular fat accumulation is common feature of liver disease. Intracellular fat (steatosis) is the histologic hallmark of nonalcoholic fatty liver disease but also may occur with alcohol abuse, viral hepatitis, HIV and genetic lipodystrophies, and chemotherapy. This article reviews emerging MR imaging techniques that attempt to quantify liver fat. The content provides an overview of fatty liver disease and diseases where fat is an important disease feature. Also discussed is the current use and limitation of nontargeted biopsy in diffuse liver disease and why quantitative noninvasive biomarkers of liver fat would be beneficial.
Fat deposition is a common condition of the liver. Fat is the histologic hallmark of nonalcoholic fatty liver disease (NAFLD) but also may occur with alcohol abuse, viral hepatitis, HIV and genetic lipodystrophies, and chemotherapy. This article reviews emerging MR imaging techniques that attempt to quantify liver fat. The content is divided into the following sections:
- •
Overview of fatty liver disease and diseases where fat is an important disease feature
- •
Review of the current use and limitation of nontargeted biopsy in diffuse liver disease and why quantitative noninvasive biomarkers of liver fat and iron would be beneficial
- •
Description of current state-of-the-art methods for quantifying fat with MR imaging, including remaining challenges and unsolved problems.
After reading this content, readers should understand the scope of diffuse liver disease in regards to hepatic steatosis and the limitations of biopsy, and be familiar with emerging quantitative MR imaging methods for measuring liver fat.
Intracellular fat (hepatic steatosis)
Steatosis Is an Important Feature of Liver Disease
Hepatic steatosis is the abnormal and excessive intracellular accumulation of fat in hepatocytes, primarily as triglycerides. Long considered an incidental consequence of other conditions, such as diabetes or obesity, steatosis is now recognized as having a causative role in important hepatic and systemic disorders.
For example, NAFLD is present in 20 to 80 million Americans and is the most common chronic liver disease in the United States. Steatosis is the instigating process in NAFLD and can lead to cirrhosis. Free fatty acids, the substrate for triglyceride formation, trigger cell death by inducing oxidative stress, provoking production of cytokines and reactive oxygen species, and activating apoptosis, potentially resulting in progressive hepatic disease. Studies have shown that 5% to 15% of patients with NAFLD present with established cirrhosis on liver biopsy and that 4% to 5% of individuals with isolated steatosis eventually developed cirrhosis. Steatosis has also been shown to worsen the course of viral liver disease; in chronic hepatitis C infection, steatosis may reduce the efficacy of antiviral therapy and accelerate disease progression. Furthermore, steatosis reduces hepatocellular functional reserve and contributes to postoperative hepatic failure after liver transplantation or resection.
Emerging evidence suggests that hepatic steatosis increases risk of malignancy. The risk of hepatocellular carcinoma (HCC) is particularly high; 7% of patients with NAFLD-related cirrhosis developed HCC over a 10-year timeframe. Because of the high prevalence of NAFLD in the general population, it is possible that more than 50,000 Americans will eventually develop NAFLD-related HCC. Recent reports describe HCC in patients with NAFLD without fibrosis or cirrhosis, suggesting that hepatic fat may have direct carcinogenic effects.
Hepatic steatosis may have a causative effect and contribute to the development of diabetes through interference with insulin signaling and may be the pathogenic link between obesity and its metabolic complications. In separate studies, 20% to 50% of individuals with steatosis subsequently became diabetic. Furthermore, cardiovascular disease is the most common cause of morbidity and death in patients with NAFLD. This association has previously been attributed to comorbidities of NAFLD (obesity, dyslipidemia, hypertension, and diabetes) rather than NAFLD itself, but new data show that NAFLD is as an independent risk factor for cardiovascular mortality. Of particular concern is that the increased cardiovascular mortality associated with NAFLD begins at age 45.
Treatment of Fatty Liver Disease
Liver fat is a meaningful marker of, and a contributor to, both hepatic and systemic morbidity and mortality. Hepatic steatosis is not a benign process and has important implications for many important diseases, including cancer, diabetes, and cardiovascular disease. Fortunately, steatosis can be reversible with intervention, and reduction in liver fat may diminish many of its associated risks.
Weight loss, through exercise and diet, is central to improvement of obesity-related fatty liver disease although the precise nature of the relationship between weight loss and liver steatosis is poorly understood. Moreover, most NAFLD patients are unsuccessful at achieving sufficient weight loss and often other means are necessary. Laparoscopic gastric banding (LAGB), for example, has been demonstrated to be an effective surgical treatment of obesity and has been shown to reduce liver fat.
New pharmacologic treatments of NAFLD that target its underlying insulin resistance have recently emerged. Lin and colleagues demonstrated a marked decrease in steatosis in ob/ob mice, a leptin-deficient mouse model of steatosis and insulin resistance, when treated with metformin, a member of the biguanide drug class known to improve insulin sensitivity. Recently, Bugianesi and colleagues demonstrated a significant decrease in hepatic steatosis in patients treated with metformin. In addition, it has been shown recently that NAFLD patients treated with pioglitazone show improved hepatic steatosis. Pioglitazone is a member of the thiazolidinedione drug class and, like metformin, improves insulin sensitivity.
Based on results such as these, the National Institute of Diabetes and Digestive and Kidney Diseases Clinical Research Network in Nonalcoholic Steatohepatitis (NASH) has two trials nearing completion for assessment of new treatments of NAFLD. The PIVENS trial compares the efficacy of pioglitazone (vs vitamin E or placebo) in adults, whereas the TONIC trial evaluates the efficacy of metformin (vs vitamin E or placebo) in children. Assessment of steatosis relies on biopsy, limited to the beginning and end of these trials due to the expense and risks associated with biopsy. Accurate measurement of steatosis with a quantitative imaging–based method in these studies would have permitted frequent evaluation with a greatly improved safety profile and reduced expense, tracking the time course of steatosis during each trial. Such methods could potentially transform the translation of new therapies from experimental drugs into clinical practice.
Quantification of Liver Fat Is Important
Because hepatic steatosis is a pathogenic, potentially reversible condition even in severe cases, there is an urgent need, in both clinical and research arenas, to detect its presence and to assess its severity.
Assessment of hepatic steatosis for clinical care requires not only diagnosis but also grading of severity. The relevant classification threshold depends on the clinical context and may vary widely, from the standard 5% steatosis threshold often used for defining hepatic steatosis to the 30% threshold for exclusion of liver transplantation donors. Moreover, accurate quantification is necessary for grading steatosis and for longitudinal monitoring of patients.
In patients with known or suspected NAFLD, physicians often recommend weight loss to prevent the harmful consequences of hepatic steatosis. The amount of weight loss required to resolve NAFLD is unknown, however. The American Gastroenterological Association recommends a 5% to 10% reduction in body weight for obesity-related NAFLD. This recommendation is based on reductions in indirect variables, however, such as cholesterol and blood pressure, not on reduction in liver fat. There is no solid evidence showing that 5% to 10% weight loss effectively treats NAFLD because there have been no prospective studies using accurate quantitative measurements to answer this fundamental question. Accurate and precise quantification of liver fat is required to guide treatment of NAFLD by evidenced-based weight loss.
Liver fat is also a highly active topic of investigative interest. The National Institute of Health’s Research Portfolio Online Reporting Tools ( ) lists 122 grants under “hepatic steatosis” and the Web site, clinicaltrials.gov , lists 128 studies related to this topic. Major objectives for studies on hepatic steatosis include understanding its causation, delineating its consequences, and defining its response to therapeutic intervention.
In summary, accurate and precise quantification of liver fat is important for diagnosis and treatment of patients with NAFLD and facilitates research on this condition.
Percutaneous Liver Biopsy
Nontargeted percutaneous liver biopsy with direct histologic visualization is the current gold standard for diagnosing hepatic steatosis, permitting comprehensive evaluation not only of liver fat content but also of other key histologic features, such as steatosis zonality, fat droplet size (macrovesicular vs microvesicular), iron overload, inflammation, cellular injury, and fibrosis. Evaluation of disease activity and staging of fibrosis is generally determined by the specific disease. For example, many centers use the grading/staging system proposed by Brunt and colleagues for the evaluation of steatohepatitis (NASH). The Brunt scoring system is a semiquantitative score of necroinflammatory disease activity based on a combination of steatosis, inflammation, and ballooning degeneration as well as a staging score of fibrosis severity. More recently, Kleiner and colleagues proposed a modified scoring system for NAFLD, the NAFLD activity score, to encompass a broader spectrum of NAFLD that includes isolated steatosis and not just steatohepatitis. The METAVIR scoring system is commonly used to provide semiquantitative disease activity in patients with hepatitis C.
Steatosis is typically graded on a 0–3 scale based on the number of cells with intracellular vacuoles of fat :
Grade 0 (normal) = up to 5% of cells affected
Grade 1 (mild) = 5% to 33% of cells affected
Grade 2 (moderate) = 34% to 66% of cells affected
Grade 3 (severe) = 67% or greater of cells affected
The percentage of cells affected with intracellular fat does not correspond directly to the MR imaging fat fraction (discussed later).
A major limitation of liver biopsy is lack of representation of the liver as a whole because most features of diffuse liver disease (steatosis, fibrosis, iron overload, and so forth) are inherently heterogeneous, and, therefore, biopsy suffers from sampling variability. The underlying assumption that biopsy, which collects a tissue sample 1/50,000 the overall size of the liver, is representative of the entire organ is currently being challenged. A recent study by Ratziu and colleagues in 51 patients undergoing two closely localized biopsies (30° to 45° apart) demonstrated a κ-reliability score of 0.64 for grading steatosis, which indicates poor agreement, inadequate for reliable grading. Other studies have shown significant sampling variability when more than one sample is analyzed. Vuppalanchi and colleagues, recently reported a dependence of diagnosis of NAFLD on the length and number of liver biopsy samples. The degree of sampling error depends not only on biopsy size but also on the stage of liver disease. Biopsy also carries significant risk of complications leading to hospitalization (1% to 3%) and death (1:10,000) and necessitates several hours of postprocedure recovery. Thus, biopsy is impractical to diagnose or monitor the many tens of millions of Americans with or at risk for diffuse liver disease. Biopsy is also not feasible in many research studies, including epidemiologic and genetic studies.
Ultrasound
Ultrasound, the most common imaging modality used to evaluate hepatic steatosis, infers the presence and severity of liver fat based on qualitative sonographic features, including liver echogenicity, echotexture, vessel visibility, and beam attenuation. Ultrasound is operator and machine dependent and suffers from poor repeatability and reproducibility. The positive predictive value of ultrasound for detection of steatosis is only 62% to 77%. Moreover, ultrasound is particularly challenging in obese patients, the population at highest risk for the disease, due to impaired beam penetration and limited liver visualization.
CT
CT, a widely available modality capable of rapid volumetric imaging, can provide objective assessment of hepatic X-ray attenuation, which is related to liver fat content. The presence of iron, copper, glycogen, fibrosis, or edema confounds attenuation values, leading to errors in fat quantification and CT has low sensitivity for mild to moderate steatosis. The use of some drugs, such as amiodarone or gold, is also well known to increase the attenuation of liver and confounds the ability of CT to quantify fat. Moreover, use of ionizing radiation by CT precludes its use for quantifying liver fat in children or for repeated follow-up in adults.
Magnetic Resonance Spectroscopy
Magnetic resonance spectroscopy (MRS) noninvasively measures proton signals as a function of their resonance frequency. The signal intensity at frequencies corresponding to water or fat can be quantified, and the fat-signal fraction (FSF) can be calculated. When performed properly, MRS is sensitive to even trace amounts of liver fat, and MRS is accepted by many as the most accurate noninvasive method to quantify liver fat. MRS has important limitations, however, that preclude its widespread clinical and research implementations. It is restricted in spatial coverage. Sampling error is difficult to avoid, which is problematic for longitudinal monitoring. It is time consuming to perform, requires expertise to analyze, and is generally available only at academic centers. Imaging-based methods that evaluate the entire liver and that are simple to perform and analyze are preferable.
The acceptance of MRS as an accurate method derives primarily from landmark publications in the 1990s by Longo and colleagues, Thomsen and colleagues, and Szczepaniak and colleagues. These investigators conducted seminal studies showing proof of concept that MRS quantitatively assesses liver fat content using independent tissue-based reference standards. Although groundbreaking, these investigations were small preclinical or clinical studies; multicenter validation studies in human subjects have not yet been performed. Thus, although MRS is used as the reference standard for most preliminary studies of emerging quantitative MR imaging methods (discussed later), more rigorous validation is needed. Such validation necessitates comparison with tissue triglyceride concentration as an independent tissue-based reference standard.
Quantification of fatty accumulation in the liver with MR imaging
Conventional In-Phase and Opposed-Phase Imaging for Detection of Fat
Conventional MR imaging has been used to detect liver fat for more than 25 years. As with MRS, MR imaging exploits the difference of the resonance frequencies between water and fat proton signals. By acquiring the images at echo times at which water and fat signals are approximately in-phase (W + F) and opposed-phase (W – F), volumetric liver fat detection is possible based on the relative signal loss on opposed-phase (also known as out-of-phase) images.
Echo times for IOP imaging are based on the relative chemical shift between water and the methylene peak (−CH 2 −) of fat. At 1.5T and at body temperature, this peak resonates approximately −217 Hz slower than water (−434 Hz at 3.0T). Thus, at 1.5T (3.0T) the main peak of fat is in-phase every 360° of phase between water and fat or every 4.6 ms (2.3 ms) (ie, 4.6 ms [2.3 ms], 9.2 ms [4.6 ms], 13.4 ms [6.9 ms], and so forth). Likewise, at 1.5T (3T), water and fat have opposed-phase at 2.3 ms (1.15 ms) and at every subsequent multiple of 4.6 ms (2.3 ms) (ie, 2.3 ms [1.15 ms], 6.9 ms [3.5 ms], 11.5 ms [5.8 ms], and so forth).
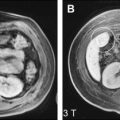
Fig. 1 shows several examples of patients with hepatic steatosis detected with in-phase and opposed-phase (IOP) imaging. A wide variety of patterns, including diffuse steatosis, lobar, geographic, perivascular, and even diffuse steatosis with mass-like sparing, among others, have been described. IOP imaging is widely accepted as the gold standard noninvasive imaging method for qualitative detection and characterization of fat within the liver.
Several investigators have explored the extension of IOP imaging toward quantification of fat. Unlike CT where the pixel value directly reflects X-ray attenuation (in Hounsfield units), the signal intensity in MR images is arbitrary and depends on receiver gain and the sensitivity of receive radiofrequency coils (B 1 sensitivity). Therefore, normalization of the signal from MR images is a helpful way to remove the influence of coil sensitivity and, therefore, avoids errors introduced by inhomogeneous coil sensitivity when muscle or spleen is used as an internal calibration or normalization measurement. FSF ( η ) can be calculated as in Equation 1 :
where W and F are the signal contributions from water and fat. The FSF only reflects the concentrations fat if the signals from W and F are corrected for confounding factors (discussed in detail later).
For IOP imaging, even though the water and fat signals are not separated, an FSF map can be calculated, noting that in phase, IP = W + F and opposed phase, OP = W–F ( Equation 2 ):
Fig. 2 illustrates how IOP imaging can be used to calculate an FSF image, or map, through combination of the in-phase (IP) and opposed-phase (OP) images.
Using this approach, it only possible to achieve a dynamic range of 0 to 50% FSF when magnitude images are used. This occurs because of a natural ambiguity with magnitude-only images with FSF greater than 50%. For example, the opposed-phase signal in a liver with 40% fat is the same as from a liver with 60% fat. This ambiguity can only be resolved with additional information, such as complex-phase information used with chemical shift–based water-fat separation methods or through elegant methods that exploit differences in T 1 between water and fat. These methods all require acquisition of additional images beyond IOP imaging. Fat fractions greater than 50% are uncommon in the liver.
As discussed later, however, there are multiple confounding factors that corrupt the ability of conventional IOP imaging to quantify fat, and this is particularly true at low fat fractions, where confounding factors have their largest impact and compromise the ability of IOP to quantify fat.
Conventional Fat-Suppressed Imaging for Detection of Liver Fat
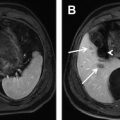
Another approach for the detection liver fat is to compare images acquired with and without fat suppression. Fat-suppression pulses have the effect of suppressing fat signal, decreasing the overall liver signal in a fat-containing liver. This is true for both T 1 -weighted gradient-echo and T 2 -weighted fast spin-echo (FSE) methods. Qayyum and colleagues demonstrated better correlation between signal loss in fat-suppressed, T 2 -weighted FSE imaging with biopsy steatosis grade than with IOP imaging. Fig. 3 shows an example of a patient with severe steatosis seen on IOP imaging. The signal from the liver in the corresponding fat-suppressed, T 2 -weighted FSE is dark compared with the spleen in contradistinction to the T 2 -weighted, s ingle- s hot FSE image (without fat suppression) where the liver appears relatively bright due to the presence of fat. Fig. 4 shows a second example, in a patient with geographic fatty sparing seen on IOP imaging. The signal in the region of sparing is relatively bright on the T 2 -weighted image compared with the surrounding liver. This occurs because the fat-suppression pulse suppresses the fat signal in the surrounding liver, leaving the region of sparing relatively unaffected.
Complex Chemical Shift–Based Water-Fat Separation Methods can Measure 0 to 100% Fat
One approach to creating a proton density fat fraction (PDFF) map is to use a chemical shift–based water-fat separation method that separates the signal from water and fat into water-only and fat-only images. Just as in-phase and opposed-phase images are coregistered, separated water and fat images are coregistered and can be recombined into an FSF map. Fully separating water and fat signals (unlike in magnitude methods, such as IOP imaging), permits achievement of a full dynamic range of 0 to 100% FSF. Fig. 5 contains a schematic overview of how the separated water and fat signals can be recombined into an FSF map. This particular example was generated using the chemical shift–based water-fat separation method described by Reeder and colleagues. Fig. 5 also illustrates how fat fraction maps can be displayed in gray scale or color scale.
As with FSF maps generated with IOP imaging, FSF maps generated with chemical shift–based water-fat separation methods are independent of B 1 coil sensitivities that produce signal variation across an MR image. Just as IOP fat fraction maps do not directly measure the concentration of fat in the liver, neither does the FSF map generated with chemical shift–based water-fat separation methods. In order for the FSF map to reflect the concentration of fat, it must be corrected for confounding factors (discussed later).
Emerging MR Imaging Methods Measure Proton Density Fat Fraction
Technical development in recent years has transformed qualitative MR imaging techniques into rigorous quantitative methods. Accurate separation of the signal from mobile protons in fat from other mobile protons (ie, water) and correction for all factors that influence MR signal intensity permit calculation of PDFF. The authors define PDFF as the density of hydrogen protons attributable to fat, or the fraction of unconfounded proton signal from mobile fat, normalized by the total hydrogen proton density from all mobile proton species. This is equivalent to the ratio of the total unconfounded nuclear magnetic resonance (NMR) visible signal from fat protons, normalized by the total unconfounded NMR visible signal from fat and water protons. PDFF is a standardized, objective magnetic resonance–based measurement of an inherent tissue property. Accurate measurement of PDFF has the potential to provide a platform-independent biomarker unaffected by technical or biologic variability. To provide an accurate estimate of PDFF, the following five confounders must be addressed:
- 1.
T 1 bias
- 2.
T 2 decay
- 3.
Spectral complexity of fat
- 4.
Noise bias
- 5.
Eddy currents.
T 1 bias
T 1 bias occurs if the image acquisition is T 1 weighted and the two species (water and fat) have different values for T 1 . T 1 -weighted methods artificially amplify the relative signal of the shorter T 1 proton species (fat), referred to as T 1 bias. Methods to avoid T 1 weighting or correct for differences in T 1 are essential—otherwise, the apparent fat fraction is dependent on sequence parameters, such as repetition time, for example. Use of low flip angle gradient imaging to avoid T 1 weighting is the strategy generally adopted by most emerging approaches that attempt to avoid T 1 -related bias ( Fig. 6 ).
T 2 decay
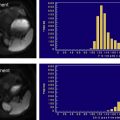
Nearly all MR imaging fat-quantification methods acquire images at different echo times, during which T 2 decay occurs. Even in normal livers, T 2 decay corrupts estimates of fat content. Bias from T 2 decay is amplified in iron overload, which can coexist with fat in diffuse liver disease. The confounding effect of T 2 can be removed by either incorporating T 2 into the signal model used to separate water and fat, thereby correcting for T 2 decay as part of the fitting, or by measuring T 2 separately and correcting for the effects of T 2 . Fig. 7 demonstrates the importance of T 2 correction in a patient with steatosis before and after the injection of superparamagnetic iron oxide (SPIO) particles that accumulate in the Kupffer cells in the liver, simulating hemosiderosis. Without the use of T 2 correction, the PDFF is underestimated by the presence of liver iron.
Spectral complexity of fat
At clinical magnetic field strengths, fat has at least six distinct spectral peaks at different resonance frequencies. Accurate quantification should account for proton signal from all fat peaks. Fig. 8 shows a spectrum of pure fat (vegetable oil) measured at 3.0T, demonstrating that a considerable fraction of signal from fat hydrogen protons is found at peaks remote from the main methylene (−CH 2 -) fat peak (at −434 Hz). At least two of the fat peaks lie close to the water resonance and would not be suppressed with fat-saturation methods and would be incorrectly mapped to water signal in chemical shift–based fat-water imaging methods that (incorrectly) model fat as a single resonance peak. In Fig. 8 , the chemical shifts of the fat peaks relative to water are shown in Hertz for 3.0T and in parts per million, based on the work of Hamilton and colleagues In this work, Hamilton also determined the relative amplitudes of the fat peaks from human liver fat, which are relatively constant across large groups of patients. From this work, the relative amplitudes and frequencies (at 3.0T) of these peaks are approximately 4.7% (77 Hz), 3.9% (−64 Hz), 0.6% (−249 Hz), 12.0% (−332 Hz), 70.0% (−434 Hz), 8.8% (−485 Hz). The amplitudes are the same at 1.5T, although the resonance frequencies relative to water scale linearly with field strength.
Conventional IOP imaging and conventional chemical shift–based water-fat separation methods assume that fat has a single NMR peak, leading to inadvertent misidentification of some signal from fat as arising from water. This leads to significant quantification errors. To account for the additional peaks of fat, spectral modeling of fat can easily be incorporated, if the frequency and relative amplitudes of the six fat peaks are known a priori. This strategy, referred to as spectral modeling, is based on the biochemical structure of human liver triglycerides and has been developed independently by Bydder and colleagues and Yu and colleagues based on an algorithm for chemical shift species separation for hyperpolarized 13 C imaging.
Fig. 9 demonstrates the effects of multiple fat peaks with a simulation of the signal evolution that occurs in pure fat at 1.5T, ignoring T 2 decay. A flat line would be expected in pure fat if it had a single NMR peak. In reality, the multiple peaks of fat destructively interfere with one another, attenuating the signal, even in pure fat. For this reason, except at TE = 0 or at a spin echo, fat is never in phase with itself. Considering the multiple peaks of fat, the terms, “in-phase” and “opposed-phase”, lose their meaning, because these terms can only be used when referring to the relative phase of two NMR species (water and single-peak fat, for example). For historical reasons, this article uses this terminology in the context of the relative phase between water and the main methylene peak (−CH 2 −) of fat at −217 Hz (−434 Hz) at 1.5T (3.0T).
Fig. 10 demonstrates the combined effects of T 2 decay and spectral complexity of fat in a simulation for a fat-water mixture with 40% fat at 1.5T. The plot includes the expected signal behavior when (1) fat is approximated as a single NMR peak and no T 2 decay, and when fat is modeled with multiple peaks with (2) no T 2 decay; (3) T 2 = 25 ms (normal ); and (4) T 2 = 10 ms (simulating coexisting iron overload). Calculating the apparent fat fraction using the IOP fat fraction calculation ( Equation 2 ) for these four cases demonstrates an apparent fat fraction of 40% (as expected), 35%, 33%, and 31%, respectively. This simulation demonstrates that spectral complexity of fat and T 2 (even normal values of T 2 ) results in large discrepancies between the true fat fraction and the apparent fat fraction measured with conventional IOP imaging. When fat fractions are very low, the presence of T 2 decay can even lead to apparent fat fractions that are negative, which have no physical meaning. The influence of T 2 decay and spectral complexity of fat has been described in detail in phantom experiments reported recently by Hines and colleagues. In summary, accurate quantification of fat is not possible with conventional IOP imaging unless T 2 decay and spectral complexity of fat are considered.
Noise bias
Recombination of separated water and fat images into a fat fraction image can cause bias at low fat fractions when using chemical shift–based water-fat separation methods. Noise bias occurs if magnitude water and fat images are recombined, because areas of low signal (eg, fat signal from a liver with no fat) have only positive noise after the magnitude operation. Noise bias is relevant to methods that fully separate water and fat signals before magnitude reconstruction and can be avoided using phase-constrained or magnitude discrimination methods developed by Liu and colleagues. Methods that create fat fraction maps from IOP images (see Equation 2 ) are more immune to these effects except near fat fractions of 50% when the signal intensity of opposed-phase images approaches zero and noise bias has an impact on fat fraction calculations. Because low fat fractions (near zero) are more clinically relevant, noise bias effects are more important in chemical shift–based water-fat separation methods.
Eddy currents
Rapidly switching gradients lead to phase shifts on complex images acquired at different echo times. These phase shifts can corrupt estimates of fat fraction. Eddy currents affect methods that use phase information in images acquired at different echo times to quantify fat, such as chemical shift–based water-fat separation methods. Correction for eddy current can be performed using a hybrid complex–magnitude approach recently reported by Yu and colleagues Magnitude-based methods, including conventional IOP imaging and other magnitude-based methods, discard all phase information and should be immune to the effects of eddy currents.
Magnetic field strength is another potential confounding factor, because it is well known that T 1 and T 2 change with field strength and that the chemical shift of the fat peaks scales linearly with field strength. Therefore, if low flip angles are used to avoid T 1 bias and T 2 correction is performed with spectral modeling accounting for changes in field strength, then field strength is not expected to influence the measurement of fat fraction.
Quantitative Fat Fraction Imaging Methods
After correction for the five confounding factors, the FSF and PDFF are equivalent. In recent years, several research groups have proposed advanced MR imaging techniques that address one or more of these confounding factors (as shown in Table 1 ). For simplification, the corrected fat quantification techniques may be separated into two categories: (1) magnitude based and (2) complex based.
| MR Imaging Technique | Confounders Addressed | Output | Refs | |||||
|---|---|---|---|---|---|---|---|---|
| T 1 | T 2 | Fat Spectrum | Noise Bias | Eddy Currents | ||||
| Magnitude based | T 1 w IOP (conventional MR imaging) | No | No | No | N/A | N/A | FSF | |
| Low-FA IOP | ✓ | No | No | T 1 -independent FSF | ||||
| T 1 w multiecho | No | ✓ | No | T 2 -corrected FSF | ||||
| Low-FA multiacquisition IOP | ✓ | ✓ | No | T 1- independent, T 2 -corrected FSF | ||||
| Low-FA multiecho with T 2 correction and spectral modeling (MRI-M) | ✓ | ✓ | ✓ | PFDD | ||||
| Complex based | T 1 w triple echo | No | No | No | No | No | FSF | |
| Low-FA triple echo | ✓ | No | No | ✓ | No | T 1 -independent, noise bias–corrected FSF | ||
| Low-FA multiecho | ✓ | ✓ | No | ✓ | No | T 1 -independent, T 2 -corrected FSF | ||
| Low-FA triple echo with spectral modeling | ✓ | No | ✓ | ✓ | No | T 1 -independent, noise bias–corrected, spectrally modeled FSF | ||
| Low-FA multiecho with T 2 correction, spectral modeling, and eddy current correction (MRI-C) | ✓ | ✓ | ✓ | ✓ | ✓ | PFDD | ||
Related posts:
 MR Imaging of Hepatocellular Carcinoma
Diffusion-Weighted MRI and Liver Metastases
Hepatic Perfusion Imaging: Concepts and Application
MR Imaging of Hepatocellular Carcinoma
Diffusion-Weighted MRI and Liver Metastases
Hepatic Perfusion Imaging: Concepts and Application
 Imaging at Higher Magnetic Fields: 3 T Versus 1.5 T
 Magnetic Resonance Imaging of the Liver: Sequence Optimization and Artifacts
 Functional Magnetic Resonance Imaging of the Liver: Parametric Assessments Beyond Morphology
Stay updated, free articles. Join our Telegram channel

Full access? Get Clinical Tree


