Fig. 12.1
Calcified plaques on left anterior descending quantified with Agatston score and volume evaluation
(a)
One, if the density plaque (DP) is 130 < DP < 199
(b)
Two, if 200 < DP < 299
(c)
Three, if 300 < DP < 399
(d)
Four, if DP ≥ 400
The total calcium score (CaS) according to Agatston is calculated summing all the scores of all CLs present in epicardial coronary arteries (Fig. 12.1) [14].
Recent guidelines for interpretation of MDCT state that when reporting, the calcium score for each vessel and a total calcium score should be written [20].
Different papers showed an interscan variability too large to make monitoring annual change meaningful on an individual basis, so on other techniques of calcium quantification have been proposed, such as calcium volume (CV) and calcium mass (CM) [21]. CV is calculated tracing a ROI around each CL, then the software multiplies each area with slice thickness. The total sum is the CV in mm3 (Fig.12.1). CM is calculated tracing a ROI around each CL, then the software multiplies every plaque area with its density in HU; finally, the sum of all measurements is multiplied by a scanner and scan protocol-specific calibration factor allowing for calculating the absolute mass of coronary calcium in mg calcium hydroxyapatite (CaHA) [22–24]. Of worth, the volume and mass score are less commonly used in clinical practice, since there is no current validation data for this measures (no normograms and outcome studies) and the Society of Cardiovascular Computed Tomography suggests these scores should be accompanied by reporting of the more traditional Agatston score [20]; furthermore non-contrast CT is nowadays considered as appropriate for intermediate coronary heart disease (CHD) risk patients and for a specific subgroup of low-risk patients in whom a family history of CHD was present in relatives at a young age [20].
3 Quantification of Coronary Artery Stenosis
Molecular and cellular events leading to atherosclerosis, such as lipoprotein deposition, inflammation, smooth muscle cell proliferation, apoptosis, necrosis, calcification, and fibrosis, cause specific geometric and compositional changes in coronary vessels [25, 26]. Some of these changes, such as increased plaque volume, positive remodeling, lipoprotein deposition in the form of non-calcified plaques, and calcification, can be detected by contrast-enhanced MDCT [26].
MDCT has gained acceptance as an accurate, noninvasive tool to evaluate coronary artery disease, in most of the cases with a dichotomous score assessment (cutoff value 50%) for significant stenosis [1–3, 27] (Fig. 12.2); however, the visual score assessment represents a major limitation of this technique and quantitative analysis of coronary stenosis is aimed to overcoming this drawback. With recent imaging technology and user-friendly post-processing tools, a quantitative evaluation of stenosis, which may be preferred in terms of diagnostic accuracy and reproducibility, has become feasible. Recent papers explored the role of MDCT in quantify coronary artery stenosis; in most of the cases CCA was considered the reference standard but last literature confirmed the limitation of CCA in the assessment of complex vasculature anatomy [28]. Because of its tomographic nature, MDCT allows the display of coronary vessels in unlimited projections, including cross-sectional views and three-dimensional vessel reconstructions and studies using intravascular ultrasound (IVUS) as the gold standard found superior accuracy for MDCT stenosis quantification compared to CCA [28–30].
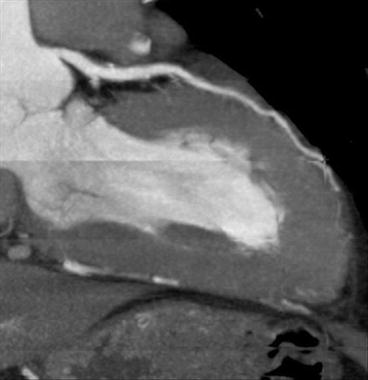
Fig. 12.2
MPR thick of non-calcified eccentric plaque positively remodeled lying on distal left main and proximal LAD, without significant stenosis; visual assessment = caliper reduction <50%
Different geometrical parameters are nowadays used to quantify CAD with MDCT. They include plaque length (PL), minimal lumen diameter (MLD), percentage of diameter stenosis (%DS), minimal lumen area (MLA), percentage of area stenosis (%AS), percentage of atheroma volume (%AV), and remodeling index (RI) [29, 30]. The %DS is calculated as (diameter lesion/diameter mean reference diameter) × 100, where the mean reference diameter is calculated by averaging the diameter of the proximal and distal reference slices to correct for vessel tapering; similarly, %AS is calculated as (area lesion/area mean reference area) × 100, where the mean reference area is calculated by averaging the area of the proximal and distal reference slices to correct for vessel tapering. %AV is calculated with the following equation: (total vessel volume − total lumen volume)/total vessel volume × 100. RI is calculated as (total vessel area)/(mean of proximal and distal reference areas) [31].
Geometrical parameters are usually accompanied by compositional parameters in particular dividing plaques in three calcified, non-calcified, and mixed with some authors distinguishing between Calcified Plaque (CP) (attenuation values 150 HU or greater), High Density Non-calcified Plaques (HD-NCP) (30–149 HU), and Low Density Non-calcified Plaques (LD-NCP) (−100 to +30 HU) [31].
Literature data confirmed the feasibility of quantitative coronary MDCT stenosis and plaque measurements with heterogeneous sensitivity (I 2 = 82%) reported by a recent meta-analysis, in part explained by scanner type (16-slice MDCT 0.84; 95% CI: 0.80–0.88 and 64-slice MDCT 0.94; 95% CI: 0.83–0.98) [26]. For quantitative stenosis assessment, MDCT slightly overestimated lumen area by 0.46 mm2 (95% CI: 0.14–0.79), or by 6.7% (p = 0.005), with plaque area and volume being similar between CT and IVUS (plaque area mean difference 0.09 mm2, 95% CI: −1.00 to 1.18 mm2, p = 0.88; plaque volume mean difference 5.30 mm3, 95% CI: −3.01 to 13.60 mm3, p = 0.21); %AS is very similar between CT and IVUS (weighted mean difference −1.81%, 95% CI: −4.10 to 0.49, p = 0.12) and represent the most concordant parameter (Fig. 12.3).
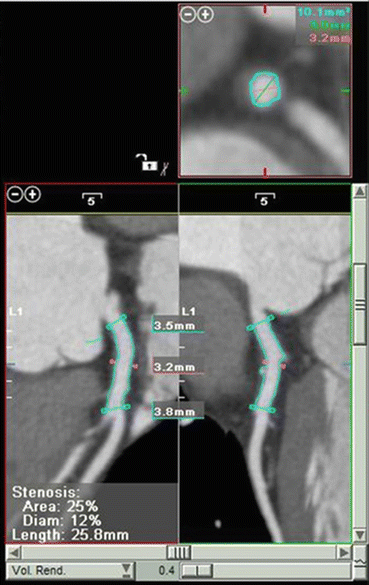
Fig. 12.3
MPR thick of non-calcified eccentric plaque positively remodeled lying on distal left main and proximal LAD, without significant stenosis; quantitative assessment of %AS = 25%
Different papers showed a slight overestimation of calcified plaque stenosis due to blooming effect with sequent poor correlation and a larger limit of agreement in the lesions with calcified plaque compared with non-calcified plaques [32]; anyway the quantitative approach is found to be reproducible and may be used for the assessment of plaque progression [26, 30, 33, 34].
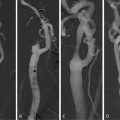
The powerful of tomographic nature of MDCT may be useful also to quantify lesion length and density in totaled occluded coronary artery, furnishing an added value over CCA for stent planning in chronic occlusion [35] (Figs. 12.4, 12.5, 12.6, and 12.7).
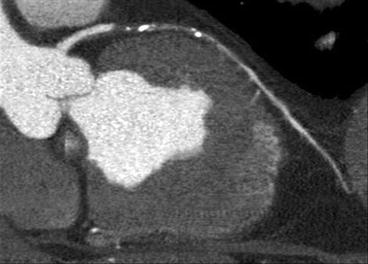
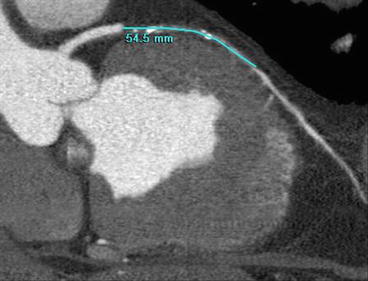
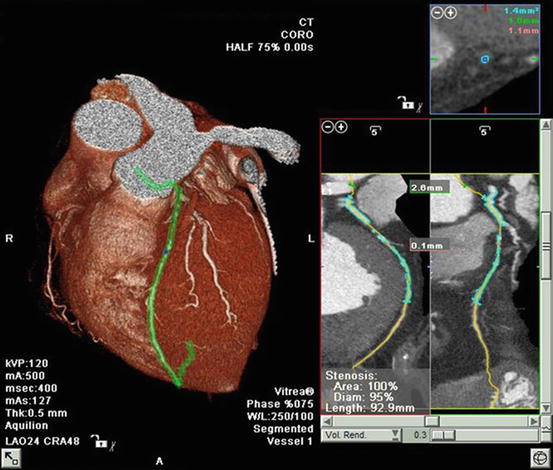
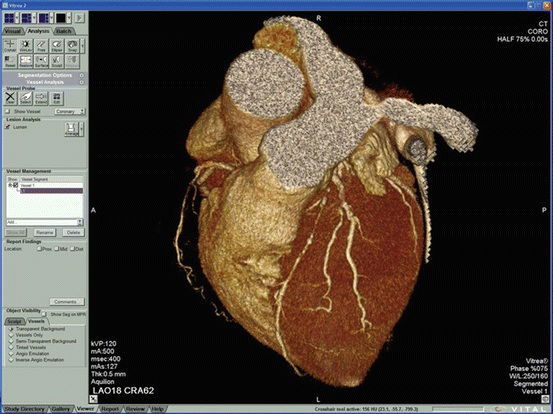
Fig. 12.4
MPR reconstruction of a totaled occluded mid-portion left anterior descending reperfused in distal tract
Fig. 12.5
MPR reconstruction of a totaled occluded mid-portion left anterior descending reperfused in distal tract. The image shows the length stenosis quantification
Fig. 12.6
Volume rendering and MPR reconstructions of a totaled occluded mid-portion left anterior descending with %AS quantification
Fig. 12.7
Volume rendering reconstruction of a totaled occluded mid-portion left anterior descending
The characterization of plaque components is one of the biggest challenges of MDCT with different papers dealing with this issue; a significant overlap exists between lipid and fibrous material, making interpretation of plaque HU problematic [20, 30, 34, 36]; anyway all studies agree on the fact that a correlation is found for all plaque components but with large limits of agreement.
In summary, although future technical developments may improve the accuracy, at the state, the relatively wide limits of agreement for geometrical and compositional parameters with MDCT suggest that quantification should only supplement and not replace the more descriptive report in the clinical practice [20, 30]. Of worth, they can be used in well-selected clinical trials.
4 Future Directions
Even if MDCT has been one of the greatest advances in the noninvasive diagnosis of CAD in the past decade, it is a poor discriminator of the functional impact of identified plaques [2, 3, 37]. The mismatch between anatomic and functional evaluation of CAD can be due to microvascular dysfunction independent of epicardial coronary arteries, multiple nonsignificant stenoses in series, difficult assessment of stenoses grading in calcified plaques, and to collateral blood flow [37].
Nowadays, recent technologies allowed a rest and stress myocardial perfusion with MDCT and preliminary and satisfying results are available in animals and humans showing MDCT is able to furnish qualitative and quantitative measurements of myocardial perfusion [38–40]. The confirm of these results in the next future will give to this tool the unique capability of providing anatomic as well as coronary stenosis-related functional data increasing the potential of MDCT to revolutionize the way we diagnose and treat ischemic heart disease [37].
Related posts:
 Relationship Between Plaque Echogenicity and Atherosclerosis Biomarkers
 Quantitative Magnetic Resonance Analysis in the Assessment of Cardiac Diseases
 Quantitative MR Analysis for the Assessment of Carotid Atherosclerosis
 Carotid Angioplasty and Stenting
 Segmentation of Carotid Ultrasound Images
 Carotid Plaque Stress Analysis: Issues on Patient-Specific Modeling
Stay updated, free articles. Join our Telegram channel

Full access? Get Clinical Tree


