Fig. 11.1
Influence of window-level setting and convolution kernels on the evaluation of lumen and plaque. Four axial MDCT images through the carotid bifurcation obtained with a smooth (a, c) or a sharp (b, d) kernel and with a larger (W1000 L200; a, b) or smaller (W400 L100; c, d) window width setting. A large window width (a, b) gives a better differentiation between lumen and neighboring calcifications, which mostly appear brighter. A smaller window width (c, d) enables visualization of the small density differences inside the non-calcified part of the plaque. A sharper reconstruction kernel (b, d) increases the contrast between the small dense calcifications and the surrounding structures, whereas a smoother kernel (a, c) leads to averaging of contrast differences, which gives a smoother appearance to the structures
In MDCTA images a challenge is formed by the artifacts from extra luminal dense structures like dental material, bone, and atherosclerotic calcifications which might obscure a clear visualization of the lumen. Correct head positioning with a slight tilt of the head and an upright position of the chin reduces the effect of beam hardening artifacts from dental material at the level of the carotid bifurcation, the predilection place for atherosclerotic disease in the carotid artery (Fig. 11.2). As described, convolution kernels and window-level settings highly influence the appearance of high density structures like calcifications. In addition, with a fixed window-level setting, calcification volumes appear smaller in higher kVp-settings [21].
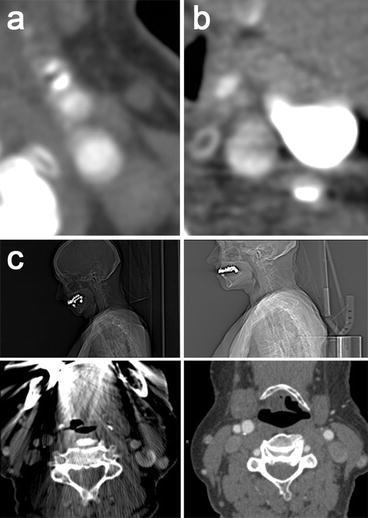
Fig. 11.2
Influence of artifacts on MDCTA imaging. (a) Axial image at a level above the carotid bifurcation showing motion artifacts due to swallowing. The tissue boundaries are heavily blurred. (b) The dependent part of the jugular vein is filled with high density contrast material, which causes streaks of low attenuation, artificially introducing a low contrast area in the neighboring carotid artery and hampering visualization of its wall. (c) Dental material can cause enormous streak artifacts (images on the left), impeding correct judgment of surrounding structures. A slight upward tilt of the chin moves these artifacts away from the region of interest and allows a normal visualization of the larger part of the carotid bifurcation (as shown on the right)
From the cross-sectional source images, 2D or 3D image reconstructions can be created which aid in the identification and measurement of the maximal stenosis. Multiplanar reconstructions (MPR) and curved planar reconstructions (CPR) provide 2D images of any predefined plane and enable accurate stenosis measurement. For creating a longitudinal view of the artery, CPR has the advantage over MPR that it corrects for vessel curvature outside of the plane. Shaded surface display (SSD), volume rendering (VR), and maximum intensity projection (MIP) are all 3D techniques with their own strengths and weaknesses. In SSD all pixels with densities below a certain threshold are excluded and the remaining data are viewed as if their surfaces are illuminated by a point source. VR utilizes the image intensities directly, by assigning opacity and color coding, to create 3D reconstructions. Both techniques are less useful for carotid artery stenosis measurements. MIPs are created by projection of the maximum intensity pixels from a 3D data set on a predefined 2D plane and give a simple overview of the vessel and its stenosis. However, this technique is limited in arteries with atherosclerotic calcifications, since calcifications in the vessel wall can easily cover the contrasted lumen causing overestimation of the degree of luminal stenosis. In addition, bony structure like the spine, thyroid cartilage, cricoid, and hyoid might interfere with a clear overview of the artery in 3D post-processing techniques (Fig. 11.3).
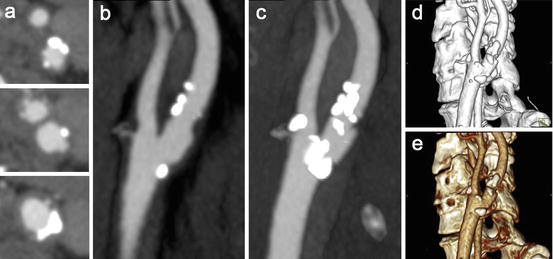
Fig. 11.3
Different post-processing techniques in MDCTA images of a moderately stenosed carotid artery. (a) Axial slices through the common carotid artery (lower image), the level of the carotid bifurcation (middle), and a level above the bifurcation (upper image). (b) Multiplanar reformat (MPR) in the sagittal plane visualizing the atherosclerotic plaque around the bifurcation. (c) Maximum intensity projection (MIP, 8.8 mm) in the same plane. Over projection of calcifications hampers a clear visualization of the lumen. (d) Volume rendering (VR) shows a 3D reconstruction of the carotid artery. (e) Shaded surface display (SSD) of the same carotid bifurcation. Both last techniques suffer from over projection of calcifications
New techniques have been investigated that might solve the problem of artifacts from bone and calcifications on images. Matched mask bone elimination (MMBE) is a technique for the automated removal of bone pixels from CTA data sets. Preceding to the CT angiography a nonenhanced data set is acquired on which the bone pixels are identified. The corresponding pixels on the registered CT angiography are assigned an arbitrarily low value and MIP images free from overprojecting bone can then be obtained [22, 23]. Whereas for MMBE, acquisition and registration of two separate datasets is necessary, in dual-energy CT (DECT) two image data sets can be simultaneously acquired with different tube voltages (for example 80 and 140 kVp). Tissues can be differentiated by analysis of their attenuation differences depending on the tube voltage. The attenuation difference is especially large in materials with a high atomic number, such as iodine. Bone and calcifications, which show a smaller attenuation difference, can therefore be differentiated from iodine in the carotid lumen. As a result, calcifications can be removed from the contrast-filled lumen, enabling quantification of carotid stenosis in heavily calcified arteries [24]. However, because in both techniques an additional rim around the calcified pixels is removed due to blooming artifacts, overestimation of the grade of stenosis can still be introduced.
2.2 Stenosis Measurement
The accuracy of the stenosis measurement is important, seen its role in clinical decision making about carotid endarterectomy. Traditionally, the stenosis in the carotid artery was assessed using intra-arterial digital subtraction angiography (DSA), which is still considered the gold standard. The degree of stenosis was defined as the residual lumen at the stenosis as a percentage of the normal lumen in the distal internal carotid artery (according to the NASCET criteria) or as the residual lumen as a percentage of the estimated original diameter of the artery at the level of the stenosis (according to the ECST criteria). In the large symptomatic carotid surgery trials, conventional DSA was performed in two or three projections (lateral, posterio-anterior, and/or oblique) which were investigated for the most severe stenosis. Whereas rotational DSA, using multiple planes, showed to provide a benefit in detecting the smallest diameter in a stenosed artery compared to conventional DSA [25], the association between the severity of stenosis and stroke risk and therefore the indication for surgical intervention remained based on conventional DSA.
The volumetric CTA datasets allow for MPRs and MIPs in any plane and therewith provide much more information on the lumen and its morphology than conventional DSA. The residual lumen is almost never circular and DSA performed in a limited number of projections does not always reveal the narrowest lumen. Analysis of 3D information therefore may provide a more realistic way to assess the true maximum stenosis.
In case CTA replaces DSA in clinical decision making, stenosis measurements on CTA should be performed in a comparable way, i.e., measuring the diameter of the remaining lumen at the level of the maximal stenosis and of the normal lumen distal to the stenosis. This can be done in several ways using different post-processing techniques. Although with MIP reconstructions images comparable to those in DSA can be obtained, this technique is limited in calcified plaques and it is recommended not to use MIP images for stenosis measurements in arteries with calcifications (Fig. 11.4). Generally, one uses 3D software to create MPRs and/or CPRs in oblique planes parallel to the carotid lumen to seek the point of maximum stenosis and measures the smallest diameter in the cross-sectional plane perpendicular to the central lumen line at that level. Figure 11.5 shows this method of stenosis measurement using 3D software. The reference diameter is measured in the same way at a level above the carotid bulb where the lumen walls run parallel to each other (i.e., the healthy distal carotid artery).
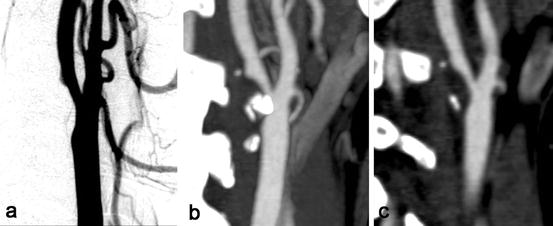
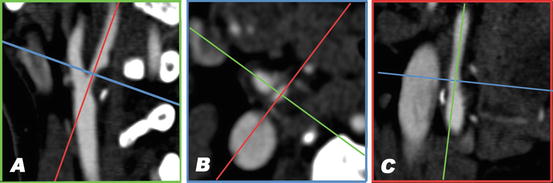
Fig. 11.4
Assessment of carotid stenosis with DSA and MDCT angiography. (a) Digital subtraction angiography (DSA) of a right carotid artery shows a 50% stenosis at the level of the bifurcation. (b) A maximum intensity projection (MIP, 6 mm) of MDCTA images of the same artery. MIP has the disadvantage of overprojection of calcifications over the lumen, causing overestimation of stenosis measurement. (c) A multiplanar reformatted image (MPR, 1 mm) in the same plane as the MIP in (b); the problem of overprojection does not occur here. Using MPR reconstruction of 3D data the point of maximum stenosis can be found easier compared to using DSA
Fig. 11.5
Stenosis measurement in MDCT angiography using 3D software. Multiplanar reformatted images are created in planes parallel and perpendicular to the lumen axis; the smallest lumen diameter in the cross-sectional plane can then be measured using calipers. (a) A sagittal view of the carotid bifurcation. The blue and red lines correspond to the planes that are depicted in b and c, respectively. A large atherosclerotic plaque is visible at the origin of the internal carotid artery, causing a high-grade stenosis. (b) The cross-sectional image perpendicular to the central lumen line at the level of the smallest vessel diameter. The residual lumen has an oval shape. (c) The view perpendicular to those in a and b. In this plane the stenosis is not very prominent (Color figure online)
When using the ECST criteria to assess the degree of stenosis, CTA directly enables visualization of the outer vessel wall, whereas on DSA the vessel diameter has to be estimated by delineating the projected lumen contour. Therewith, CTA takes into account the changes in vessel diameter caused by vascular remodeling, whereas this phenomenon is ignored when measured on DSA. This might cause differences in ECST stenosis measurements between CTA and DSA.
2.3 Diagnostic Accuracy
Several diagnostic studies have been performed which compared single slice CTA with DSA in the assessment of carotid stenosis. From a meta-analysis of studies published between 1990 and 2003, single slice CTA has been shown to have a pooled sensitivity of 85% and a pooled specificity of 93% for detection of a 70–99% stenosis. Sensitivity and specificity for detection of an occlusion were 97% and 99%, respectively [26]. Another systemic review reported a pooled sensitivity of 95% and a specificity of 98% for the detection of a 70–99% stenosis [27]. The latter study also found that CTA was sensitive (95%), but slightly less specific (92%) in depicting stenosis >30%. In 2006, Wardlaw and colleagues performed a meta-analysis comparing noninvasive imaging techniques with intra-arterial angiography. They found only 11 studies on CTA, published between 1980 and 2004, that explicitly met the Standards for Reporting of Diagnostic Accuracy (STARD) criteria [28] and they reported a sensitivity of 77% and a specificity of 95% for diagnosing 70–99% stenosis using CTA [29]. The authors warned for the methodological shortcomings of many studies evaluating diagnostic imaging. They concluded that the existing data might support the cautious use of noninvasive imaging to diagnose 70–99% stenosis, but that more data are needed from carefully designed trials to determine true sensitivity and specificity of noninvasive imaging techniques in routine clinical practice, especially for 50–69% stenosis, or when used in combination [29]. In 2009, Chappell and colleagues performed an individual patient data meta-analysis to find clinically significant estimates of the accuracy of non-invasive imaging in diagnosing severe and moderate symptomatic artery stenosis [30]. They also concluded that existing primary studies provide limited data and that the literature overestimates the accuracy of noninvasive imaging techniques. The small CTA dataset included in this analysis revealed a sensitivity and specificity of 65% and 56% for detection of 70–99% stenosis, respectively [30].
A difficulty in the evaluation of the accuracy of stenosis measurement using noninvasive imaging techniques is that both acquisition and post-processing procedures evolve rapidly. Although multidetector CTA is now widespread and is expected to improve diagnostic accuracy, this has barely been tested. Only one study compared MDCTA with DSA and found MDCTA to have a high specificity and a high negative predictive value for significant carotid disease [31]. Since DSA is not routinely used anymore in clinical practice, the assessment of new noninvasive imaging techniques against DSA can not be justified ethically anymore. Therefore there is an increasing need for practical, reliable methods for evaluating new technologies, for example, by standardized comparison with other non-invasive tests or test phantoms.
Both aforementioned systemic reviews [26, 27] did not provide enough evidence to draw robust conclusions about the diagnostic accuracy of the different post-processing techniques, although stenosis assessment using axial slices and MIPs seemed to be better than when using VR and SSD [27]. Most studies did not report on the exact—combinations of—reformatting techniques used, which hampers a solid meta-analysis. More recent studies comparing the post-processing techniques in MDCTA revealed that stenosis measurements on axial source images are highly reproducible and accurate and that the additional use of MPRs or other reconstructions is not necessary, but might aid in finding the location of the maximum stenosis [32–34].
2.4 (Semi)automated Quantification of Luminal Measures
Manual lumen segmentation and stenosis quantification are laborious and suffer from interobserver and intraobserver variability. Consequently much work has been performed on the development of (semi)automated lumen quantification. The majority of publications with respect to lumen quantification focus on the segmentation of the lumen while the assessment of the severity of luminal stenosis is addressed by few.
Lumen segmentation methods have been reviewed and grouped according to the mathematical framework used [35] or categorized with respect to (1) the way vessel geometry and appearance are modeled, (2) the image features which are used for vessel extraction, and (3) the methodology used in vessel extraction [36].
Some of the published methods have been tailored to or evaluated on carotid CTA images [37–40]. Reported values vary highly. However the comparison of these methods is hampered by the fact that they all use different imaging data and evaluation measures, like Dice similarity coefficient, mean surface distances, or visual inspection. In addition, most studies were performed on small and selected data sets. Figure 11.6 illustrates a 3D lumen segmentation of a carotid bifurcation.
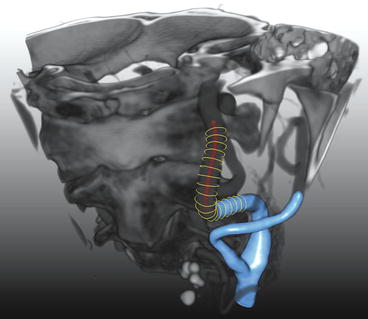
Fig. 11.6
3D-segmentation of the lumen of a carotid artery. An example is shown of a carotid artery lumen segmentation using three different segmentation representations. The red dots indicate a centerline through the centroids of the vessel cross sections. The yellow “circles” show the lumen contours perpendicular to the centerline. The blue surface shows an interpolated surface through the yellow contours (Color figure online)
To facilitate an objective comparison of carotid artery segmentation and stenosis quantification algorithms, the Carotid Bifurcation Algorithm Evaluation Framework was set up in 2009 (http://cls2009.bigr.nl/) [41]. This framework consists of a publically available image database, annotated data for training and evaluation, and standardized evaluation measures. Till date nine algorithms have been evaluated by the framework, of which only one is fully automatic, whereas the others require three initialization points. The three best performing methods evaluated by the framework have dice similarity coefficients of 0.92, 0.88, and 0.90, mean surface distances of 0.18, 0.54, and 0.17 mm and Hausdorff distances of 1.5, 4.4, and 1.7 mm, respectively [41]. Figure 11.7 shows three examples of lumen segmentations with three different dice values.
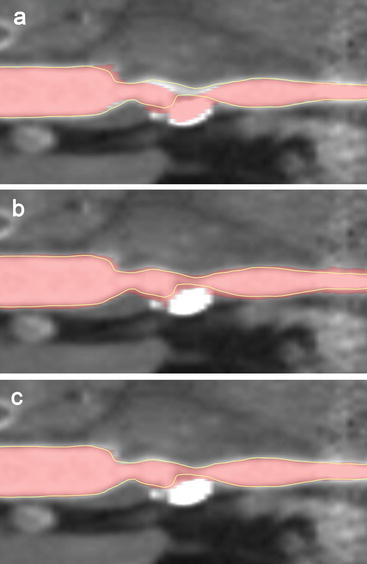
Fig. 11.7
(Semi)automated lumen segmentations of a carotid artery of different qualities. Shown are curved multiplanar reformats (CMPR) of a carotid artery with a calcified atherosclerotic plaque that causes a high-grade stenosis. A visual impression is shown of the reference standard (yellow line) based on manual annotations by three observers and automated lumen segmentations (in red) that have different qualities: (a) with a bad Dice similarity index (SI) of 0.881, (b) a moderate Dice SI of 0.884 and (c) a good Dice SI of 0.945. The Dice similarity indices are calculated on the whole volume of which the shown CMPR is just a single plane (Color figure online)
These three best performing methods are based on three different approaches, i.e., graph cut, level set, and active surface algorithms [41].
In the graph cut framework voxels are assigned to vessel lumen or background by considering all image voxels as nodes in a three-dimensional graph and creating an optimal surface which separates (cuts) the foreground (lumen) from the background. To compute this optimal cut the image gradient can be used.
In the level set framework, the vessel surface is represented implicitly by the zero level lines (zero level set) of an embedding function (similar as, e.g., sea level in a height map). This embedding function is then changed (evolved), implicitly resulting in deformation of the zero level set. This representation has the advantage that the zero level set can change topology (Fig. 11.8). The evolution of the embedding function should ensure that the zero level set halts at the vessel lumen boundary. This is achieved by defining a speed function derived from the image data. Both the initial segmentation and the design of the speed image are the key ingredients in the design of a level set-based segmentation method.
Fig. 11.8
Level set method for lumen segmentation. Using the level set framework a segmentation (indicated by the yellow contours) is seen as the zero level (gray plane) of an embedding function in a higher dimension (blue surface). If the embedding function changes as is indicated by the two blue surfaces which are slightly different, the zero level (segmentation) changes. Using this framework a segmentation can easily change topology. The segmentation on the left has one object (contour) while the segmentation on the right consists of two distinct objects (Color figure online)
Active surfaces are a generalization of active contours (also called snakes). Using active surfaces the segmentation is also the result of the evolution of an initially segmented surface. However changing topology is much harder to model in this framework. The segmentation is modeled as a surface on which forces are acting which causes the evolution of the segmentation. This evolution can be constrained by properties of the used surface representation.
Although considerable research has been performed on vessel lumen segmentation, only few researchers have published on automatic vessel stenosis grading [42–44]. Also, approaches differ widely in the evaluation that has been performed, both with respect to evaluation measures and number of data sets used.
The evaluation framework discussed previously also allows objective comparison of performance in stenosis quantification. To date only three stenosis grading methods have been evaluated using this framework, also indicating that this field has received less attention [41]. Clinically, the minimal diameter is often used to calculate the stenosis degree. However, the minimal diameter of a non-elliptical shape is not uniquely defined and is therefore prone to measurement errors and is hard to measure automatically. The evaluation framework evaluates two stenosis measures: an area-based measure which compares the area of the lumen at the stenosis to the area of a distal vessel part and a measure that compares the minimal diameter at the two positions. In the framework, the diameter-based stenosis degree is defined by the smallest line that divides the cross-sectional area in two equal parts. Using automated lumen segmentation, the minimal diameter can easily be replaced by the lumen cross-sectional area. This is a much more accurate measure for the obstruction of the blood flow as carotid arteries, especially at the site of atherosclerotic plaque, generally do not have circular luminal cross sections and also do not run exactly perpendicular to the axial plane of the CT scan. Zhang et al. investigated the use of area measurements and found that assessment of area stenosis on CTA was highly reproducible and showed a satisfactory agreement with diameter stenosis on DSA, although it provides a less-severe estimate of the degree of carotid stenosis, especially in noncircular lumens [45]. The average error in assessing carotid artery stenosis of the best stenosis grading method according to the evaluation framework was 16.9% for area-based and 17.0% for diameter-based measurements [41].
Besides stenosis grading, lumen segmentation also enables the extraction of other quantitative measures. The extracted lumen model can, e.g., be used for Computation Fluid Dynamic calculations to assess the shear stress in the atherosclerotic carotid bifurcation [46] and the quantification of geometric parameters such as vessel tortuosity and bifurcation angles [47].
3 Plaque Imaging Using CTA
3.1 Technical Aspects
Assessment of different atherosclerotic plaque components in CTA relies on the differences in linear attenuation coefficient expressed in Hounsfield Units (HU) of the plaque components. Plaque component differentiation is highly dependent on scan parameters.
Reconstruction of thin slices is very important for plaque evaluation. Thin slices allow for datasets with isotropic and higher resolution and therefore enhance the differentiation of plaque components. Especially for plaque components of which HU values are close, like lipid and fibrous tissue, thin slices are crucial.
Where blooming artifacts from vessel wall calcifications can hamper correct stenosis measurements, it also causes a problem in the evaluation of plaque, since it interferes with optimal plaque characterization of the non-calcified part of the plaque. The finite spatial resolution of CT causes partial volume averaging and therefore blooming artifacts. Blooming of calcifications leads to overestimation of calcification size and inability to evaluate the atherosclerotic regions that border the calcifications. Moreover, the calcification volume appears larger when using lower kVp settings [21].
For accurate differentiation of plaque components a high signal-to-noise ratio (SNR) is necessary. Image noise depends mainly on the product of the tube current and rotation time (mAs), the tube voltage, and reconstruction kernel. Because the atherosclerotic plaque is a relative small structure, a thin slice thickness and a small field-of-view are required. These result in a decrease of SNR, which should be compensated by a higher radiation exposure.
High intraluminal contrast material density may influence the density measurements in the plaque. Ex vivo studies in coronary arteries revealed that intraluminal attenuation strongly affects the measured attenuation of the plaque [48]. This can be explained not only by partial volume effects but also by the entrance of contrast material in the plaque via the vaso vasorum. It is unknown yet if this effect is also seen in the larger carotid artery, but it underlines the necessity of standardized scan protocols, especially since carotid plaque enhancement in CTA is thought to be associated with increased risk for neurological events [49, 50].
Another technical aspect influencing accurate differentiation of plaque components in CTA is the convolution kernel used for reconstruction of the image dataset. The convolution kernels allow for influencing the image characteristics; a smooth algorithm will reduce spatial resolution, image noise, and image contrast for tiny structures, whereas a sharp algorithm has the opposite effect. Plaque characterization and quantification of the different plaque components based on measurement of HU densities is thus highly influenced by the convolution kernel used. Smooth kernels hamper the correct differentiation between tissues with small differences in density, as is the case for lipid and fibrous tissue. In contrast, sharp kernels not only increase contrast differentiation but also lead to an increase in calcium size and low-intensity rings around calcifications (edge-enhancement artifacts), which hamper further plaque interpretation. Intermediate reconstruction kernels turned out to allow optimal plaque interpretation [21].
The window-level setting also influences the visualization of the different plaque components. Whereas a large window-width is used in luminography to differentiate lumen from calcifications that border the lumen, a small window-width is necessary to enhance the small differences in HU density inside the non-calcified plaque (Fig. 11.1).
3.2 Diagnostic Accuracy
3.2.1 Plaque Surface Morphology
The accuracy of DSA in the detection of plaque ulceration, as compared to macroscopic surgical observations, has been found to be low (sensitivity 46% and sensitivity 74%) [51]. CTA allows for analysis of the plaque surface (Fig. 11.9) and the differentiation between ulcerations and irregularities and has been demonstrated to perform better than DSA [52]. A validation study, comparing single slice CTA with histological specimens reported a sensitivity and specificity of 60% and 74%, respectively [53]. However, MDCTA has been found to have a high sensitivity and specificity (94% and 99%, respectively) in detecting plaque ulcerations compared to surgical observation [54]. Assessment of plaque ulceration on MDCTA is highly reproducible (κ > 0.86) [55, 56].
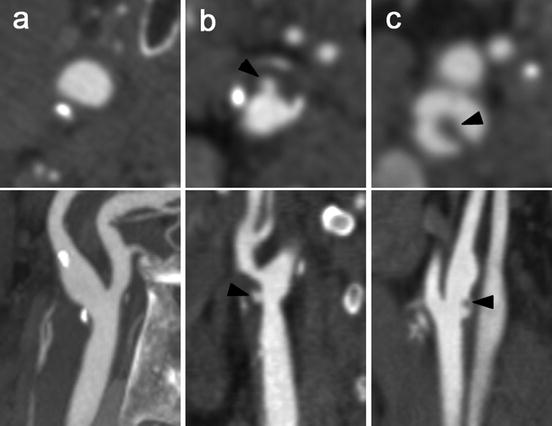
Fig. 11.9
Assessment of plaque surface morphology using MDCT angiography. Cross-sectional images (upper panels) perpendicular to the central lumen line and multiplanar reformats (lower panels) of carotid bifurcations. (a) An atherosclerotic carotid plaque with a smooth surface. (b) A plaque at the level of the carotid bifurcation with an ulceration (arrowhead). (c) An ulcerated plaque with thrombus material (arrow head) that protrudes into the lumen
3.2.2 Plaque Composition
The first validation studies compared 3 mm single slice CT images with histological sections from carotid endarterectomy specimens and did not show clear-cut results. Whereas two studies reported that calcifications, lipid, and fibrous tissue could be differentiated based on density measurements [57, 58], another study concluded that single slice CT was not sufficiently robust to reliably characterize plaque composition and plaque morphology [53]. The introduction of multidetector CT enabled a more detailed analysis of the atherosclerotic carotid plaque composition and the differentiation of plaque components.
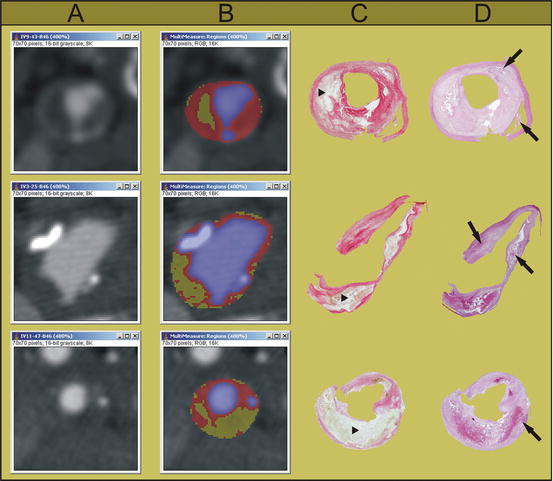
Several validation studies have been performed, in carotid arteries as well as in coronary arteries. In coronary artery studies, intravascular ultrasound (IVUS) is used as a gold standard. In carotid artery studies, the availability of histological carotid plaque specimens from carotid endarterectomy enables reliable validation against histology. An additional advantage is that the characterization of the separate plaque components can be performed easier and in more detail in the larger carotid arteries. In 2005, we performed an ex vivo validation study, in which CEA specimens were scanned and the images were compared with the histological slices (Fig. 11.10). The CT value of lipid-rich regions differed significantly from that of fibrous-rich regions (45 ± 21 HU versus 79 ± 20 HU, p < 0.001). An ROC analysis revealed 60 HU as the optimal cut-off point for differentiation between lipid and fibrous tissue, with a sensitivity of 89% and a specificity of 93% [21]. The study was repeated in vivo, in which the CT values for lipid- and fibrous-rich tissue were 25 ± 19 HU and 88 ± 18 HU, respectively. Again an optimal threshold value of 60 HU was found, with a sensitivity and specificity of both 100% [59]. Calcifications are easily detected on CT images as high density structures and equivalent to coronary calcium scoring in electron beam CT, 130 HU is generally taken as a threshold for differentiating calcifications.
 Relationship Between Plaque Echogenicity and Atherosclerosis Biomarkers
 Quantitative Magnetic Resonance Analysis in the Assessment of Cardiac Diseases
 Quantitative Computed Tomography Analysis in the Assessment of Coronary Artery Disease
 Carotid Angioplasty and Stenting
 Segmentation of Carotid Ultrasound Images
 Carotid Plaque Stress Analysis: Issues on Patient-Specific Modeling


Related posts:
Relationship Between Plaque Echogenicity and Atherosclerosis Biomarkers
Quantitative Magnetic Resonance Analysis in the Assessment of Cardiac Diseases
Quantitative Computed Tomography Analysis in the Assessment of Coronary Artery Disease
Carotid Angioplasty and Stenting
Segmentation of Carotid Ultrasound Images
Carotid Plaque Stress Analysis: Issues on Patient-Specific Modeling
Stay updated, free articles. Join our Telegram channel
Full access? Get Clinical Tree
