,  , and
, and  (see Box 5.1).
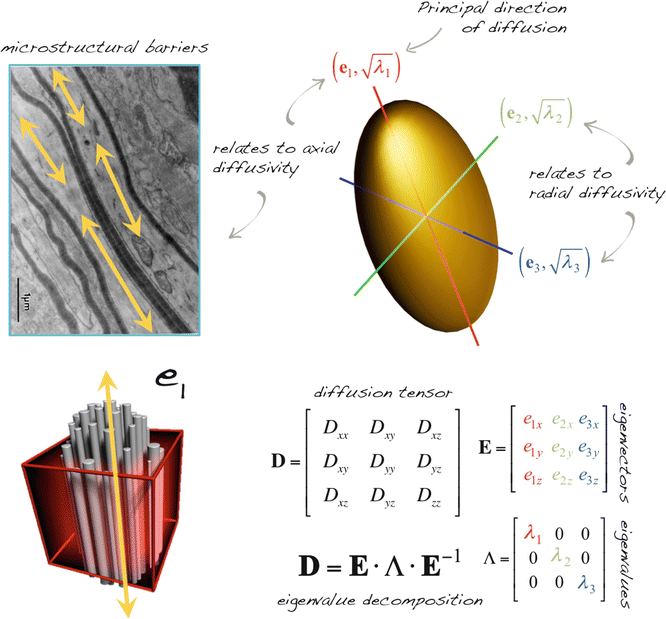
Fig. 5.1
Schematic illustration of the relationship between the mathematical diffusion tensor and its ellipsoid representation. Decomposition of the tensor into eigenvectors and eigenvalues provides information on the orientation and amount of diffusion, respectively. Various mathematical formulas as a function of the eigenvalues and vectors form the basis of quantitative DTI parameters. Top left image: Adapted from Beaulieu C. The basis of anisotropic water diffusion in the nervous system – a technical review. NMR Biomed. 2002 Nov-Dec;15(7–8):435–55. With permission from John Wiley & Sons, Inc.
Box 5.1 What Is the Difference Between Eigenvalues and Eigenvectors?
Eigenvalues: The ADC values of the tensor along the directions of the eigenvectors. They describe the shape and size of a tensor, independently of its orientation.
Eigenvectors: A new set of customized axes for a tensor, aligned along its specific orientation. They describe the orientation of a tensor, independently of its size and shape.
Eigenvalues are rotationally invariant, whilst eigenvectors are rotationally variant.
Having obtained the diffusion tensor for each voxel and having computed the eigenvectors and the corresponding eigenvalues, several metrics can be derived (Fig. 5.2), including standard metrics such as fractional anisotropy (FA), a measure of the diffusion anisotropy, and trace or mean diffusivity [6] which reflect the average amount of water diffusion in a voxel.
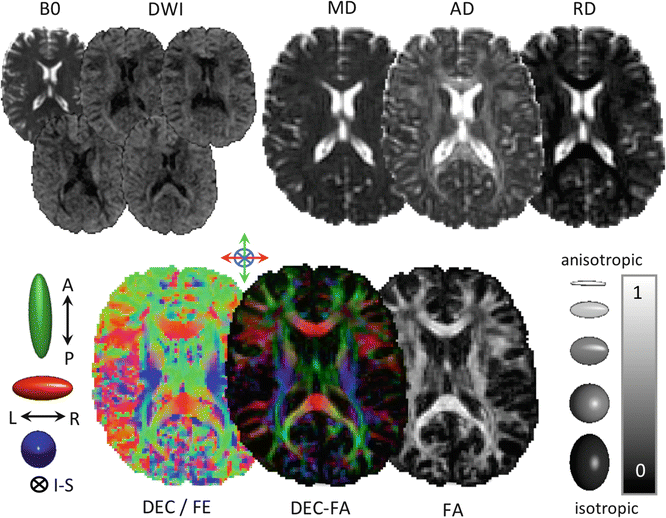

Fig. 5.2
Example parameter maps derived from diffusion imaging. Note the changing contrast in the diffusion-weighted images (DWIs), reflecting tissue orientation changes relative to the applied diffusion gradients. The color FA map, bottom center, is generated by multiplying the direction-encoded color map, generated from the principal eigenvector of the diffusion tensor, with the FA map. The colour FA map therefore contains information about fibre orientation (color) and the degree of anisotropy (intensity). Abbreviations: B0, non-diffusion-weighted image, DWI, diffusion-weighted image, MD, mean diffusivity, AD, axial diffusivity, RD, radial diffusivity, A-P, anterior-posterior, L-R, left-right, I-S, inferior-superior, DEC, direction-encoding color, FE, first eigenvector, FA, fractional anisotropy
It is important to note that some measures depend on the orientation of the tissue relative to the applied gradient (rotationally variant), whilst others do not (rotationally invariant) as this has implications for interpretation and for image registration (see Chap. 10). For example, eigenvector orientations are rotationally variant but FA and trace are rotationally invariant. Apparent diffusion coefficient (ADC) values , on the other hand, are rotationally variant. Recall from Chap. 4 that ADC quantifies the magnitude of diffusion along a given gradient direction and depends on the strength of the diffusion weighting, i.e., b-value. In the case of anisotropic tissue, for example, ADC is highest (diffusion is fastest) along the length of the pathway and lower in other directions [7].
Diffusivity Measures
Trace
The trace (Tr) of the diffusion tensor (D) reflects the overall water content. Trace, Tr (D), is a commonly used clinical measure, which gives an indication of the overall diffusivity in a given voxel and is computed as the sum of the three eigenvalues λ 1, λ 2, and λ 3 or the sum of the diagonal elements of D (D xx , D yy , D zz ). Trace is completely rotationally independent, and therefore unlike with ADC, changes in Tr(D) can be attributed solely to changes in tissue structure. Trace has become an important metric in the assessment and diagnosis of stroke [1, 8]:


Mean Diffusivity (MD)
Mean diffusivity characterizes the overall mean squared displacement of molecules (average ellipsoid size) and is simply a scaled version of the trace Tr(D) [9, 10]:
 MD, sometimes denoted mathematically as D, is a measure of the overall diffusivity in a particular voxel regardless of direction. Just like Tr(D), MD is low within white matter but high, for example, in the ventricles, where the movement of water molecules is unrestricted. This measure of overall diffusion rate can be used to delineate the area affected by stroke, as demonstrated by van Gelderen [8].

Axial Diffusivity (AD )
Axial (or longitudinal or parallel) diffusivity,  is simply the diffusivity along the principal axis of the diffusion ellipsoid and is given by λ 1 (see Box 5.2).
 is simply the diffusivity along the principal axis of the diffusion ellipsoid and is given by λ 1 (see Box 5.2).
Box 5.2: What Is the Difference Between ADC, Trace, and MD?
ADC: amount of diffusion in a single direction
Trace: sum of the eigenvalues, or “mean ADC”
MD: Trace/3
The ADC depends on diffusion anisotropy and is rotationally variant, whereas trace and MD are measures of the average amount of diffusion in a voxel irrespective of the gradient direction or underlying microstructure.
Radial Diffusivity (RD )
Radial (or transverse or perpendicular) diffusivity,  , is a measure used to express the diffusivity perpendicular to the principal direction of diffusion:

 , is a measure used to express the diffusivity perpendicular to the principal direction of diffusion:
Westin Measures
In addition to the basic ellipsoidal representation, Westin et al. [11] proposed a set of geometrical diffusion measures to quantify the diffusion ellipsoid’s shape in terms of its linear (c l), planar (c p) and spherical (c s) anisotropy components:


 The linear component describes how prolate or cigar shaped the ellipsoid is, the planar component describes how oblate or disc shaped it is, and the spherical component describes how sphere or ball-like the ellipsoid is. See Fig. 5.3 for an illustrative example.
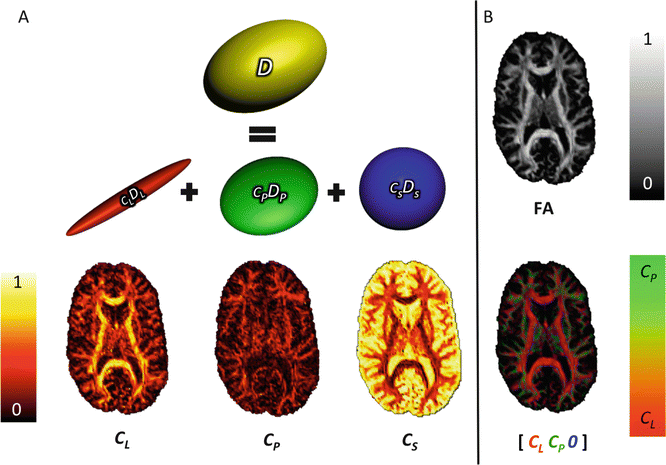


Fig. 5.3
Westin measures: Panel (a) illustrates the geometric decomposition of the diffusion tensor, D, (yellow), into triangular barycentric space, characterised by cigar (red), disc (green), and ball-shaped (blue) ellipsoids. Axial maps of the corresponding Westin measure, c l, c p, and c s can be found beneath each ellipsoid. Panel (b) illustrates how useful additional information can be obtained by combining the measures in a single map. By omitting the spherical component, it is possible to more easily distinguish between linear and planar diffusion (bottom image). Compare to the fractional anisotropy map (top)
The linear and planar diffusion tensor geometry indices have been used as criteria to distinguish single-fibre voxels from crossing-fibre voxels [12]. To some extent, voxels where the planar diffusion coefficient (c p) is largest, i.e., larger than linear (c l) and spherical coefficients (c s) can be classified as crossing-fibre configuration voxels; all voxels where linear diffusion is largest can be classified as single-fibre configuration voxels. A high c s may not only arise from multiple-fibre populations but also from partial volume effects with CSF [12].
Anisotropy Measures
The degree of anisotropy describes how molecular displacements vary as a function of orientation (ellipsoid eccentricity ) and is related to the presence and coherence of oriented structures [9].
Fractional Anisotropy (FA)
FA is a metric used to quantify the ratio between the magnitude of the anisotropic component of D and the entire magnitude of D, the diffusion tensor. FA values lie in the range [0, 1] and can be calculated in each voxel using the following expression based on the eigenvalues of the diffusion tensor:
 This rotationally invariant, dimensionless measure, expresses the anisotropy of the tensor ranging from 0, when the tensor is completely isotropic to 1 when diffusion is bound to a single axis.

In addition to the FA, many other measures of anisotropy have been proposed, including, but not limited to, the relative anisotropy [6], dispersion of the principal diffusion direction [13] or mode of anisotropy [14].
Further discussion of how FA relates to tissue microstructure and other technical features of dMRI data are discussed in a later section of this chapter.
Quantitative Parameters Derived from Multi-Shell dMRI
Anisotropy present at a microscopic level (for instance, in the presence of oriented structures, such as dendrites in the brain cortex) may not exist at a voxel level due to the averaging effect over the many different directions present in the voxel. This presents a problem for single-shell data (i.e., data acquired with one non-zero b-value, e.g., b = 1000 mm/s2), reconstructed with the diffusion tensor, which cannot model more than one orientation per voxel (see Chap. 20). However, new multi-shell approaches can be used to generate alternative metrics, which provide additional information about the underlying tissue microstructure. These multi-shell approaches are described in detail in Section VI of this book “Beyond DTI”; however, a brief summary of representative examples is provided below.
Diffusion Kurtosis Imaging
Diffusion kurtosis imaging (DKI ) is a recent MR technique that employs diffusion-sensitising gradients similar to that used in DTI, but acquires three or more diffusion weighting b-values instead of two [15]. While this technique is generally not used in a clinical environment due to time constraints (typical scan times are in the order of 20 min), DKI has been applied to study microstructural changes in a number of preclinical and clinical research populations [16–18]. Whilst DTI is concerned with modeling hindered Gaussian diffusion (see Chap. 3), DKI captures information about redistricted diffusion, which can be approximated to water bound by cell membranes and which is inaccessible to DTI. This means that DKI may provide more sensitive and specific markers for tissue injury than DTI data alone [19, 20]. Since the acquisition protocol used to obtain a DKI dataset includes all the information necessary to derive a standard DTI dataset, it can be used to calculate both types of indices. DKI measures include the kurtosis anisotropy (KA), mean, axial and radial kurtosis (MK, AK, RK, respectively). These measures quantify the degree of non-Gaussianity and can be regarded as indices of tissue compartmentalization or complexity [15]. For example, a high mean kurtosis may reflect an increase in tissue complexity. This is in contrast to high mean diffusivity, which would reflect an increase in freely diffusing water. Further information about DKI can be found in Chap. 21.
Tissue (Compartment) Model-Based Approaches
Whilst DTI and DKI do not assume a specific biophysical tissue model, other MRI based frameworks aim to incorporate additional features into their models that reflect some properties of tissue microstructure such as the behavior of water in intracellular and extracellular compartments [21]. For example, approaches such as CHARMED [22], AxCaliber [23], and ActiveAx [24] enable the extraction of a multitude of microstructural parameters (axon diameter distribution, mean axonal diameter, and axonal density) [25]. To date however, these approaches have been applied primarily in a research context owing to the complexity of analyzing such data and because of clinically prohibitive scan times. Neurite orientation dispersion and density imaging (NODDI) has recently been proposed as a more clinically feasible alternative and can be used to estimate the density and angular variation of neurites (dendrites and axons) in-vivo [26]. NODDI is based on a three-compartment tissue model and data is acquired using at least two shells differing from one another only in choice of b-values and optimized for clinical (research) feasibility (scan time <30 min).
It should be remembered however that all the techniques based on tissue models are still limited by the simplicity of the model and provide only indirect measures that may relate to tissue features, but do not actually directly quantify, for example, neurite density, in the same way as a histological examination .
Section Summary
The diffusion tensor provides a means to quantify the amount and orientational preference of diffusion at a voxel level.
A number of rotationally invariant scalar parameters can be derived from the diffusion tensor, including the FA, MD, AD, and RD.
The mean ADC, trace(D), and MD are all measures of the average diffusion in a voxel. They relate to the absence of barriers to water diffusion.
FA is the most widely used DTI measure and describes the degree of diffusion anisotropy in a voxel. It is related to the presence of barriers to diffusion, such as axonal membranes.
The Influence of Image Acquisition on DTI Parameters
Deriving scalar values from dMRI data and eventually comparing them between groups of subjects and/or correlating them with other parameters begins with the raw data acquisition, followed by a pipeline of image processing steps. Each one of these steps is susceptible to sources of bias, which may not only limit the accuracy and precision of DTI parameter estimation, but can lead to substantial errors. A more detailed coverage of this topic is performed in the following chapters of this section (Chaps. 6 and 7); however, a brief summary of selected influential factors is presented below.
Effect of Field Strength
Clinical MR systems typically used for routine DTI scanning of humans are 1.5 or 3 T, although a small number of specialist research centers offer the possibility of scanning (predominantly healthy) subjects at 7 T. As DTI parameters should not be dependent on the static magnetic field strength, the reproducibility of measures at different field strengths is largely dependent on signal-to-noise ratio and the effect of artifacts [27]. It is commonly accepted that scanning at higher field strengths increases signal-to-noise (SNR); therefore one would expect higher fields to equate with higher quality. Although this is the case for conventional imaging, the competing decreases in T2 time and increased b0 inhomogeneity associated with increasing field strength, coupled with increased distortions due to eddy currents, magnetic susceptibility, and chemical shift artifacts, off-set the gain in image quality in DTI. Nevertheless, it has been shown that the uncertainty of fitted DTI parameters decreases with increasing field strength, which may impact positively on fibre-tracking results [27]. Figure 5.4 illustrates the effect of field strength in a single subject.
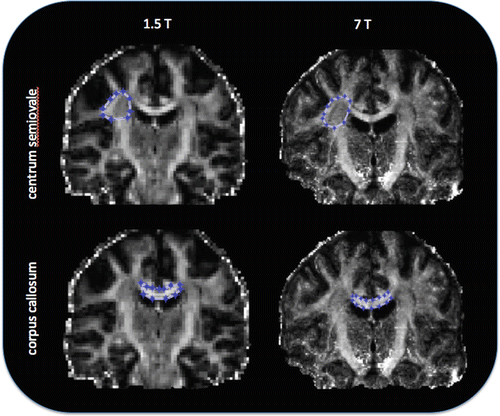

Fig. 5.4
Comparison of FA measured in two ROIs in the same subject at 1.5 and 7 T. Coronal DTI data of the human brain in the same subject acquired at 1.5 and 7 T. FA was calculated in the centrum semiovale at 1.5 T: FA mean = 0.48 (SD = 0.11) and 7 T: FA mean = 0.47 (SD = 0.08); and in the genu of the corpus callosum at 1.5 T: FA mean = 0.67 (SD = 0.18) and at 7 T: FA mean = 0.66 (SD = 0.14). Note the difference in image quality at different field strengths, which in this subject has a relatively minor effect on the FA when averaged across each ROI. SD = standard deviation [Legend data provided courtesy of FMRIB Centre, University of Oxford]
Effect of Number of DWIs
Reconstruction of the diffusion tensor requires a minimum of seven MR images [28], one without any diffusion sensitizing gradients applied and at least six diffusion-weighted images with gradients applied in non-collinear directions. Mathematically, only six non-collinear diffusion-weighted directions are necessary to reconstruct the diffusion tensor; however, in practice more images should be acquired to improve the accuracy of tensor estimation [29].
When using the tensor model, the more directions that are acquired the better the angular resolution that can be achieved; however, research has shown that the “cost” (in this case scan time) versus benefit curve starts to flatten out at around 30–32 unique directions. Jones et al. [29] found that robust determination of mean diffusivity, FA and tensor orientation requires a dMRI sampling scheme in which at least 30 unique and evenly distributed sampling orientations are employed. However, for anisotropy measurement only, the measurements will be robust when at least 20 unique sampling orientations are used. When comparing indices derived from DT-MRI, if the number of sampling orientations is low (<30) and not uniformly distributed over the surface of a sphere, then the variance in derived indices can be strongly dependent on structural orientation [30]. For example, the lowest variance in a parameter such as FA is found when the fibre is aligned with one of the sampling orientations, and is largest when the fibre is at the greatest angle to the sampling vectors. These variations will effectively increase the standard deviation of measurements obtained from a region of interest (ROI) encompassing voxels containing tissue with different fibre orientations. Such increased variance will reduce the statistical power for quantitative analyses of mean diffusivity in different ROIs and will, in general, spuriously increase the heterogeneity of the apparent trace within ROIs (Fig. 5.5).
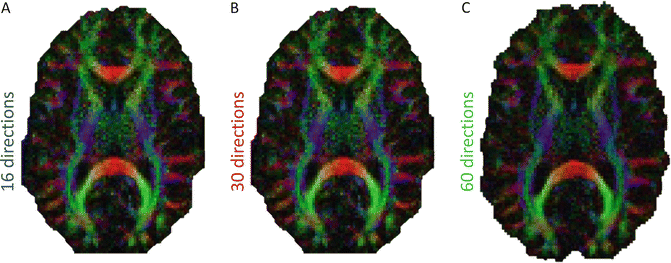

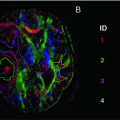
Fig. 5.5
Illustrates synthetic color FA maps for (a) 16 (blue), (b) 30 (red), and (c) 60 (green) directions. Increasing the number of gradient directions increases SNR and therefore the accuracy of estimated the DTI measurements
Combined with the number of diffusion weighting directions used, there is a requirement to acquire multiple non-diffusion-weighted images if large numbers of DWIs are acquired using different gradient orientations. The optimal ratio of diffusion weighted to non-diffusion-weighted images was calculated to be roughly 9:1 [31]. Typically one b = 0 image is acquired for every 8–9 diffusion-weighted images. HARDI methods typically use a higher number of gradient directions (>45) depending on the reconstruction method used, and similar to DTI, increasing the number of directions improves the angular precision achievable [32].
Effect of b-Value
The number and strength of b-values influence the derived measures of diffusion and anisotropy [30] (Fig. 5.6). Attention to the choice of diffusion sensitisation parameters is important when making decisions regarding clinical feasibility (acquisition time) and obtaining normative measures.
Within an ROI, the mean and variance of the trace will be dependent on the b-value [30]. The trace of the tensor is dependent on the amount of diffusion weighting used to characterise it [30]. As the diffusion weighting is increased there is an increasing dissociation between grey and white matter, with the trace in white matter being lower than in grey matter. This not only introduces more heterogeneity within ROIs, but also means that comparison with normative databases or data from other centres and, by extension, multicenter studies is problematic unless the same degree of diffusion weighting is employed (which is seldom the case).
The diffusion characteristics of a voxel containing a single-fibre population can be characterized by a tensor whose associated ellipsoid is prolate. In voxels containing multiple fibre populations (e.g., crossing-fibre regions), the diffusion characteristics observed at low b-values can still be described by a single tensor but the diffusion ellipsoid may be less prolate or may become spherical or even oblate. In such cases, the tensor model does not adequately reflect the underlying tissue microstructure. Unfortunately, this is the case in an estimated 60–90 % of brain voxels [34], which again emphasizes the need for caution when interpreting DTI measures. Several groups have proposed methods for elucidating complex tissue microstructure by examining the non-Gaussian diffusion behavior that only becomes apparent at higher b-values (see [32] for a review).
Effect of Image Quality
Noise
The effect of noise on anisotropy measurements derived from DT MRI was first described by Pierpaoli and Basser [35]. Noise in the diffusion-weighted signals will mean that, even in a perfectly isotropic medium such as a glass of water, it is not possible to obtain three identical eigenvalues. Low signal-to-noise ratios correspond to high eigenvalue discrepancies. Thus, there is a noise-induced bias in measurements of anisotropy. The variance in anisotropy increases as the added noise increases. However, the mean value remains approximately constant in the white matter, but increases rapidly in the grey matter [30]. Therefore unless the acquisitions are matched so that the SNR in the non-diffusion-weighted images is the same and, equally importantly, so that the same number of b = 0 images and diffusion-weighted images are acquired, then comparing anisotropy values across different subjects, time points, and centers is particularly problematic (see Box 5.3).
Box 5.3: Comparing DTI Measures in Different Studies
It is not trivial to directly compare DTI measures (e.g., FA) derived from data acquired on different scanners with different acquisition parameters (e.g., b-value).
Example: For a given patient, the FA in the corpus callosum is found to be 0.8. In another study, the FA in the corpus callosum in a healthy individual is reported to be 0.9. Intuitively, one may conclude that the patient has a lower FA than normal. This is incorrect because the FA was calculated based on data with different acquisition parameters, and possibly also using different tensor estimation and analysis techniques. The correct way to assess if a patient has a different FA value in the corpus callosum compared to a healthy individual would be to do a case–control group study with patients and healthy control subjects scanned with identical scan protocols and processed/analyzed in an identical manner.
The SNR depends linearly on the voxel volume. Clinical protocols typically limit voxel sizes to a minimum of about 2 mm3 at 3 Tesla (T) or 2.5 mm3 at 1.5 T. Reducing the edge length from 2 to 1.5 mm would reduce the SNR by more than half [36]. This reduction in SNR can only be compensated for by repeating and averaging the measurements, if averaging is performed in the complex domain and appropriate models of noise are invoked [36]. The SNR should never be below about 3:1 in any of the DW images in order to avoid the problems associated with the rectified noise floor [30]. Results reported in [37] and [38] suggest 10:1 as a safe minimum (Box 5.3).
It has also been found that that even within the three popular regression methods (linear least squares, LLS, weighted-linear least squares, WLLS, nonlinear least squares, NLLS) that do not explicitly account for the noise-floor, there are differential responses [37, 39]. This means that results will be different when using different estimation methods, and therefore, it is important when comparing measures of diffusion anisotropy to establish not only what acquisition was used, but also what tensor estimation routine was used (see previous Chap. 4 for further discussion on the topic of tensor estimation strategies).
SNR of the diffusion-weighted images is also influenced by the diffusion weighting factor or b-value used. Low b-values provide higher SNR but at a cost of reduced angular resolution. Correspondingly, high b-values are better for HARDI acquisitions but SNR is significantly reduced.
Artifacts
Although general guidelines exist for optimizing a DTI acquisition protocol in terms of SNR, b-value, voxel size, diffusion gradient directions, and cardiac gating [40], large variations in data quality remain as a result of differences in scanner hardware, pulse sequences and available scan times. Tournier et al. [32] and Jones et al. [36] present excellent reviews on pre-processing dMRI data and the recommended quality assessment that should be performed. There are a number of artifacts that can be identified in DTI data, including geometric distortions, ghosting, and signal dropouts. Detailed information regarding the prevention, recognition, and correction of such artifacts is provided in Chaps. 6 and 7 of this book.
Such artifacts can affect the accuracy of the tensor estimation, and by extension, the derived DTI parameters. For example, FA values greater than one can result from negative eigenvalues in the diffusion tensor, which typically occur at the interface between the CSF and the surrounding white matter, as artificially low-intensity rims [36]. Correcting for CSF-contamination partial volume effects in the structures of interest on a voxel-by-voxel basis prior to drawing inferences about underlying changes in white matter structures is therefore recommended [41].
Not only the artifacts themselves, but also the strategies employed to correct them may also introduce errors. For example, when correcting for motion and eddy-current induced geometric distortions by performing affine registration of the diffusion-weighted images to one of the non-diffusion weighted images, it is important to also reorient the encoding vectors with the same rotation matrix [42]. Neglecting to perform this important step may have minimal impact on scalar indices such as FA but it can introduce biases of the order of a couple of degrees to estimates of the principal eigenvector, or peaks in the fibre orientation distribution (fODF) or diffusion orientation distribution (dODF).
It is also important to correct for any residual eddy currents along the phase-encode direction by modulating the signal intensity back to its correct value by scaling the intensity in proportion to the change in the volume of the voxel. Neglecting to do this can introduce biases in quantitative metrics and estimates of orientation [30].
Section Summary
DTI metrics are influenced by a number of factors related to data acquisition, including the magnetic field and gradient strength, the b-value, the number of gradient directions, and image quality.
Pre- and post-processing strategies used to estimate the tensor and correct for artifacts will affect the calculation of DTI measures.
Interpreting Quantitative Diffusion Measures
… in most in vivo DTI cases, all that is proven is that there is a change in the diffusion parameters of water in a specific neural region, the interpretation of which is merely a plausible hypothesis. (C. Beaulieu, [43]).
Diffusion-weighted MRI measurements reflect the amount of hindrance and restriction experienced by water molecules moving with a component of displacement along the axis of the applied gradient, averaged over a voxel. Exactly how restriction and hindrance influence the signal is an open and complicated question and relies on a number of modelling assumptions, which may or may not be correct [36]. The general mobility of water molecules depends on barriers and obstacles imposed by microstructure, e.g., cell membranes, myelin sheaths, and microtubules. Such barriers slow down the diffusing particles (“hindered diffusion”) or even impose an upper limit on their overall mean-square displacement (“restricted diffusion”). The distinction between restriction and hindrance is important when interpreting diffusion MR data. While the tensor parameters are influenced by both restricted and hindered diffusion, the tensor model assumes Gaussianity and therefore translates restricted into hindered diffusion.
It is important to understand that when there is any component of displacement along the applied gradient axis that this will lead to signal attenuation. In other words, if the gradient is applied along a given axis, water molecules do not have to be moving parallel to this axis to cause signal loss. It is only when the displacement is perfectly perpendicular to the encoding axis that there will be no contribution to signal loss since it is only at this orientation that there is no component of displacement along the encoding axis.
Relating DTI Parameters to Neurobiology
Fractional Anisotropy
Several DTI indices can be derived from the eigenvalues to quantify the properties of white matter noninvasively, but the most widely used is FA, which is an index of the amount of anisotropy. FA describes the directional coherence of water diffusion in tissue and is generally interpreted as a quantitative biomarker of white matter “integrity.” This is because pathological studies tend to show a reduction of FA associated with neurodegenerative processes [44–48] and developmental studies tend to show an increase of FA through infancy, childhood, and adolescence [49–53], whilst IQ or improved performance in particular cognitive domains often correlates with increased FA [54–56]. However, equating FA with an index of white matter “integrity” is an oversimplified interpretation because FA cannot disentangle the individual microscopic contributions (partly due to the relatively large voxel size) [12, 30, 36].
FA is influenced by large, oriented macromolecules, organelles and membranes . The degree of myelination, axon packing, the relative membrane permeability to water, the internal axonal structure, and the tissue water content all contribute to tissue anistropy [57]. The degree of anisotropy is often most strongly correlated with axon count and density [43], whilst the degree of myelination correlates with FA, but does not determine tissue anisotropy, which has also been demonstrated in non-myelinated fibres. Furthermore, as axon count and myelin are strongly correlated, it is impossible to differentiate between them when interpreting FA changes. For this reason, FA should not be equated with an index of myelination or myelin damage.
Large regional differences have been observed in WM FA measurements. These differences follow a typical pattern of high FA in the core of fibre bundles and low FA in the periphery [58], although there are exceptions. For example, in regions of where fibre bundles cross, FA is low. Regional anisotropy may arise from differential rates in developmental and degenerative trajectories for different fibre pathways [51]. For example the superior longitudinal fasciculus matures at a relatively later stage of development than other white matter fibre bundles, and an anterior-posterior gradient of FA decline in later adulthood has been observed [59, 60]. This regional heterogeneity introduces its own challenges with regard to both study design and the interpretation of results, as discussed later in this chapter and in Chaps. 8 and 13.
Stay updated, free articles. Join our Telegram channel

Full access? Get Clinical Tree


