Abstract
Objectives
To implement, examine the feasibility of, and evaluate the performance of quantitative ultrasound (QUS) with a handheld point-of-care US (POCUS) device for assessing liver fat in adults.
Materials and Methods
This prospective IRB-approved, HIPAA-compliant pilot study enrolled adults with overweight or obesity. Participants underwent chemical-shift-encoded magnetic resonance imaging to estimate proton density fat fraction (PDFF) and, within 1 mo, QUS with a POCUS device by expert sonographers and novice operators (no prior US scanning experience). Radiofrequency data from the liver collected with the POCUS device were analyzed offline using probe-specific calibrations to estimate two QUS parameters: attenuation coefficient (AC) and backscatter coefficient (BSC). Area under the receiver operating characteristic curve (AUC) of each parameter was estimated for classifying presence/absence of hepatic steatosis (defined as PDFF ≥ 5%). Spearman rank correlation between each parameter and PDFF was estimated and its significance assessed.
Results
Of 18 participants (mean age, 43 y ± 14; 17 women), 8 had hepatic steatosis (PDFF ≥ 5%). Both AC and BSC classified hepatic steatosis accurately with AUCs of 0.96–0.97 for expert and 0.88–0.89 for novice operators ( p < 0.01 for all) and correlated significantly with PDFF with rho’s of 0.65–0.69 for expert and 0.58–0.65 for novice operators ( p < 0.02 for all).
Conclusion
QUS can be implemented on a POCUS device and can be performed by expert or novice operators after limited training in adults with overweight or obesity with promising initial results.
Affordable and accurate point-of-care tools are needed but not available for screening for steatotic liver disease, a global pandemic. This pilot shows that quantitative ultrasound can be implemented on a handheld point-of-care ultrasound device and used by expert or novice operators to accurately diagnose this condition.
- 1.
There is a critical unmet need for an affordable widely accessible screening tool to diagnose steatotic liver disease, a global pandemic.
- 2.
Quantitative ultrasound (QUS) parameters can be acquired with a handheld point-of-care ultrasound (POCUS) device by expert or novice operators with promising initial results to diagnose steatotic liver disease.
Introduction
Metabolic dysfunction-associated steatotic liver disease (MASLD, formerly non-alcoholic fatty liver disease) is a silent disease with an estimated global prevalence of 32% [ ]. It encompasses a spectrum of abnormalities, ranging from abnormal liver fat accumulation to cirrhosis, and it is a risk factor for hepatocellular carcinoma, cancer in other organs, and premature death [ ]. Screening in primary-care settings for MASLD is needed to enable early diagnosis and timely lifestyle modifications, which can stabilize or reverse the condition [ , ], but there are no accurate, non-invasive tools for primary-care screening.
Available options for MASLD screening are not ideal. Blood-based laboratory tests such as alanine aminotransferase and aspartate aminotransferase are neither accurate [ ] nor precise [ ]. Liver biopsy, the current reference standard for MASLD diagnosis, suffers from cost, risk of serious complications, sampling error [ ], and limited availability. Chemical-shift-encoded magnetic resonance imaging (MRI)-based proton density fat fraction (PDFF) is non-invasive, accurate, and precise [ ], but limited access and contraindications reduce its clinical effectiveness.
Radiologist-interpreted conventional B-mode ultrasound (US) is commonly used for MASLD screening given its safety, patient tolerance, affordability and accessibility, but is subjective and imprecise. To overcome the limitations of conventional US, quantitative US (QUS) methods have been developed to measure liver tissue parameters numerically and provide more objective assessment. Such parameters include the controlled attenuation parameter (CAP), which is measurable with a relatively costly device utilized mainly in specialist clinics, and various QUS parameters measurable on advanced cart-based US systems, which are not available at the point-of-care, and also require operational expertise. Accurate, affordable, and accessible tools to screen for MASLD in primary-care settings are needed but not yet available. QUS implemented on a handheld device is a potential avenue to address this unmet need.
The purpose of this pilot study was to implement, demonstrate the feasibility of, and examine the performance of QUS with a handheld point-of-care US (POCUS) device for liver fat assessment in adults with overweight or obesity, using contemporaneous PDFF as reference. We focused on adults with excess adiposity because they are technically challenging to image and a clinically relevant population for MASLD screening [ ]. We used PDFF as reference because it is well-accepted as the most accurate and precise non-invasive quantitative biomarker for diagnosis and quantification of liver fat [ , ].
Materials and methods
Design and study participants
This HIPAA-compliant IRB-approved prospective cross-sectional single-center pilot study was ancillary to an ongoing prospective longitudinal observational study (“the parent study”). Eligibility criteria for the parent and pilot studies are summarized in Figure 1 . Parent study participants underwent MRI visits, which included liver PDFF estimation, at multiple time points before and after weight loss surgery (usually sleeve gastrectomy). Consecutive eligible participants were enrolled in this pilot study between March 2022 and August 2022 and underwent a single-day research US visit, with QUS performed using a POCUS device by two operators, contemporaneously to the nearest parent study MRI visit. Participants signed informed written consent for both studies.

Two authors (initials redacted) are employees of Butterfly Network Inc., and provided guidance on how to use the POCUS device and software development kit (SDK), but did not control any study data or contribute to the data or statistical analysis.
Study endpoints
The study endpoints were diagnostic accuracy for hepatic steatosis (defined as PDFF ≥ 5%) [ ], correlation with contemporaneous PDFF, and inter-operator (expert vs. novice) reproducibility of handheld QUS.
Clinical data
Research coordinators collected demographic and laboratory data as part of the parent study on the day of MRI. FIB-4 was calculated from age, platelets, alanine aminotransferase, and aspartate aminotransferase (FIB-4 is a biomarker, which provides likelihood scores for presence of hepatic fibrosis) [ ]. Height and weight for this ancillary study were collected on the day of QUS. Body mass index (BMI) was calculated.
Participant preparation
Participants were instructed to fast for ≥2 h prior to both MRI and US.
MRI exams and analysis
PDFF exams were performed to estimate liver fat (see Supplementary). PDFF values from segments 5–8 were averaged to estimate overall right-lobe liver fat.
POCUS exams and analysis
POCUS device
We used four POCUS devices (Butterfly IQ+ handheld US probes, Butterfly Network Inc., Burlington, MA). The devices utilize a two-dimensional linear array of 140 × 64 (8,960) capacitive micromachined ultrasonic transducer (CMUT) elements [ ] on a single silicon chip, a newer transducer technology. Battery-powered, the devices normally operate through a wired USB-C connection to an Apple iOS cellphone or tablet running the Butterfly application. In our research configuration, the Butterfly IQ+ was connected to a laptop computer (Apple Powerbook, Apple, Cupertino, CA) running a proprietary Butterfly SDK (version 1.15).
Implementation of QUS on the POCUS device
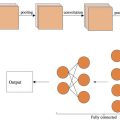
As QUS methods are currently unavailable on Butterfly systems, we modified the SDK code to enable the recording of B-mode images and the corresponding radiofrequency (RF) data with a single button press. Conventional US computes the envelope of each beam-formed RF signal, converts the log-transformed envelope into a 1-D image line, and combines all 1-D image lines to form a 2-D grayscale B-mode image. The process of converting the RF data into envelope data causes substantial information loss. In QUS, the RF data are saved and used for quantitative estimates of tissue sonographic properties. We also adjusted the signal processing parameters to yield power spectrum data suitable for QUS computation, collected probe-specific power spectra data from a reference phantom (see below) for system calibration, verified the power spectrum stability of each probe over >12 mo and across different battery levels.
Reference phantom
We used a custom reference phantom (CIRS, Inc., Norfolk, VA) with acoustic properties manufactured to our specifications (sound speed 1540 m/s, attenuation coefficient [AC] 0.69 dB/cm-MHz, backscatter coefficient [BSC] 3.7 × 10 –4 cm –1 sr –1 at 3 MHz) and confirmed by laboratory measurement using a single-element transducer. The phantom allows calibration of RF data by removing device dependencies. As shown previously [ , ], one phantom with known acoustic properties suffices for QUS processing. As the power spectrum for each probe was shown to be stable over time (see above), a single reference phantom scanning session sufficed for probe calibration.
POCUS operators
The POCUS operators included two diagnostic registered medical sonographers (initials redacted during submission), each with over 10 y of sonography experience, and two novice US operators. The novices were a first-year research resident (initials redacted) and a clinical research coordinator (initials redacted), neither with prior US scanning experience. Each operator underwent one training session using the Butterfly device on a phantom and one training session on a human volunteer. Training sessions were supervised by a US medical physicist (initials redacted) and a technician from Butterfly Network, Inc.
POCUS liver exam
Participants underwent two POCUS exams at each US visit, one exam performed by one of the two expert sonographers and the other performed by one of the two novice operators, using one of the four POCUS devices. The selection of operators and device for each exam was based on personnel and device availability. For each participant, the exam by the expert sonographer was performed first, followed by the novice operator. As this was a feasibility study, the order was not randomized.
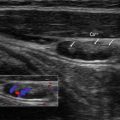
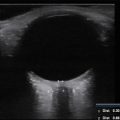
POCUS exams were performed with participants in the left lateral decubitus position with their right arm abducted. The right liver lobe was visualized through an inter-costal space, using a standard setting for abdominal imaging available on the Butterfly device (“Deep Abdomen”). A single transverse B-mode image of the liver and the corresponding RF data were obtained with a single button press during a 5- to 10-s breath hold.
POCUS phantom exam
The reference phantom was imaged once with each of the four POCUS devices. The phantom RF data acquired with each device during this single session were saved and then used to calibrate the in vivo liver RF data acquired from the research participants (see below).
QUS analysis
As this was a first-time implementation of QUS capability on a Butterfly system, the workflow for automated, real-time analysis has not been developed yet. Therefore, the B-mode images and RF data captured on the POCUS device were analyzed offline. Using an open-source software tool (in Matlab 2016a; MathWorks, Natick, Mass) [ ] on personal computer, an image analyst under the supervision of a radiologist (initials redacted) and the physicist placed a polygonal field of interest (FOI) manually on each B-mode image of the right lobe captured using the Butterfly device with the SDK. The FOI was drawn to capture as much representative liver parenchyma as possible while avoiding liver edges, shadows, and other artifacts. No effort was made to avoid blood vessels, as prior work has shown that excluding blood vessels did not improve QUS performance for assessing liver fat [ ]. The software automatically propagated the polygonal FOI from the B-mode image to corresponding spatially mapped RF data [ ].
A bioengineering graduate student (initials redacted) under the supervision of a bioengineering professor (data redacted, 13 y experience) then computed two fundamental spectral-based QUS parameters from the FOI: AC and BSC [ , , ]. These parameters were measured between 1.7 and 2.6 MHz, a bandwidth around the center frequency of the received RF signals (i.e., best signal-to-noise ratio). To remove RF device dependencies, the computations were performed using the calibration reference phantom data from the corresponding probe [ , ]. BSC (in units of cm –1 sr –1 ) was log-transformed to yield 10log 10 BSC with units of dB (henceforth, logBSC) with 0 dB corresponding to 1 cm –1 sr –1 . For illustrative purposes, parametric maps were generated showing AC and logBSC parameter values overlain on the corresponding B-mode image. The transmit configuration used was a 2-cycle 2.5 MHz waveform, with a surface pressure of approximately 400 kPa. The penetration depth was set to 20.98 cm for liver imaging. The top 10 cm of the liver imaging were used for computing QUS parameters.
To enhance the potential yield of this pilot study, we also computed four exploratory QUS parameters: two backscatter-derived parameters (Lizzi–Feleppa [LF] slope and LF intercept), and two statistical parameters derived from the RF signal envelope (kappa and mu) [ , , ]. LF slope and intercept were obtained by using linear regression of logBSC against frequency. Kappa and mu were computed assuming a homodyned K distribution [ ]. This distribution was originally suggested by Jakeman [ ] to model the statistics of laser speckle in turbulent media and adopted by Dutt and Greenleaf to model US echo envelope signals [ ]. Alternative distribution models (e.g., Rayleigh, Rician, K) are special cases of homodyned K [ ]. The six QUS parameters are summarized in Table 1 . Importantly, all six parameters could be derived from the same RF acquisition, such that collection of multiple QUS parameters did not prolong exams or increase participant burden.
| Type of QUS Parameter | QUS Parameter | Description |
|---|---|---|
| Fundamental spectral parameters | Attenuation coefficient (AC) | Marker of US energy loss. Reflects composition |
| Backscatter coefficient (BSC) | Marker of “echogenicity.” Reflects tissue microstructure. Usually log-transformed | |
| Parameters derived from BSC | Lizzi–Feleppa slope | Slope from linear regression of 10log10 (BSC) vs. US frequency |
| Lizzi–Feleppa intercept | Intercept from linear regression of 10log10 (BSC) vs. US frequency | |
| Envelope statistical parameters | Kappa | Ratio of coherent to incoherent backscattered signal. Reflects tissues microstructure disorganization |
| Mu | Number of scatters per resolution cell. Reflects scatter density |
Blinding
MR analysts were blinded to QUS data. US operators, analysts, and the biomedical engineers who computed the QUS parameters were also blinded to MRI results.
Statistical analysis
Participant information was summarized descriptively. Continuous data were reported as mean ± standard deviation or median with range.
Diagnostic performance for hepatic steatosis
Using receiver operating characteristic (ROC) analysis, we assessed the performance of AC, logBSC, and each exploratory QUS parameter for classifying hepatic steatosis (defined as PDFF ≥ 5%) [ ], for experts and novices separately. Areas under the ROC curves (AUCs) were computed with DeLong 95% confidence intervals (CIs). Using expert QUS measurements, a classification cutoff was selected for AC, logBSC, and each exploratory QUS parameter to maximize Youden’s index. The expert measurement-derived cutoffs were applied to estimate the sensitivity, specificity, total accuracy, and corresponding exact binomial 95% CIs of each parameter, separately for experts and novices.
Correlation analysis
Scatterplots of AC, logBSC, and the exploratory QUS parameters acquired with POCUS versus contemporaneous PDFF were generated. Spearman rank correlations were computed between each QUS parameter and PDFF, for experts and novices separately. Cubic smoothing splines were placed on each plot to help visualize the relationships. For comparison, we computed the Spearman rank correlations between QUS parameters acquired with a full-size US system by expert sonographers with contemporaneous PDFF using data acquired in a prior study by Han et al. [ ].
Inter-operator (expert vs. novice) reproducibility
To examine reproducibility between expert and novice operators, we used Bland–Altman analyses and calculated precision metrics recommended by the Quantitative Imaging Biomarker Alliance [ , ]: Bland–Altman bias and its significance, 95% limits of agreement (LOA), intra-class correlation coefficient (ICC), reproducibility coefficient (computed as one half of the width of the LOA), and within-subject coefficient of variation (wCV).
This being a pilot study, we did not apply cross-validation or adjust for multiple comparisons.
Results
Participants
Of 19 recruited participants from the parent study, 18 agreed to participate in and completed the pilot study; the other potential participant was unable to participate due to scheduling difficulties. The 18 participants (17 female, reflecting the female predominance of weight-loss-surgery patients) had mean age, BMI, and right-lobe PDFF of 43 ±13 y, 33 ± 3.5 kg/m 2 , and 5.5% ± 4.3% (range 1.8%–14.8%), respectively ( Table 2 ). Eight of 18 (44%) had hepatic steatosis and 14 (78%) had a low likelihood of advanced liver fibrosis, as calculated by Fib-4 ( Table 2 ). Median MRI-US interval was 6 d (range, 0–31 d).
Related posts:
Stay updated, free articles. Join our Telegram channel

Full access? Get Clinical Tree


