Fig. 6.1
Slice positioning on the vertical long-axis (VLA) (a) and 4-chamber (4CH) (b) planes to obtain multislice short axis (SAX) images (c) from base to apex of the ventricles. Note that all slices are parallel to the atrioventricular (AV) valves and perpendicular to the interventricular septum. Functional analysis of both ventricles using the Simpson’s method is obtained by drawing endocardial borders in each plane (respectively red in the LV and purple in the RV). The delineation of the epicardial ventricular border (green) is important to quantify LV mass. (d) Surface-rendered 3D images of the left and right ventricle obtained from the automatic propagation of endocardial and epicardial contours to the all subsequent phases of the cardiac cycle
During the post-processing, the precise delineation of the endocardial ventricular border in the end-diastolic and end-systolic phases is crucial for accurate quantification of ventricular volumes (Fig. 6.1c). Ventricular volume and global function parameters can be derived using Simpson’s rule including end-diastolic (EDV) and end-systolic volumes (ESV), ejection fraction (EF), stroke volume (SV), and left ventricular mass.
The difference between EDV and ESV is the SV (mL).
The SV divided by the EDV gives the EF (%).
![$$ \mathrm{EF}=\frac{{\mathrm{SV}\ [\mathrm{mL}]}}{{\mathrm{EDV}\ [\mathrm{mL}]}} \times 100 $$](/wp-content/uploads/2016/08/A271459_1_En_6_Chapter_Equb.gif)
The SV multiplied by the heart rate (HR) gives the cardiac output (L/min).

The trabeculations and the papillary muscles should be included in ventricular cavity, except in patient with hypertrofic cardiomyopathy. The delineation of the epicardial ventricular border is important for quantification of the overall volume of the ventricular wall and to obtain the ventricular mass multiplying the myocardial volume by the heart muscle-specific density (1.05 g/cm3). All determinations are usually indexed for the body surface area to according parameters for individual body conformation.
Phase contrast (PC) images also play an important role in the evaluation of global ventricular function, in particular, the application of this technique to the proximal portion of the ascending aorta and pulmonary artery allows a precise quantification of anterograde flow over a complete cardiac cycle; left and right ventricular stroke volume can be measured by integrating the area under flow curve [5].
Literature data agree in considering CMR the reference standard for the assessment of right and left ventricular volumes, EF and myocardial mass, and functional parameters have always to be reported.
3 Assessment of Regional Ventricular Function
Evaluating the contribution of the different ventricular portions to the global ventricular performance is important in many cardiac diseases. The parameters used to study regional ventricular function are myocardial wall thickness, systolic wall thickening, and circumferential and longitudinal wall motion or shortening.
Preserved wall thickness is a good indicator of the presence of viable myocardium in the setting of a chronic infarction and wall thickening analysis is more sensitive in the detection of dysfunctional myocardium than wall motion analysis [6]. Some studies have shown that measuring regional contractility is a better prognostic indicator than left ventricular EF and that quantitative measurement of wall thickening provides a more precise indication of regional function than does visual estimation of wall motion [7, 8].
CMR short-axis acquisitions have proved their usefulness for the determination of left ventricular regional wall parameters [6]. In contrast to echocardiography, which only provide good visualization of the endocardial borders of the myocardium, CMR also provides excellent depiction of the epicardial borders of the myocardium. This allows assessment of not only wall motion but also wall thickening and thinning. Local wall thickness and thickening can be derived from manually or automatically defined endocardial and epicardial profile in end diastole and end systole of left and right ventricle.
The commonest way to assess wall thickness and thickening is based on the centerline method (Fig. 6.2). In short-axis images, myocardial thickness is divided by a line into two equal parts, equidistant to the endocardium and epicardium; multiple lines are drawn perpendicular to this line, covering the entire myocardium at defined intervals. The length of each line indicates parietal thickness, while the relationship between the length of each line at the end of systole and diastole defines systolic thickening [9].
Fig. 6.2
(b) Application of the centerline method for wall thickness and wall thickening analysis of short-axis cine MR images obtained in a 68-year-old man with chronic myocardial infarction in the region of the left anterior descending artery (a). (c) Delayed-enhancement short-axis image shows transmural hyperenhancement (arrows) in the thinned myocardial wall of the septum and the infero-apical segment corresponding to scar tissue. Bull’s-eye plots show a reduced wall thickness and wall thickening in the scarred tissue (arrows). (d) b-SSFP image depicts a dyskinetic aneurysm of the LV apex with the presence of an apical thrombus (arrowhead)
Normal values for end-systolic wall thickening can be used for comparison to determine which myocardial regions are impaired. The most important clinical application of regional functional analysis is the assessment of reversibly injured yet viable myocardium in ischemic heart disease [10, 11].
Although, for daily clinical use, wall motion is often visually assessed, contouring of endo- and epicardial borders may be helpful to quantify motion (e.g., amount of centripetal motion of endocardial border during systole).
Accurate regional function analysis has become feasible with the introduction of CMR myocardial tagging (Fig. 6.3) allowing an highly reproducible quantitative assessment of mechanical properties such as myocardial strain deformation. It consists in applying, on a standard SSPF sequence, a radiofrequency prepulse perpendicular to the plane of the image, immediately following the ECG R-wave, appearing in the image as a grid of dark saturated lines. Dedicated computer algorithms have been developed to track the intersection points of the tagging lines over the cardiac cycle, to analyze the deformation of the saturation grid and sequent quantification of regional myocardial deformations. By applying this technique in multiple slices in both short-axis and long-axis directions, 3D-myocardial strain measurements can be performed, allowing an accurate quantification of circumferential and longitudinal shortening [12].
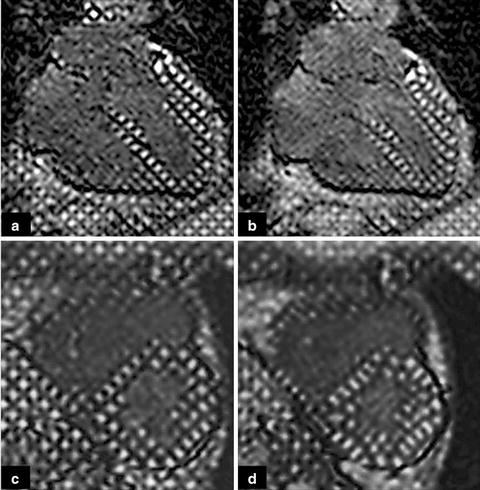
Fig. 6.3
End-diastolic (a, c) and end-systolic (b, d) 4-chamber and short-axis-tagged MR images
4 Assessment of Blood Flow in the Heart and Great Vessels
Cardiac-gated phase-contrast (PC) sequences with flow-encoding gradients are used to quantify velocity and blood flow in the heart and great vessels. 2D PC CMR sequences are the most commonly used in clinical practice and the flow quantification is based on the phase shift measurement induced in the protons in motion by the application of pulsed gradients.
PC can accurately quantify the regurgitant volume, either as an absolute value or as the regurgitant fraction. Each PC acquisition produced two sets of cine-images: a magnitude image, used for anatomic orientation, and a phase image in which the gray value of each pixel represents the velocity information in that voxel. For flow quantification, phase information acquired on a perpendicular plane through the jet of regurgitation, just near the valve, are required (Fig.6.4). Stationary spins are represented as mid-gray, while increasing velocities in either direction are shown in increasing grades of black or white. Black values show flow toward the viewer, whereas white values show flow away from the viewer. It is important to define the size of velocity encode window as close to the peak velocity as possible, to reduce aliasing of peak velocities and maintaining sensitivity for flow measurements. Measurement of the spatial mean velocity for all pixels in a region of interest of known area enables the calculation of the instantaneous flow volume at any point in the cardiac cycle. Calculation of the flow volume per heart beat can be made by integrating the instantaneous flow volumes for all frames throughout the cardiac cycle [13]. This technique has been validated in vitro and in vivo and is extremely accurate and reproducible [14]. The severity of regurgitation can be defined as mild (regurgitant fraction 15–20%), moderate (regurgitant fraction 20–40%), and severe (regurgitant fraction >40%) [15].
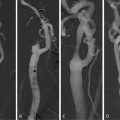
Fig. 6.4
Oblique coronal view (a) and oblique transverse long axis view (b) of the left ventricle outflow tract with slice positioned (yellow lines) for PC sequence (c) acquired in a through-aortic plane, just below the aortic valve annulus. (c) Phase image produced by PC sequence: black values show forward flow toward the viewer, whereas white values show backward flow away from the viewer. (d) Corresponding flow map obtained drawing the regions of interest (ROIs) on each phase. The regurgitant volume is obtained as the area under the curve of the negative portion (red) of the flow-time plot. The regurgitant fraction is obtained as the ratio of the regurgitant volume and the forward flow volume (e)
Application of PC to the proximal portion of the ascending aorta allows the assessment of left ventricular systolic function by evaluating the flow over a complete cardiac cycle. Such a study requires a PC acquisition in the oblique axial plane crossing the ascending aorta and the left ventricular stroke volume can be obtained tracing the lumen of the vessels in every phase of the cardiac cycle [16].
Quantification of the right ventricular and left ventricular outputs can be compared using through-plane flow measurements from the proximal ascending aorta and pulmonary trunk (Qp/Qs ratio = 1 in normal individuals), thus allowing quantification of shunts in patients with congenital heart disease [17].
5 Assessment of Rest and Stress Myocardial Perfusion
In patients with known or suspected ischemic heart disease, diagnosis of an hemodynamically significant stenosis, and assessment of functional significance of an anatomical lesion, is of crucial importance in the evaluation and therapeutic decision-making.
The intrinsic mechanisms of coronary microvascular adaptation (coronary reserve) do not allow to appreciate myocardial perfusion defects at rest. To detect significant stenoses of the epicardial coronary arteries, it is helpful to stress the patient so that a measure of the coronary flow reserve, or similar measures such as the myocardial perfusion reserve index, can be obtained [18]. Stress conditions are induced by physical exercise or pharmacological agents such as dipyridamole, adenosine, or dobutamine.
Compared with the radionuclide techniques, myocardial MR perfusion imaging has several advantages, including its lack of ionizing radiation, higher spatial resolution to allow analysis of transmural differences in myocardial blood flow (MBF), no attenuation problem related to overlying breast shadow or obesity [19].
Related posts:
 Relationship Between Plaque Echogenicity and Atherosclerosis Biomarkers
 Quantitative Computed Tomography Analysis in the Assessment of Coronary Artery Disease
 Quantitative MR Analysis for the Assessment of Carotid Atherosclerosis
 Carotid Angioplasty and Stenting
 Segmentation of Carotid Ultrasound Images
 Carotid Plaque Stress Analysis: Issues on Patient-Specific Modeling
Stay updated, free articles. Join our Telegram channel

Full access? Get Clinical Tree


