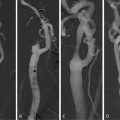
Fig. 4.1
Sample images illustrating the flow suppression capability of different BB-imaging techniques. (a) IS, (b) single-slice DIR, (c) multislice MDIR, and (d) MSDE. The residual flow signal is eliminated by the MSDE sequence but visible for other techniques (arrows). All images are presented using the identical window settings. Single asterisk, internal carotid lumen; double asterisks, external carotid lumen. Reprinted with permission from [24]
2.2.4 Fat Suppression
For accurate identification and characterization of plaque components, an effective suppression of subcutaneous fat is necessary [4]. Thus contrast of both intraplaque components and surrounding tissues can be increased in all commonly applied plaque imaging sequences, including T1-, T2-, and proton density-weighted sequences [26, 34]. Fat suppression is achieved by the application of a spectrally selective fat suppression technique, which suppresses signal and chemical shift artifacts of triglycerides by application of a fat-saturation pre-pulse. As triglycerides are mostly contained in subcutaneous fat, lipids within the necrotic core of plaques, consisting mainly of cholesterol and cholesteryl esters, are generally not affected by fat suppression [35].
2.2.5 Contrast Agents
In addition to the commonly used T1-, PD-, TOF-, and T2-weighted sequences, application of contrast material has been shown to improve the accuracy and reproducibility of quantitative plaque measurements [36]. Additionally plaque characteristics, which cannot be depicted by regular non-contrast-enhanced plaque MRI, such as inflammation and neovascularization may be detected and quantified.
The most widely used contrast agents in bb-MRI are nonselective gadolinium-based agents which reduce tissue T1 relaxation time and thereby significantly increase signal intensity on T1-weighted images [37]. This effect can be observed up to 30 min after injection, with a peak enhancement after 10 min [38]. Due to a higher blood supply, fibrous tissue and neovasculature have been reported to have higher signal enhancement compared to other plaque components, such as the poorly vascularized LR/NC, and thus help in the delineation of the fibrous cap and the LR/NC [37, 39]. Since regional plaque enhancement is also caused by increased permeability, a factor considered to be associated with plaque inflammation and rupture, gadolinium-based contrast agents can also be used to detect and quantify plaque inflammation using dynamic contrast-enhanced MRI (DCE), a technique which will be described in Sect. 4.3.
Intravenously administered ultrasmall superparamagnetic iron oxide (USPIO) particles are an example for a selective contrast agent in T2*-weighted imaging. USPIOs accumulate within macrophages, which are abundantly present in inflamed plaques, and thus cause a negative contrast by susceptibility effects. The application of USPIO and its possible role in characterization of the vulnerable plaque will be discussed in more detail in Sect. 4.4.
Recent research has focused on the development of gadolinium agents that bind to specific targets, by linking gadolinium chelates to polymers, polysaccharides [40], or nanoparticles. This approach has already allowed creation of specific agents that bind to thrombus [41] and factors which are correlated to angiogenesis (e.g., αvβ3-integrins) [42]. Recent animal studies have shown that Gadoflourine binds to lipid-rich plaque and thus can improve atherosclerotic plaque detection [43].
2.2.6 Image Processing/Processing Software
As information about plaque composition generally is derived by observations of images of various weightings, the complete review of the carotid vessels including evaluation of plaque characteristics and components may take a long time. Also certain conclusions such as volume measurements or wall thickness parameters can hardly be drawn by the naked eye. For quicker evaluation and quantification of morphology and plaque components several computer-aided tools, which are capable to implement this mass of information and present results in a simplified matter, have been proposed [21, 44]. These highly automated measurement techniques can reduce analysis time and reader-dependent bias and improve measurement reproducibility [45].
Essential steps in the evaluation process are image registration of multicontrast MRI images, segmentation of lumen and outer wall boundaries, and classification of tissue types based on their contrast properties [31]. Before the beginning of the reviewing process, images of all contrast weightings must be aligned. This step is necessary to account for patient movement during measurements and differences in coverage of the acquired image series. Furthermore the determination of certain landmarks, such as the carotid bifurcation and shape and size of the arterial lumen and the wall, allows matching of images acquired at various time points or with histology. For automated image registration several approaches, such as active edge maps [46] and voxel-based mutual information [47], have been proposed [31]. Automated or semiautomated image processing tools facilitate the assessment of three different basic types of plaque information: (1) plaque burden, (2) plaque composition, and (3) functional measurements that are determined by plaque composition. Figure 4.2 offers an insight into plaque information which has been generated by the use of the software tool CASCADE (University of Washington, Seattle, USA).
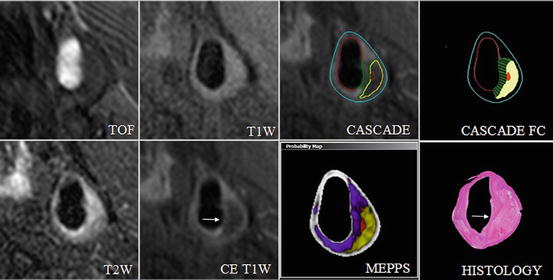
Fig. 4.2
Automated segmentation of bright- and black-blood, high-spatial-resolution, multicontrast in vivo CMR. Quantification of in vivo carotid magnetic resonance (CMR) (TOF, T1W, T2W, and CE T1W) using CASCADE to generate component outlines. The CASCADE fibrous cap (FC) is an additional algorithm that collects FC length, depth, and area. The automated map of the plaque is produced by the MEPPS algorithm. Loose matrix is shown in purple, lipid-rich necrotic core in yellow, and intraplaque hemorrhage in red on the MEPPS image. Histology from CEA confirms the components and the enhancing thick FC (arrow). In vivo CMR were acquired on a 3 T Philips Achieva scanner (Best, the Netherlands) along with the use of an 8-element phased-array carotid coil. CASCADE computer-aided system for cardiovascular disease evaluation, CE contrast enhanced, CEA carotid endarterectomy, MEPPS morphology-enhanced probabilistic plaque segmentation. Reprinted, with permission from [48]
3 Plaque Burden
“Plaque burden” is the amount of atherosclerotic plaque within the vessel wall of a certain artery and it has been shown in coronary arteries [49] and in carotid arteries [50] that plaque burden is associated with cardio- and cerebrovascular events. Of note, diseased vessels can contain large amounts of atherosclerotic mass without significant luminal narrowing due to compensatory arterial outward remodeling [51]. Thus, imaging methods which can reliably depict the lumen and the wall are needed to quantify the atherosclerotic plaque burden.
Maximum and mean wall thickness are parameters of plaque burden that are relatively insensitive to artery size or coverage [44]. High wall thickness parameters correspond with increased lipid content within the intima of the vessel wall and are the first parameters that can be observed in early atherosclerosis. In a prospective study of 154 initially asymptomatic patients, Takaya et al. could show that an increase in maximum wall thickness is associated with the occurrence of subsequent cerebrovascular events (hazard ratio for a 1-mm increase, 1.6; P = 0.008) [52]. In a subsequent retrospective study, patients with prior major cardiovascular or cerebrovascular events (MACE) were reported to have a significantly higher plaque burden (wall thickness) and plaque eccentricity (standard deviation of wall thickness) than a matched patient group without MACE [53]. Also measurements of mean wall thickness by carotid MRI are highly associated with B-mode ultrasound measurements of the carotid intima-media thickness [54], which has been associated with stroke in multiple long-term, prospective investigations [55].
The total volume of the wall or its components can be derived by addition of the total wall areas of the required section and multiplication with the slice thickness. However, care must be taken if volumes of various measurements are compared: Differences in body size and of the coverage of the artery may lead to false conclusions as both longer extent of coverage and larger vessel size may lead to high values, mimicking a larger disease burden [44].
The normalized wall index (NWI), a promising marker in the assessment of atherosclerotic plaque burden, is calculated as wall area divided by the total vessel area and is a very accurate and reproducible measurement [44]. NWI values of a normal carotid artery scatter around 0.4 [44]. Higher mean arterial NWI values (>0.56) have been associated with FC rupture and IPH in the carotid artery. Figure 4.3 demonstrates a list of plaque burden parameters commonly used.
Fig. 4.3
MR imaging parameters measured for carotids and thoracic aorta. MR imaging parameters measured for carotids and thoracic aorta. The red line indicates the measure of the lumen diameter; the teal line represents the vessel diameter; the green line represents the wall thickness. The area enclosed by the blue contour represents the lumen area and the area enclosed by the orange contour represents the total vessel area. The difference between the total vessel area and the lumen area provides the wall area. The normalized wall index is determined by the ratio of the wall area to the total vessel area. The top right panel shows the contours on a sample carotid image. Reprinted with permission from [53] (Color figure online)
When aiming at comparisons with histology these measurements can be necessary for calculating the percentage content of wall components such as lipids, calcifications, and fibrous tissues, as in many cases specimen shrinkage won’t allow comparison of absolute measurements.
A recent study sought to determine the strength of plaque burden and stenosis in classifying carotid high-risk features [56]. Analysis of 180 patients with either carotid stenosis >50% by duplex ultrasound or suspected coronary artery disease by multicontrast carotid MRI revealed that measures of plaque burden do not substantially improve disease assessment compared to stenosis. This seems likely, since high-risk features such as IPH and surface disruption occur across wide range of both parameters. However, assessment and quantification of plaque burden are not useless: presence of atherosclerotic plaque in the carotid arteries is an indicator of systemic disease and thus may be useful as a surrogate marker in clinical trials with anti-atherosclerotic therapies.
Both accuracy and reproducibility are important characteristics of an approach which is aimed to clinically assess and observe progression/regression or therapeutic effects in atherosclerotic disease.
Various studies have been performed on the accuracy of morphological measurements in the carotid arteries using bb-MRI. Comparison of measurements derived from in vivo and ex vivo MRI images has shown excellent agreement for the plaque burden parameters maximum wall area and wall volume [57, 58]. Area measurements of the lumen and the vessel wall seem to be independent of the weighting of a multicontrast MRI protocol used and tend to provide similar results [59], provided they were acquired with the same bb-technique and sufficient image quality was achieved. Additionally, in comparison with corresponding and validated 2D images, accuracy of 3D imaging has been validated [60].
MRI imaging of the carotid arteries also is highly reproducible on multiple scanner platforms [61], between scans [62], and between readers [62, 63]. Variability of quantitative plaque burden measurements ranges from 1.5 to 4% for lumen area, 4.5 to 5.8% for wall area, and 1.9 to 3.3% for outer wall area measurements. Variability of the NWI is approximately 3.0%. These measurements have excellent intraclass correlation coefficients, ranging from 0.90 to 0.98 [58, 64, 65].
4 Plaque Composition
MR plaque imaging techniques can not only be used for simple plaque burden measurements, but they are also well suited for the identification and quantification of plaque components. Focus in this field has been set on identification and quantification of components that characterize the previously mentioned “vulnerable plaque”—LR/NC, IPH, and fibrous cap. Multicontrast MRI plaque imaging has systemically been validated with histology to identify and quantify in vivo carotid plaque components, such as the LR/NC [17, 39, 66], calcification [16, 66], IPH [17, 66], surface disruption [67, 68], and markers of inflammation and neovasculature by the unique signal combination of different weightings [11].
These histology studies have shown that MR signal intensities of the main plaque components and the amount of contrast uptake are somewhat component specific (see Table 4.1); thus MRI is able to identify (and quantify) the main components of the atherosclerotic plaque with good correlation to histopathology [18, 26, 70] (see Fig. 4.4).
TOF | T1 | PD | T2 | CE-T1 | |
|---|---|---|---|---|---|
Lipid-rich/necrotic core | |||||
(A) Without hemorrhage | o/+ | o/+ | − | − | ↓ |
(B) With type I hemorrhage | + | + | −/o | −/o | ↓ |
(C) With type II hemorrhage | + | + | + | + | ↓ |
Calcification | − | − | − | − | ↓ |
Loose fibrous tissue | o | −/o | + | + | ↔ |
Dense fibrous tissue | o | o | o | o | ↑ |
Fig. 4.4
Correlation of MRI and histology. Plaque composition calculated as the percentage of the vessel wall area for MRI and histology. Reprinted with permission from [16]
4.1 Intraplaque Hemorrhage
IPH occurs frequently during the development of atherosclerotic lesions and is a significant step in plaque development from stable to unstable plaque [71]. The fundamental mechanisms that result in IPH have not been completely understood, but may be caused by two different mechanisms: True plaque rupture with cracks or fissures that originate at the luminal surface connects the underlying vessel wall tissue to the lumen and causes deposition of blood cells within the vessel wall [72]. Alternatively, IPH may occur secondary to rupture of immature neovessels within the plaque. These vessels often lack support by smooth muscle cells within the arterial wall and focal discontinuity of the endothelial lining makes them prone to leakage [48].
Detection of IPH by carotid plaque imaging is based on the degradation of hemoglobin into methemoglobin, which takes place about 12 h after hemorrhage. Presence of methemoglobin shortens the longitudinal relaxation time of surrounding protons and thus appears hyperintense on T1w images [70], such as on black-blood T1w fast spin echocardiography, time-of-flight, and magnetization-prepared rapid acquisition gradient echo (MP-RAGE). Additionally to T1w images a T2w black blood sequence can be used to differentiate between early subacute or type I (hypointense signal on T2w images) and late subacute or type II hemorrhage (iso- or hyperintense signal on T2w images). IPH findings have been extensively validated by histology for both 1.5 and 3.0 T [70, 73]. However, due to inherently low contrast in IPH regions accurate outlining of the hemorrhage area remains difficult with Pearson’s correlation coefficients for mean hemorrhage area between histology and MRI of r = 0.66 (P < 0.001) [16]. Application of tissue-specific imaging for IPH detection can improve performance, but has difficulties with the detection of small hemorrhages and the presence of heavy calcified plaques [73]. Recently, a new technique using a slab-selective phase-sensitive inversion recovery (SPI) sequence for assessment of IPH has been proposed and validated against histology specimens. In vivo and ex vivo measurements could show a significantly improved IPH wall contrast-to-noise ratio and blood suppression efficiency than the previously mentioned MP-RAGE and offer a better reproducibility of IPH measurements [74].
Since IPH has been shown to be one of the major driving forces in plaque development, assessment of presence of IPH in studies (work-up, risk assessment, therapeutically) is desirable. Instead of the general approach, which regards IPH as a dichotomous variable (present or absent), histology studies suggest that size [75] and age [76] of IPH might be important factors in disease severity. In the clinical setting, knowledge of the age of IPH can provide insight into the history and current condition of the biologically active plaque [21]. To date quantitative measurements of IPH area, sensitivity, specificity, and agreement with histology have remained problematic. For the combination of black-blood T1-weighted turbo spin echo and time-of-flight sequences in a multicontrast protocol, a good sensitivity of 90% has been reported. However, specificity for the detection of IPH in this setting is moderate (74%) and intra-reader agreement is limited [69]. When compared to matching histology, application of MP-RAGE for the in vivo detection of IPH provided the highest sensitivity and specificity with values of 84% and 84%, respectively. Application of the recently published SPI-Sequence showed a slightly higher accuracy than MP-RAGE and significantly higher IPH wall CNR [16].
MRI studies have shown that the presence of IPH may be a good indicator for unstable plaques. Together with fibrous cap status (thin or ruptured: hazard ratio, 17.0; P ≤ 0.001), larger mean IPH area (hazard ratio for 10 mm2 increase, 2.6; P = 0.006) and presence of IPH are the strongest predictors for the development of stroke in previously asymptomatic individuals (hazard ratio in patients with 50–79% carotid stenosis, 5.2; 95% confidence interval: 1.6–17.3; P = 0.005) [52]. Furthermore in symptomatic individuals with a stenosis degree between 30 and 69%, IPH has been shown to be a good predictor of recurrent stroke [77]. In contrast patients with absence of IPH at MR plaque imaging are significantly less likely to suffer stroke due to a ruptured plaque. Thus the absence of IPH may be considered as a marker of plaque stability and a lower risk of thromboembolism [78].
In vivo plaque imaging of the carotids has revealed that occurrence of IPH is not limited to symptomatic patients or vessels with advanced stenosis [79]. A prevalence of IPH in up to 15% of asymptomatic vessels with a stenosis <50% has been reported [79]. To date the significance of these complicated atherosclerotic plaques is unclear. To comprehensively elucidate the significance of complicated plaques in stroke patients without significant stenosis, a systematic, prospective bicentric study (carotid plaque imaging in acute stroke, CAPIAS), which is registered on http://www.clinicaltrials.gov (NCT01284933), has recently been initiated.
To date the definite role of IPH in plaque development and rupture has not completely been understood, but is believed to be a factor promoting plaque progression and consequently plaque disruption. Repeated IPH leads to deposition of free cholesterol from erythrocyte membranes, macrophage infiltration, and enlargement of the necrotic core and thus represents a potent stimulus in the development from the subclinical to the complicated atherosclerotic plaque [80]. Furthermore, the destabilization process might be accelerated by inflammatory mediators which stimulate the expression of extracellular matrix metalloproteinase and consequently lead to degradation of extracellular matrix and plaque microvasculature. Repeated rupture events and micro hemorrhages into the LR/NC are the consequence [81]. Previous histology-based studies demonstrated that the prevalence of IPH increases with the severity of carotid stenosis [82]. Recent findings, however, suggest that IPH already occurs in low-grade stenosed vessels and that the presence of IPH is a driving force of luminal occlusion [83] raising the question of which factor appears first (see Fig. 4.5). Prospective studies of patients with and without IPH and stenosis degree between 16 and 79% at baseline could show that after a period of 18 months percent change in wall volume and LR/NC was significantly higher in patients with IPH. Furthermore, patients with IPH at baseline showed an increased susceptibility to recurrent plaque hemorrhages [83, 85]. Additionally a significant impact of IPH on the vessel wall remodeling pattern was found: Lesions without IPH tend to expand outward and preserve the lumen (positive remodeling), while plaques containing IPH could be associated with inward (negative remodeling) remodeling and luminal narrowing [83].
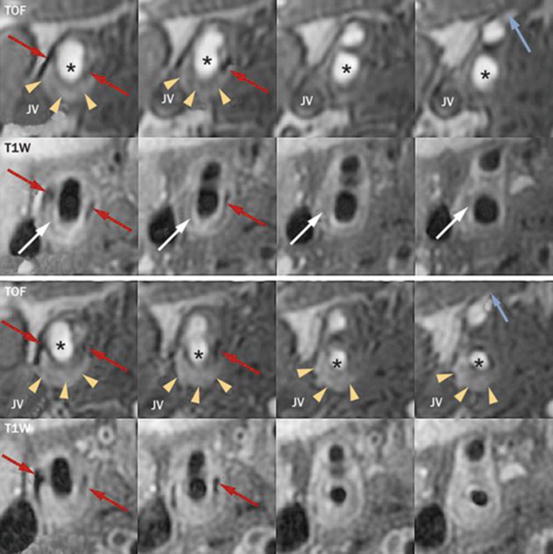
Fig. 4.5
In vivo evidence of the effects of IPH. Images are serial axial sections through a lesion of the carotid artery from TOF and contrast-enhanced T1W sequences. The upper panel is the baseline scan and the lower panel is the corresponding matched axial images at 36-month follow-up. Matching can be confirmed by calcification (red arrows), the flow divider (column 2), and the branching of the superior thyroidal artery off the external carotid (blue arrow, column 4). The asterisk indicates the lumen of the common and internal carotid arteries. The lesion contains a lipid-rich/necrotic core (white arrows, hypointense signal on CE-T1W) and IPH (yellow arrowheads, hyperintense signal on TOF). Notice the substantial increase in IPH at follow-up and corresponding reduction in lumen area most pronounced in columns 3 and 4. IPH intraplaque hemorrhage, Jv jugular vein, T1W T1 weighted, TOF time-of-flight. Reprinted, with permission from [84] (Color figure online)
4.2 Thrombus/Juxtaluminal Hemorrhage
In contrast to IPH, etiology of thrombus formation seems to be clear. Erosion, ulceration, or plaque rupture, each recognized markers of unstable plaque, leads to exposure of the thrombogenic LR/NC and subsequent platelet aggregation and fibrin deposition [1]. Formation of thrombus can lead to luminal occlusion of the affected vessel and acute cerebrovascular events, or promote plaque progression. Teng et al. examined the relation between juxtaluminal hemorrhage/thrombus (JLH/T) and subsequent events in 42 TIA patients with mild-to-moderate carotid stenosis by high-resolution multicontrast MRI. During a 2-year follow-up period 52.4% of the patients with JLH/T at baseline experienced recurrent cerebrovascular events in the territory of the index carotid artery, while none of the patients without JLH/T had an ischemic event [86].
Various approaches have been suggested for the detection of thrombus, including diffusion-weighted MR [87] and combination of TOF-, intermediate-, T1-, and T2-weighted images [88]. Similar to imaging of IPH, thrombus imaging preferentially utilizes the T1-shortening effects of the degrading hemoglobin, which acts as an endogenous contrast agent. In a histology-validated study with 26 patients scheduled for carotid endarterectomy, Kampschulte et al. reported to not only correctly detect hemorrhage with a high sensitivity but also to distinguish juxtaluminal hemorrhage from intraplaque hemorrhage with an accuracy of 96% by using an in vivo multicontrast-weighted MRI protocol at 1.5 T [88]. Thrombus was identified by a hyperintense signal on TOF- and T1-weighted images adjacent to the lumen and absent dark band in TOF images. This technique was also applied in a trial with 23 symptomatic patients with high-grade stenosis [89] in order to evaluate the potential of MR imaging to differentiate between symptomatic and asymptomatic plaques. Besides higher incidence of cap rupture, type I hemorrhage, and complicated AHA type VI lesions, symptomatic plaques were more likely to show juxtaluminal hemorrhage and thrombus, whereas IPH was common in both symptomatic and asymptomatic plaques. Although it has been shown that MRI is able to identify and detect juxtaluminal hemorrhage/thrombus, there is no data demonstrating that MRI is able to quantify these components.
4.3 Lipid-Rich/Necrotic Core
The LR/NC is a mixture of lipids, cellular debris, blood, and water in various concentrations and is separated from the carotid lumen by a smooth, cell-rich fibrous cap [33]. The main components of the LR/NC are cholesterol and cholesterol esters. Differences in the lipid mixture and presence/absence and type of hemorrhage within the LR/NC result in a wide spectrum of signal intensities in MRI images and represent different risks for plaque rupture (see also Sects. 4.1 and 4.2). Lesions with a thin fibrous cap and a relatively large necrotic core, so-called thin cap fibrous atheromas, are considered to be most prone to rupture and have been associated with symptoms [90, 91].
Cholesterol and cholesterol esters have a rapid transversal (T2) decay. Consequently, given the absence of IPH, the LR/NC has a characteristic hypointense signal on T2-weighted images and appears iso/hyperintense on T1w and TOF images [92]. However, IPH into the LR/NC can cause T1-shortening effects and increase the relative signal intensity within the LR/NC on T1w images [11] (see Table 3.1). In our experience the most reliable marker/indicator of LR/NC is the complete absence of contrast enhancement (see Fig. 4.6).
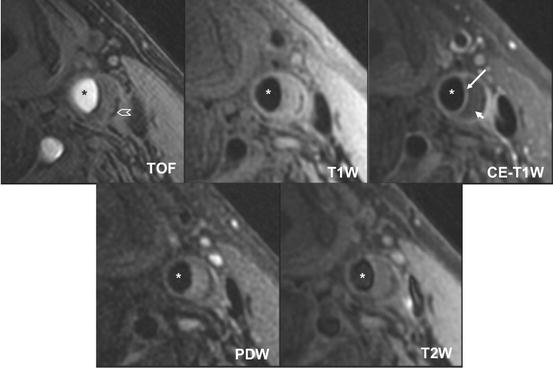
Fig. 4.6
Atherosclerotic carotid artery lipid-rich/necrotic core. Multicontrast black– and bright-blood sequences show a large lipid-rich/necrotic core (small arrow) with an intact thick fibrous cap best seen in the post-contrast T1-weighted (CE T1W) image (long arrow). Calcification is also visible at the base of the plaque (chevron). Asterisks are placed on the lumen. Reprinted with permission from [45]
Initial experiments which were performed on ex vivo endarterectomy specimens by using T1-, T2-, and intermediate-weighted imaging demonstrated that the presence of the lipid-rich/necrotic core could be detected with sensitivities and specificities ranging from 92 to 100% [93, 94]. Translation of this approach to in vivo imaging showed that the LR/NC and/or IPH could be identified with a sensitivity of 85%, specificity of 92%, and accuracy of 87%. Additionally a good agreement between MRI and histological findings, with a value of κ = 0.69, was reported [17].
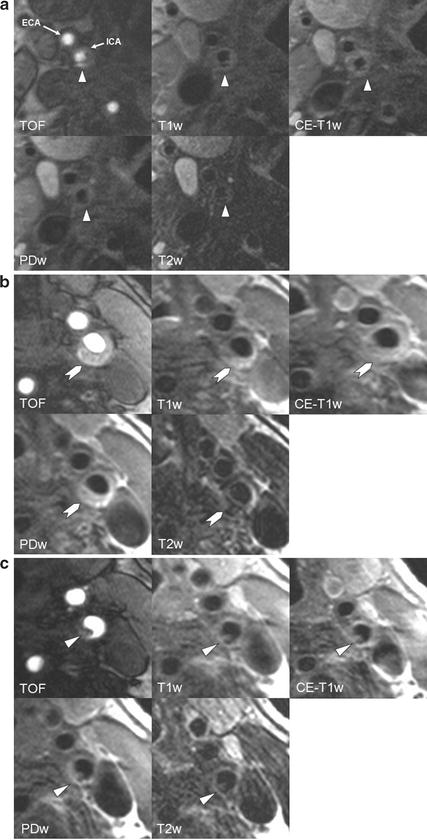
Fig. 4.7
In vivo identification of FCR, IPH, and thrombus. (a) MR images of the right internal carotid artery (ICA) of a 78-year-old patient with a right-hemispheric stroke ipsilateral to a 60% carotid stenosis 4 days before the MRI scan. The surface of the plaque appears irregular and TOF images show a very bright area posterior to the lumen of the ICA, corresponding to a hypointense area in all other sequences, suggestive of a ruptured fibrous cap. It is tempting to assume that the rupture of the fibrous cap—which is known to cause thrombotic complications—is the reason for the ischemic stroke in this previously asymptomatic patient. (b) Complicated AHA type VI plaque of a 82-year-old symptomatic patient without cardiovascular risk factors. The patient suffered a stroke ipsilateral to the left carotid artery 5 days before the MRI scan. The chevron points to an eccentric plaque which is hyperintense on TOF and T1w images, indicative of intraplaque hemorrhage. (c) Images of the same patient (b) show a small mural thrombus 4 mm further distally (arrow)
Recent reports have demonstrated that MR imaging is not only able to identify the LR/NC, but that it also offers information for quantification. The ability to quantitatively assess the LR/NC has two advantages: high-risk plaques with a large LR/NC, proximally located to the lumen, can be identified and the effect of lipid-lowering therapy on disease burden can be directly evaluated. In a first step ex vivo fat measurements, acquired with T1-, intermediate-, T2-weighted, and diffusion-weighted imaging, were compared with histological findings and showed a sensitivity and specificity for necrotic tissue of 83.9% and 75%, respectively [15]. Again, translation of these findings in vivo showed that by using TOF- and T1-, T2-, and intermediate-weighted sequences, measurements of the LR/NC did not differ significantly from findings on histologic specimens (23.7% vs. 20.3%; P = 0.1). Additionally a strong correlation between MR and histologic area measurements was found (r = 0.75; P < 0.001) [4, 16].
Comparison of T1-weighted pre- and post-contrast images yields a more accurate delineation of the LR/NC and thus improves reproducibility and quantification [39]. In contrast to the surrounding fibrous tissue, the necrotic core is poorly vascularized and therefore shows only little if any enhancement in images after administration of gadolinium-based contrast material [95]. Additionally, depiction of the fibrous cap, which is well vascularized and separates the LR/NC from the lumen, is improved after contrast administration, facilitating differentiation of the fibrous cap from the LR/NC [95]. Gadolinium-enhanced T1 images of the LR/NC have been shown to provide approximately twice the signal-to-noise ratio with a contrast-to-noise ratio similar or better than that of T2w images [37], resulting in an increased intraclass correlation coefficient from 0.94 to 0.99 and from 0.85 to 0.93 for the intra- and inter-reader measurements, respectively [36].
Qualitative and quantitative assessment of the LR/NC has been successfully applied in longitudinal studies, observing plaque development under anti-atherosclerotic therapy. Findings and results of these studies will be discussed in the Sect. 7.
4.4 Fibrous Tissue
The production of interstitial collagen is thought to be an attempt to repair damaged areas within the plaque following IPH or lipid accumulation [69]. It is generally believed that fibrous tissue is a marker of plaque stability. The MRI signal pattern of fibrous tissue has been reported to be similar to the signal of the LR/NC without IPH [16] and is almost isointense to the signal of the normal arterial wall. Differentiation of both tissue types can be achieved by contrast-enhanced T1w sequences; in contrast to the necrotic core, fibrous tissue usually does enhance [39]. A histology study which quantified the amount of dense fibrous tissue showed no significant differences between MRI and histology measurements (66.3% vs. 64.0%; P = 0.4) [16].
4.5 Fibrous Cap
Plaque rupture with subsequent thrombus formation is the most common cause for ischemic events [96]. Ulceration, discontinuity of the fibrous cap, and thrombus are markers of such an event (see Fig. 4.7a–c). Consequently the status of the fibrous cap, which has been defined as a distinct layer of connective tissue completely covering the lipid-necrotic core [1], is considered to be one of the key features of vulnerable plaques. Histopathology studies have shown that the prevalence of plaque rupture is significantly higher among patients with a past history of an ischemic neurological event [97]. Studies comparing histological carotid endarterectomy specimens with previously acquired MR images confirmed these findings. Patients with ruptured caps suffered significantly more often from ischemic symptoms (70%) than those with thick fibrous caps (9%). Compared with patients with thick fibrous caps, patients with ruptured caps were 23 times more likely to have had a recent TIA or stroke (95% CI = 3, 210) [98]. For the carotids cutoff values for a high risk of plaque rupture have been reported to be a minimum cap thickness of <200 μm and a representative mean cap thickness of <500 μm [99]. Due to improvements in hardware and sequence setup, high-resolution MRI allows depiction of these small structures with diagnostic quality and thus not only allows detection of prior plaque rupture but also differentiation between stable lesions (thick cap) and high-risk disruption-prone (thin cap or ruptured cap) vulnerable plaques [16].
For optimal depiction of the lumen surface and the fibrous cap, a combination of black-blood and bright-blood imaging techniques is used. In 3D TOF MR angiography images the fibrous cap appears as hypointense band or rim surrounding the bright lumen [67]. This approach is already sufficient for discrimination of intact thick cap from intact thin and disrupted cap in vivo and has a high level of agreement with histology (with a Cohen’s k (95% CI) value of 0.83 (0.67–1.0) and a weighted k value of 0.87) [67]. Furthermore for this approach a high test sensitivity (0.81%) and specificity (0.90%) for identifying an unstable cap in vivo have been reported [100]. Additionally the fibrous cap shows hyperintense signal relatively to the underlying LR/NC on T2-weighted images [39] and is in strong agreement with histological findings [68]. Especially in cases in which IPH into the LR/NC increases signal intensity on T2-weighted images, gadolinium-based contrast imaging can help delineate the LR/NC and the fibrous cap by increasing the signal of the fibrous cap in T1-weighted post-contrast images and allows quantification of both components. In a MRI study this approach led to good intra- and inter-reader agreement (k = 0.96 for intra-reader; k = 0.64 for inter-reader) for the status of the fibrous cap [101]. Additionally measurements of the fibrous cap including fibrous cap length and area in contrast-enhanced T1w images showed a good correlation between MRI and histology measurements (r = 0.73–0.80, P < 0.001) [39].
4.6 Calcification
Calcification is commonly found in atherosclerotic vessels and may occur in both viable and necrotic parts of the plaque. The exact role of calcium deposition and its contribution to plaque stability have not completely been understood. While some studies report an association of presence and extent of calcium deposition with an increased risk of plaque rupture [102], others observed a stabilizing, protecting effect [103]. A systematic review reported that clinically symptomatic plaques tend to have a lower degree of calcification than asymptomatic plaques and that calcification percentage of the vessel wall may be a valuable parameter in the assessment of plaque stability [104]. Li et al. additionally conjectured that calcium within the LR/NC may even stabilize the plaque by adding bulk [105]. Plaques with a higher calcification percentage may have smaller LR/NC size, which could decrease plaque vulnerability [104].
Besides general calcium content within the plaque the location of the calcification might also be important. Calcifications within or close to the fibrous cap, so-called superficial calcified nodules, may be encountered in plaques irrespective of the general calcification degree [1]. Those structures may protrude through the fibrous cap into the lumen or rupture the fibrous cap and may thus act directly or indirectly thrombogenic [3]. Model-based stress studies of carotid plaques could show that maximum wall stress increased by 47.5%, when the calcification was located within the thin fibrous cap, indicating an increased risk of plaque rupture [105]. Calcium location within the FC further away from the lumen or within the LR/NC had no or little impact on plaque stress. Due to their pro-rupture characteristics, superficial calcified nodules are considered to be one of the minor criteria in the evaluation of the vulnerable plaque [3].
MRI has been successfully applied in carotid plaque imaging due to its high ability to distinguish soft tissue. However, for exact depiction and quantification of calcium other methods such as CT and ultrasonography are superior. Due to a low water (and thus proton) content, calcifications can be detected as areas of relative hypointensity on T1- and T2-weighted and proton density images and TOF MR angiograms [16]. Measurements at 1.5 T demonstrated that multicontrast MR has a high sensitivity (98%) and specificity (99%) for detection of plaque calcification ex vivo and good in vivo sensitivity (84%) and specificity (91%). When measured as percentage of wall, a significant difference between calcium measurements in MRI and histology can be observed (9.4% by histology vs. 5.0% by MRI; P < 0.001). Absolute area measurements, however, have high correlation (r = 0.74; P < 0.001). This might be caused by signal averaging problems in hypointense areas within the plaque which make them appear smaller than they really are [16].
Since superficial small calcified nodules may present with the same hypointense signal as the background blood in black-blood sequences, identification can be more difficult than that of calcification deeper within the plaque. However, addition of a bright-blood sequence (e.g., TOF) facilitates delineation of juxtaluminal calcification from the bright lumen [4, 88].
At higher field strengths increased susceptibility may alter quantification and detection. Comparison of area measurements at 1.5 and 3.0 T found that calcification was significantly larger at 3.0 T (P = 0.03) with an intraclass correlation coefficient of 0.79 [7].
5 Functional Imaging
Multicontrast MRI enables to not only reliably assess plaque morphology but is increasingly used for functional and molecular measurements of the vessel wall. Even though these methods are not ready for everyday clinical use and remain for the time being experimental, studies have shown promising results. Current aims of research are imaging and quantification of macrophage content and neovasculature, both assumed to be related to plaque inflammation and subsequent plaque vulnerability. The currently applied techniques have the advantage that after application of contrast material, signal of those plaque characteristics can not only be localized but also quantified, enabling these techniques to deliver clinical markers for therapeutic studies and studies exploring factors of plaque progression.
5.1 Inflammation
Inflammation is considered to be an important factor in lesion progression and plaque destabilization and is a recognized risk factor for the vulnerable atherosclerotic plaque. Accumulation of lipids in the vessel wall leads to liberation of pro-inflammatory cytokines which is followed by tissue infiltration of inflammatory cells such as macrophages and lymphocytes [81]. During the process of plaque progression inflammation is characterized by increased endothelial permeability, macrophage infiltration, hypoxia within the vessel wall, and plaque angiogenesis [45]. The recruited macrophages absorb lipids, produce extracellular matrix degrading enzymes (e.g., MMP-1), undergo apoptosis, and contribute to the development and growth of the LR/NC and thus are considered to be one of the key cellular mediators in the inflammatory process [106]. Histological studies have shown that the extent and the distribution of inflammation, and consequently that of macrophages, are associated with plaque stability. Risk for rupture and subsequent thromboembolism has been reported to be especially elevated with inflammation and neovascularization in the shoulders of the fibrous cap or within the LR/NC [107, 108]. Thus, detection of macrophage activity and consequently inflammation within the atherosclerotic plaque could potentially help distinguish between vulnerable and more stable plaques and thus remains one of the key goals in atheroma imaging.
Image regions containing inflammation are associated with elevated tissue perfusion and increased permeability. Consistent with this notion, nonspecific contrast agents with relatively high molecular mass (e.g., Gadolinium) have been observed to accumulate in hyper-permeable plaque areas and can thus be used to identify plaque inflammation [48]. The advantage of this method is that assessment is not limited to the identification of inflammation, but also quantitative measurements of the enhancement pattern can be obtained [109]. This approach is also followed in dynamic contrast-enhanced (DCE) imaging which will be discussed below. Furthermore, specific ex vivo or in vivo labeling of cells which are involved in the inflammatory process allows observation of cell migration and accumulation into the high-risk plaque over time. Ultrasmall superparamagnetic iron oxide particles (USPIOs) accumulate especially in activated macrophages and generate a signal loss on T2*-weighted imaging. Like Gadolinium-enhanced imaging, USPIO uptake is considered to be a good marker for the extent of inflammation within the plaque [110].
5.2 Neovessels
Neoangiogenesis is generally associated with plaque inflammation, and has been explained as a response to the hypoxic conditions in the thickened tunica media of advanced plaques [111]. However, various recent observations suggest that the formation of new blood vessels may already begin in the early stages of plaque development and thus sustains inflammation by facilitated extravasation of recruited inflammatory cells [112]. In a previous study microvessel density was found to be not only correlated with the presence of inflammation within the plaque but also was increased in thin cap atheromas and ruptured plaques [113]. Since the newly formed blood vessels which originate from adventitial vasa vasorum often are immature and prone to leakage, they also seem to play a major role in the etiology of IPH. High microvessel density thus is considered to be a driving force in plaque growth, destabilization, rupture, and symptoms [113, 114]. Techniques that allow specific in vivo identification of neoangiogenesis consequently may offer valuable information about the role of neoangiogenesis in the development of IPH, monitoring of agents that inhibit angiogenesis, and identification of high-risk plaques.
Angiogenic areas and vessels can be detected in MRI by contrast-enhanced imaging. Similar to imaging of inflammation this can be achieved by selective and nonselective agents. Nonselective dynamic contrast-enhanced (DCE) MRI using long circulating contrast agents (e.g., gadolinium) that accumulate in plaque over time detect vascular permeability which can be used to quantify vessel density [115]. Targeted contrast agents (e.g., αvβ3-integrin), however, may detect angiogenesis by specific binding to receptors which are overexpressed in angiogenically activated endothelial cells [116]. These selective mediators additionally have the advantage that besides combination with contrast agents also targeted therapies are possible [117].
5.3 Dynamic Contrast-Enhanced MRI
Due to the importance of plaque inflammation and neovascularization in plaque progression and development of vulnerable plaques, high effort is put into the detection of these factors. Since conventional carotid MR imaging is unsuited for quantification and assessment of functional parameters, contrast-enhanced MR techniques have been increasingly used for this purpose. Dynamic contrast-enhanced (DCE) MRI was primarily used to investigate vascular permeability in tumors but has also been considered to be useful in studies on atherosclerosis [118]. DCE-MRI permits assessment of parameters for neovascularization and permeability with kinetic analysis of contrast agent uptake from the bloodstream into the plaque. Strong enhancement after application of a contrast agent (preferably gadolinium-based agents) is considered to be an indicator for a vascular supply and increased permeability which facilitates contrast agent uptake into the plaque and is thus considered to be a sign of inflammation [115, 119].
For the acquisition of dynamic contrast-enhanced MR images, images are repetitively acquired at preselected locations before and after the administration of a gadolinium-based contrast agent [120]. Extravasation of the contrast agent alters the signal in the surrounding tissue proportional to its concentration [112]. In a next step the acquired signal intensities are converted into concentration curves, provided that a pre-contrast relaxation map has been obtained and the relationship between signal intensity and concentration is known for the specific MR sequence used. Alternatively a linear relationship between signal intensity and contrast agent concentration can be assumed. However, this linearity has been reported to be valid only for low contrast agent concentrations and may not be accurate in areas with high contrast agent uptake or in the blood plasma. The change of contrast agent concentration and consequently the signal intensity is followed over time during the dynamic scan and contains information on the amount of tissue vascularization and other tissue characteristics, such as surface area product, extraction fraction, and blood flow [112]. Images of a T1-weighted “localizer,” which covers the area of the DCE sequence, can be acquired before or after the dynamic sequence and is useful for identification of the lumen and wall boundaries in the further evaluation process during which results of the T1-weighted sequence (anatomical) and the DCE sequence (functional) are merged. In a last step tissue parameters related to neovascularization and inflammation can be calculated by application of either model-based or model-free approaches [120]. Figure 4.8 offers an illustration of the necessary steps for obtaining quantitative data.
Fig. 4.8
Illustration of the processing steps in measuring adventitial K trans. Reprinted with permission from [119]
Based on the two compartment model, initially proposed by Tofts and Kermode for the study of multiple sclerosis, two valuable parameters K trans and vp can be obtained. K trans has been defined as the transfer constant from the plasma to the tissue compartment and is related to blood flow, capillary surface area, and permeability making it a good marker for inflammation. Studies comparing MR images with corresponding histology specimens found K trans to correlate with macrophage (r = 0.75, P < 0.001), microvessel (r = 0.71, P < 0.001), and loose matrix (r = 0.42, P = 0.03) content [115]. Additionally measurements of K trans in the carotid arteries were found to significantly correlate with serum markers of inflammation and pro-inflammatory risk factors, such as high C-reactive protein levels, low high-density lipoprotein (HDL), and smoking [119].
The partial volume of blood (vp) is a parameter which reflects the microvessel area within the plaque, which with increasing area may facilitate cell extravasation. In a comparison of DCE with histological measurements an overestimation of the neovessel amount was found. However, in the same study a correlation of 0.80 between vp and the fractional area of microvessels was reported, making vp an effective marker of plaque microvasculature [121].
Alternatives to kinetic modeling include model-free approaches including calculation of the area under the curve (AUC) of the contrast agent uptake, time to peak (TP), and wash-in or wash-out slopes [112]. Although these parameters are easy to acquire and calculate, their relationship with true physical quantities is not obvious and therefore can’t be used for definite assumptions about capillary permeability or blood volume [122].
DCE-MRI is an experimental method which is easily integrated into preexisting MRI protocols for vessel wall characterization; image acquisition time is short (minutes) and clinically available and safe contrast agents are utilized [45]. Future developments in DCE-MRI of atherosclerosis may benefit from improvements in kinetic modeling algorithms and image quality. Current algorithms, such as the one used by Dong et al. [123], require a minimum of 2-mm carotid arterial wall thickness and thus preclude the evaluation of vessels with thinner walls. Imaging of those early lesions however could provide valuable information on plaque initiation and facilitate initiation of prospective studies. The major difficulty encountered in the use of bright-blood DCE-MRI is the influence of the hyperintense lumen signal, which impedes adequate evaluation of small structures adjacent to the lumen [123]. Thus development of black-blood DCE imaging sequences may lead to a clearer depiction of the vessel boundaries and enable imaging of thinner walls. Another limitation of the current technique is the relatively low SNR. Thus intraindividual measurements suffer from significant variations and by this still prevent a reliable assessment in individuals.
5.4 USPIO
Ultrasmall Superparamagnetic Iron Oxide (USPIO) particles can directly detect and quantify macrophage content within the plaque in vivo and thus provide information on the extent of plaque inflammation from a different approach than the previously described DCE-MRI [124]. USPIOs, such as Ferumoxtran (commercially known as Sinerem), are small iron particles which are administered intravenously after solution in suspension. A thick and complete cover of dextran promotes a long blood circulating time of more than 24 h in humans, before elimination by the reticulo-endothelial system in the liver [125]. The optimum time for imaging USPIO uptake has been found to be between 24 and 48 h with a peak at 36 h [126]. Forty-eight hours after contrast agent administration the signal-altering effect decreases but can be observed up to 96 h. Iron oxide particles create a large dipolar magnetic field gradient (magnetic field inhomogeneities) that acts on the water molecules surrounding the particles and reduce detectable magnetization [127]. This effect has its biggest influence on the transverse (T2) relaxivity of tissue and can be observed as T2 or T*2 shortening effects. Consequently USPIOs which have accumulated within activated macrophages can be recognized in T2*-weighted imaging as areas with focal signal loss. While the selective accumulation of USPIO in macrophages is well established, their uptake into the cell has not yet been completely understood. Several pathways including pinocytosis, phagocytosis, and cell surface receptor-bound uptake have been suggested for USPIO uptake, which seems to take place in an unsaturable manner [125]. Also the time point of USPIO uptake into the macrophage remains unclear. Possible mechanisms include (a) uptake into activated blood monocytes before extravasation into the plaque, (b) transcytosis of USPIOs from the blood into particularly inflamed tissue due to increased permeability, followed by uptake into in situ macrophages, and (c) transport of USPIOs into the pathological tissue [128].
Imaging of carotid plaque inflammation with USPIO has been performed in both animal [129] and in human studies [126, 130]. Application of USPIO-containing contrast agents allowed direct depiction of macrophages within atherosclerotic plaques. This assumption was validated by imaging the carotid arteries before and after application of USPIO in patients scheduled for carotid endarterectomy [124]. MRI images were correlated with the histological findings in the surgery specimens. Macrophages detected positive for iron in histology were visualized in 24 of 27 patients with an average reduction in signal intensity induced by the USPIO of 24%. These findings and observations from animal studies suggest that USPIO accumulation and the resulting signal alternation can be used as biomarkers for inflammation in atherosclerotic plaques. This assumption has been strengthened by the finding that USPIO is detected preferentially more in ruptured and rupture-prone lesions than in stable lesions (75% vs. 7%) [130]. Interestingly USPIO enhancement cannot only be encountered in symptomatic plaques: A study by Tang et al. [131] compared truly asymptomatic plaques of asymptomatic patients with contralateral asymptomatic vessels to the symptomatic side and found that inflammation could be detected by USPIO in both subject groups, suggesting subclinical inflammation to be a significant risk factor in asymptomatic disease.
Although USPIO imaging has proven to be a feasible method and has been applied in a variety of studies, larger scale studies are necessary to prove the diagnostic accuracy and potential effects on clinical management. Furthermore the analysis of serial MR measurements to quantify USPIO uptake still presents a number of challenges. The most important limitation of USPIO is that sometimes it creates only relatively modest negative contrast which can only be quantified by the use of dedicative quantitative algorithms [125]. This is especially a problem in images with a limited SNR, heavy calcified plaques, and blood degrading products, which can have strong susceptibility effects on gradient echo sequences. To date, the general approach in USPIO imaging relies on measurements performed at least at two time points (before and after administration of contrast medium) about 24 h apart. This not only poses a logistic challenge for patients but also might lead to signal alternation due to patient positioning, coil inhomogeneities, and noise between visits.
Additionally at the moment there is no consensus on the use of the methodology used on quantification of signal reduction. Some of the proposed approaches rely on normalization of the signal intensity to the adjacent sternocleidomastoid muscle. However, this suggests that the adjacent muscle does not enhance even though it is perfused by blood containing USPIOs. This might lead to a systemic bias of the measured USPIO uptake and hence the “true USPIO effect” [125].
6 Biomechanical Stress
The previous sections of this chapter have discussed the impact of morphological and compositional features of the vessel wall on the development of atherosclerotic lesions. However, atherosclerotic disease does depend not only on the influence from extraluminal plaque features that destabilize the plaque, but also on effects from the blood on the vessel wall. Comparison of postmortem plaque distribution to in vitro fluid dynamic models has provided a relatively direct insight into the association between wall shear stress (WSS) and the focal development of atherosclerotic lesions [132]. Both ultrasound and MR imaging are generally suited for direct assessment of wall thickness and blood velocities (from which WSSs are derived) in straight vessel sections. However, quantification of blood velocities remains difficult in areas with non-laminar flow, such as the carotid bifurcation, which is the preferred location for initiation of atherosclerotic disease [133].
When looking at the luminal site and blood flow, two primary mechanical forces of hemodynamic origin with impact on vessel structure and remodeling can be observed: fluid wall shear stress and tensile stress. Shear stress is the frictional force per unit area, exerted on the luminal vessel wall and endothelial surface by and in the direction of the blood flow [134]. Blood vessel segments with slow, turbulent flow and temporal fluctuations of flow direction, such as in the carotid bifurcation, experience only weak net hemodynamic shear stress and seem to be most vulnerable to atherosclerotic remodeling [132, 135, 136]. Fast and laminar flow, resulting in higher levels of shear stress, in contrast seems to have a protective effect [137]. Alternation in the gene expression of endothelial cells towards pro-atherogenic effects due to a low magnitude of shear stress might be one of the factors that induce lipid accumulation, thinning of vascular smooth muscle cells, outward remodeling, decrease of collagen content, and thinning of the fibrous cap [134, 138].
Related posts:
 Relationship Between Plaque Echogenicity and Atherosclerosis Biomarkers
 Quantitative Magnetic Resonance Analysis in the Assessment of Cardiac Diseases
 Quantitative Computed Tomography Analysis in the Assessment of Coronary Artery Disease
 Carotid Angioplasty and Stenting
 Segmentation of Carotid Ultrasound Images
 Carotid Plaque Stress Analysis: Issues on Patient-Specific Modeling
Stay updated, free articles. Join our Telegram channel

Full access? Get Clinical Tree


