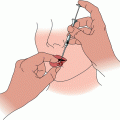
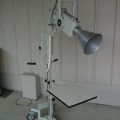
Fig. 1
Therapeutic window. (a) The optimal dosage range lies along the vertical purple line where the probability of cure is high while normal tissue reactions are minimal (Modified from Matthew Beasley, David Driver and H Jane Dobbs, Complications of radiotherapy: improving the therapeutic index, Cancer Imaging (2005) 5, 78–84.). (b) The therapeutic index lies within the area denoted by the blue arrow
The optimal dosage range lies along the vertical purple line where the probability of cure is high while normal tissue reactions are minimal. The therapeutic index lies within the area denoted by the blue arrow (Fig. 1b).
Treatment Factors
In order to eradicate a tumor in radiation therapy while staying within the desired therapeutic index, several factors play an important role including dose of radiation, time of dose delivery, and fractionation of dose. As described in a previous chapter, dose is a physical quantity of radiation. Dose refers to the amount of energy absorbed from a beam of radiation at a given point in a medium. The two SI units of dose are in gray (Gy) or centigray (cGy). 1 Gy = 1 J/kg (joule/kilogram) and 1 cGy = 0.01 J/kg, so 1 Gy = 100 cGy.
Choice of dose and fractionation depend upon the radiosensitivity of the tumor, size of the treatment volume, proximity of dose limiting structures (i.e., bone and brain), vascularity of the area, and cosmesis desired.
Time, Dose, and Fractionation
Time, dose, and fractionation refer to the schedule of the radiation treatments to be administered. The probability of tumor control obviously increases with a higher total dose, but so does the issues of early and late complications. To mitigate this problem, multiple fractions of dose with specific intervals are delivered. The different intervals and doses per fraction should be specifically based upon the area and size treated. When dose is administered in fractions and not all at once, it is referred to as dose fractionation. Fractionation of dose in radiotherapy is largely concerned with improving tissue tolerance. Much larger cumulative doses can be administered with less long-term adverse effects if the total dose is divided into fractions or increments and spread over a period of days or weeks.
The increased tissue tolerance provided by fractionation is principally due to the multi-hit characteristics of cellular damage and death. Cell survival curves in relation to rapid repair and recovery of targets in the cells. Cellular repair is usually completed in less than 20 h with respect to those targets associated with the capability of a cell to divide, replicate, and clone. The time required for minimal repair is 6 h for most tissues [2]. Fractionation increases tumor damage through oxygenation and redistribution of tumor cells. Redistribution (assortment) is when radiotherapy is given to a population of cells. Cells in S-phase are typically radioresistant, whereas those in late G2 and M phase are relatively sensitive. A small dose of radiation delivered over a short time period (external beam or high dose brachytherapy) will kill a lot of the sensitive cells and less of the resistant cells. Over time, the surviving cells will continue to cycle. If a second dose of radiation is delivered some time later, some of these cells will have left the resistant phase and be in a more sensitive phase, allowing them to be killed more easily. With the proper fractionation scheme, a balance between the response of the tumor and early and late reactions to the normal tissue can be achieved. Cancer cells do not repair damage at low doses as do normal tissue cells. Fractionation of radiation doses spares slowly responding normal tissues as they have a greater capacity for tissue repair than rapidly responding tumor tissue. Tissue repair and the sparing of slowly responding normal tissues is the reason that most radiation therapy is delivered in multiple small fractions.
The Effect of Dose
At low doses, single-strand breaks and repair of sublethal hits dominate. High doses bring double-strand breaks with a higher percentage of repairs not completed before the next fraction. The higher doses will produce steeper survival curves. At low doses, the survival of normal tissue cells exceeds that of cancer cells while at high doses, the survival of cancer cells exceeds that of normal cells (see Fig. 2).
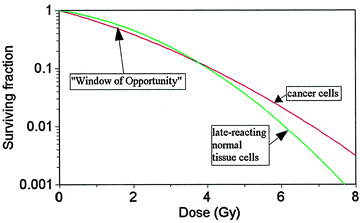

Fig. 2
Surviving fraction “window of opportunity” (Modified from Theodore T. Puck, Dimitry Morkovin, Philip I. Marcus, Steven J. Cieciura, Action of X-rays on Mammalian Cells II: Survival Curves of Cells from Normal Human Tissues. J Exp Med. 1957 September 30; 106(4): 485–500)
Therefore there is a “window of opportunity” at lower doses where the dose more consistently delivers unrecoverable lethal damage to cancer cells and recoverable nonlethal injury to healthy cells. It is precisely within this window that radiation therapy functions best.
The Strandquist Plot
In 1944, Strandquist was the first to present the importance of fractionation based on acquired data and observation of the effects of tumor and normal surrounding skin over dosage and time. The observations were based on a 250 kV X-ray machine which was used to deliver 2.0 Gy/day 3–5 times a week to 280 carcinomas of the skin and lip. The plot was based upon overall time in relation to a single total dose and represents the iso-effective total dose, D, against the log of overall treatment time, T.


The fractions were 3–5 a week, so overall time in the plot would imply the number of fractions needed. The plot demonstrated that the iso-effect curve for skin was about 0.33 [3]. In the plot below (Fig. 3), the y axis is total dose in rad (R) and the x axis is time in days. The “B” curve represents dose at which cure was achieved, while overdose would occur if the dose lay above the “B” curve and skin necrosis (A curve) would occur. Similarly, should the dose lie below the “B” curve, cure may not be achieved although other milder skin reactions would be seen at subsequently lower doses such as moist desquamation (C), dry desquamation (D), and erythema (E). Strandquist’s results indicated that 2,000 rad in 1 day was equivalent to 3,000 rad in 4 days, 4,000 rad in 11 days, 5,000 rad in 25 days, and 6,000 rad in 45 days. The take-home point from Strandquist’s efforts was that total dose is most meaningful when the overall treatment time is known.
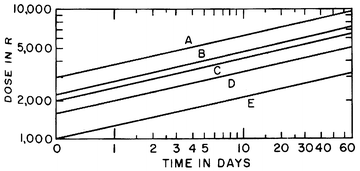

Fig. 3
Strandquist plot. A skin necrosis; B cure of skin carcinoma; C moist desquamation; D dry desquamation; E erythema (used with permission from Eric J. Hall and Amato J. Giaccia, Radiobiology for the Radiologist, Lippincott Williams & Wilkins, Philadelphia, PA, 6th ed., 2006)
The Nominal Standard Dose
This led Ellis and colleagues in 1967 to develop the nominal standard dose (NSD) system which takes into account both time and number of fractions.
 where T is the overall time in days and N is the number of fractions. Herein, Ellis proposed fractionation is twice as important as time according to clinical observations. The formula projected that the tolerance dose for normal tissue (D cGy) could be related to the overall treatment time (T days) and the number of fractions (N). The formula became known as the Ellis NSD equation and was based on the iso-effect curve for skin, the slope of which is again 0.33 [3].
The disadvantage of the Ellis equation was it produced a number which described a complete course of fractionated radiotherapy which results in full connective tissue tolerance. If the values of D, T, and N, were substituted with numbers of less than full tolerance, then the NSD number would be meaningless.
The Time Dose Fractionation Factor
In 1973, Orton and Ellis developed the concept of time dose factor (TDF) which takes into account time, fractions, and interval between fractions. The NSD concept in radiotherapy has thus become simplified by the introduction of time, dose, and fractionation factors, which are proportional to partial tolerance, but not dependent upon any specific NSD value. Partial tolerance is related to NSD by a factor which is a function of overall time, the dose per fraction, and the fraction pattern. This factor is called the time, dose, and fractionation (TDF) factor. The TDF is related to the NSD as follows:


The TDF numbers were evaluated for treatment schedules of 1, 2, 3, 4, and 5 fractions per week and corresponding tables containing TDF factors for various treatment regimens were presented. Orton and Ellis consolidated these numbers into corresponding tables based on the number of fractions per week. By using the TDF tables in treatment planning, it is possible to predict treatment outcome for cure, skin necrosis, and other effects. The cure for epithelial skin cancers requires a TDF number between 90 and 110 and thus the therapeutic index lies between these two numbers [4]. The TDF tables presented by Orton and Ellis afford a pre-calculated standardized optimal range for effective delivery of desired dose. Following the TDF tables, allows an increased number of fractions with improved cosmesis while not compromising efficacy. The importance and utility of these tables in planning curative treatment regimens that are precise and predictable cannot be overstated.
The following tables have a horizontal green row that gives total fractions and a vertical red row assigning dose per fraction in cGy. The cells between the two rows give a TDF number. The tables state how many fractions per week along the top. When a desired fractionation scheme is selected, it is important that the joining of the horizontal fractionation and the vertical dose per fraction converge to a number within the therapeutic index (highlighted in gold with green number). Please see Tables 1, 2, 3, 4, and 5 below.
Table 1
Time dose fractionation (TDF) for one treatment per week
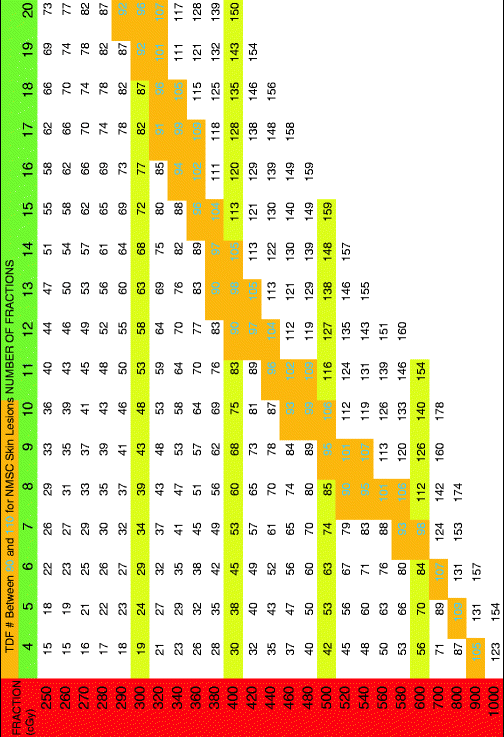 |
Table 2
TDF for two treatments per week
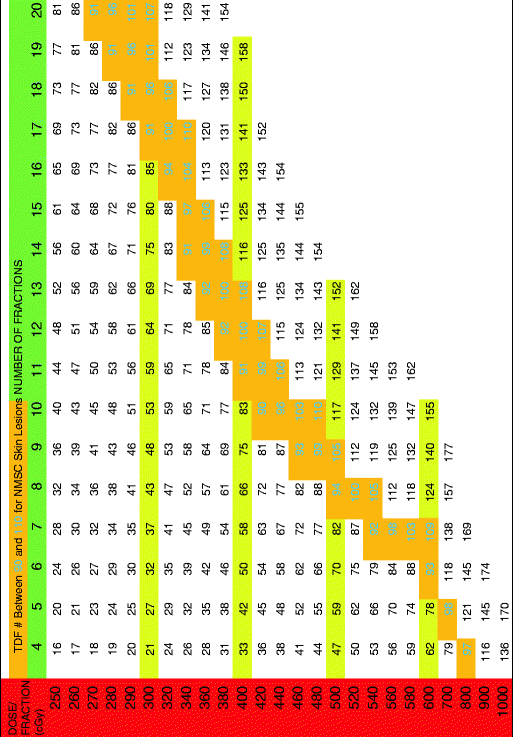 |
Table 3
TDF for three treatments per week
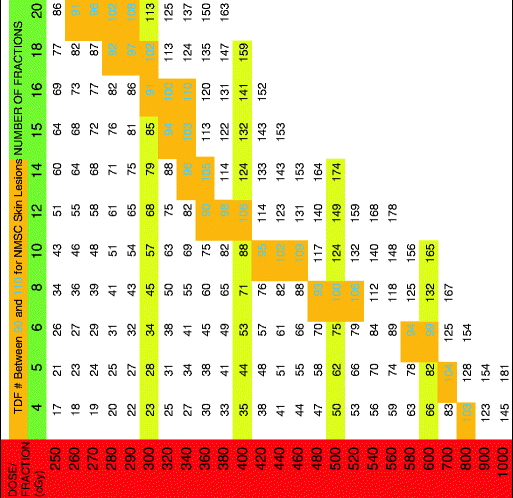 |
Table 4
TDF for four treatments per week
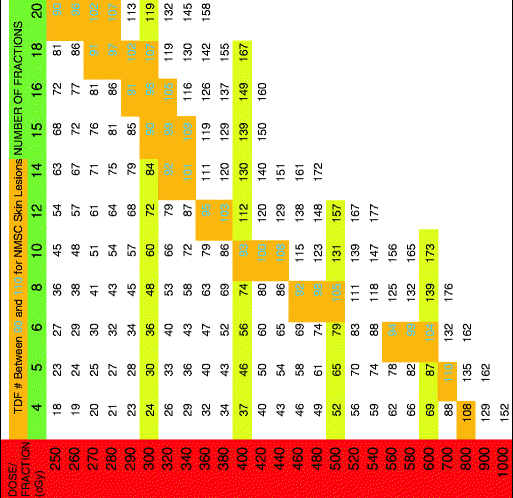 |
Table 5
TDF for five treatments per week
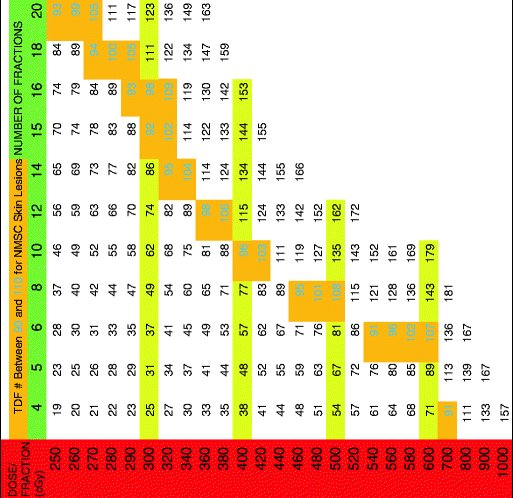 |
TDF Decay Table
Courses of treatments in the elderly are sometimes interrupted by illness, inclement weather, or other unforeseen events. A decay table with “decay factors” is provided. The table is based upon radiobiological responses to cancer cells, a disruption in the course could possibly decay whatever portion of the TDF factor that had to that point, been delivered. In order to use a decay table, one needs to know the total days under treatment and the total days of rest. Table 6 is based upon total days under treatment until the interruption and the total day of rest before the treatment resumes.
Table 6
Table for calculating decay factor to account for intra-treatment delays
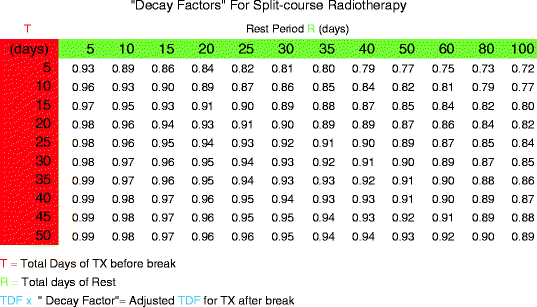 |
Clinical Treatment Planning
Tumor Depth
Once the decision has been made to proceed with superficial X-ray therapy, several logistical issues need to be addressed prior to the beginning of therapy. The first consideration is the penetration depth of the beam needed to adequately treat the skin cancer. Slide review is essential as a means of appreciating the histologic characteristics and depth of the tumor. A simple micrometer can be used in conjunction with most standard microscopes. Our standard microscopes have a built-in program that can measure depth and assist in estimating tumor volume. Once the depth of the tumor has been determined, the penetrating quality of the beam can be selected to adequately treat the deepest portions of the tumor.
Beam Quality
The heterogeneous beam produced by superficial dermatologic X-ray units consists of X-rays of varying wavelengths. The distribution and proportion of short wavelengths (hard X-rays) vs. longer wavelengths (soft X-rays) determine the penetrating effect, or quality, of the radiation. The penetration of superficial quality X-rays is determined by three variables: the voltage (kV), the filtration, and the target skin distance (TSD). The combined effect of these variables has been traditionally expressed as the “half-value layer” (HVL). The HVL is the thickness of a given material (typically aluminum) that reduces the intensity of the photon beam to 50 % of the original exposure. The greater the HVL, the more penetrating the resulting beam. The HVL values in dermatologic therapy range from 0.01 mm Al (Grenz-ray range) to 2.0 mm Al. The range in which most dermatologic X-ray machines operate within is 10–100 kV which relates to an HVL range of 0.02–2.0 mm Al. As the kilovoltage increases, the potential difference between the cathode and the anode increases, resulting in a higher speed and energy of the electrons aimed at the tungsten target. This increase in kilovoltage results in a higher intensity photon beam with greater penetrating power.
Beam quality is also affected by the degree of filtration. An aluminum filter is typically employed to filter out the lower intensity portions of the heterogeneous beam, resulting in an emerging beam of less intensity but of greater average penetration. The choice of filtration is limited by most X-ray machine manufacturers to only four to five different choices of aluminum thicknesses (e.g., 0.1, 0.25, 0.5, and 1 mm). This limitation is desirable as it can avoid confusion and error as only a limited number of combinations of filter and kilovoltage are needed in daily dermatologic practice and all machines need to be calibrated at each and every combinational permutation of kilovoltage, TSD, and filtration.
Half-Value Depth (D ½)
The half-value depth (D ½) is a concept that has served as an invaluable guideline in dermatologic radiation therapy. In lieu of confusing arithmetic computations based on depth dose charts with varying combinations of radiation factors, the modern dermatologic radiotherapist takes advantage of calibrations based on the D ½. The D ½ is the tissue depth expressed in mm at which the absorbed dose is 50 % of the surface dose. In treating non-melanoma skin cancers, the goal is to deliver at least 50 % of the surface dose to the lesion’s base (deepest portion of tumor). The D ½ concept helps ensure adequate dosage to the tumor and decreases the possibility of radiation damage to deeper underlying structures (see Fig. 4).
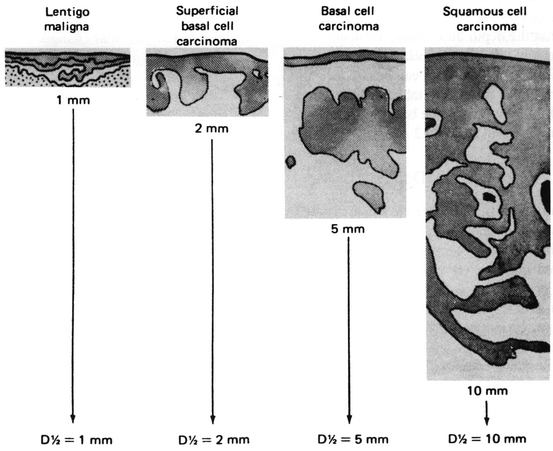

Fig. 4
Selection of D ½ for skin cancers (From H. Goldschmidt and R.G. Panizzon, Modern Dermatologic Radiation Therapy, 1991, Springer-Verlag: NY; p. 60. With kind permission of Springer Science + Business Media)
In our experience and with the calibration settings of our particular X-ray machine (the Sensus SRT-100™), most nodular and superficial basal cell carcinomas (BCCs) can be adequately treated with a 50 kV intensity of the beam. The D ½ at 50 kV penetrates to a depth of 5.8 mm which is adequate for most nonaggressive BCCs. This same beam intensity setting is also suitable for squamous cell carcinoma in-situ (SCCIS) of the face and scalp. Occasionally, on the scalp, when there is prominent adnexal extension and there is question of superficial invasion, 70 kV may be appropriate as the D ½ is 13.9 mm. For any invasive SCC, albeit superficially invasive or more deeply invasive, we choose to select a kilovoltage of at least 70 kV with a minimum D ½ of 13.9 mm. Physicians must pay careful attention to the individual beam intensity and quality of their particular machine and select treatment parameters and D ½ values based on individual machine characteristics. Selecting the appropriate kilovoltage is crucial because although the total dose and fractionation scheme may be tailor made for the particular patient and the TDF value may be in the ideal range, if the beam undershoots the tumor depth, the overall treatment scheme is flawed from the start.
Umbra Selection
In a similar fashion, once the beam depth has been selected, the beam width must be considered. The umbra of the treatment field is directly proportional to the clinical margins of the lesion. Careful clinical inspection by an experienced clinician with proper illumination is the gold standard of margin delineation. If there is any question as to the borders or if it is ill-defined, scouting biopsies may be warranted. Once the clinical lesion border has been identified, it should be delineated and recorded in some fashion. Various marking techniques are available of varying degrees of permanence and visibility. One commonly employed method is to delineate the clinical lesion with a gentian violet marker or Castellani paint. A treatment margin is then selected beyond the clinically evident tumor. Five to seven millimeter margins are common and minimum recommended margins. Ill-defined and more aggressive tumors may warrant a wider margin. Lead shields are typically utilized to limit the beam to a desired treatment area. Occasionally, in some situations where a lead shield is not employed, the cone itself may serve as the desired treatment diameter.
Because there is an inherent drop-off in the beam along the edges, it is our preference to use a shield diameter smaller than the cone size to minimize the lateral edge drop-off effect. If more than one tumor is being treated concomitantly or the treatment site is to be near a previous radiation treatment site, care must be taken to prevent overlap of the treatment fields.
Dose and Fractionation Schemes
Once the kilovoltage value and umbra have been selected to match the depth and characteristics of the tumor, the dosage and fractionation scheme can be selected. The patient’s age, overall health, comorbidities, travel distance, and cosmetic expectations are additional variables in determining the number of fractions to divide the dosages into. If the patient is very old, feeble, travels a long distance, and is not interested very much in cosmesis, then fewer fractions would be recommended. Similarly, if the patient is very interested in minimizing the potential for a hypopigmented patch within the treatment site and is able and willing to make more treatment sessions, then hyperfractionation may be best. Once the number of fractions is determined, the interval between fractions needs to be decided (i.e., 1, 2, 3, 4, or 5 fractions per week, etc.). In addition to patient demographics (i.e., age and distance to travel) and cosmetic considerations, tumor location can also be an important factor for determining the fractionation scheme.
Stay updated, free articles. Join our Telegram channel

Full access? Get Clinical Tree


