Fig. 6.1
Cell survival curves representing early-reacting/high α/β (e.g. tumour, mucosa) and late-reacting/low α/β (e.g. brain, lung, breast) tissues have a different shape. At low doses (A) there is relatively more tumour cell kill, i.e. lower tumour cell survival as compared to normal cell kill. At higher doses (B), the relation is reversed and comparatively more late radiation damage is induced

(6.1)
The α/β ratio is a measure of the relative contributions of these two components to the overall cell killing.
The characteristic SF shape includes a low-dose shoulder region followed by a steeply sloped or more continuously bending portion at higher doses. A frequently used interpretation of the shoulder region is the accumulation of sub-lethal damage at low doses and lethality resulting from the interaction of two or more such sub-lethal lesions.
6.3 Early and Late Effects
Cell toxicity, in terms of side-effects, differs depending on the radiotherapy treatment (radical, palliative or adjuvant) and on the dose and fractionation used. Usually side-effects are classified as early and late, with the latter sometimes being chronic.
Early effects occur during the first days following the start of a radiotherapy treatment and inflammation is their dominant characteristic due to the radiation-induced damage to the healthy tissues. Late effects appear months or even years after the end of radiotherapy, resulting in hardening and loss of tissue elasticity such as fibrosis, atrophy, ulceration, stenosis and necrosis.
Since normal tissue reactions after irradiation depend on radiation effects in a relevant cell population, radiation effects in these tissues are frequently described by the linear quadratic model. Survival curves for early-reacting normal tissues and tumours are less curved than those for late-reacting normal tissues (Fig. 6.1). Early-reacting normal tissues and tumours often have a lower sensitivity to dose per fraction and a higher α/β ratio than late-responding normal tissues. The biological effects observed increase faster with increasing dose per fraction in late-responding tissues than in early-reacting tissues and tumour, whereas small doses per fraction are associated with a lower risk of complications and a better therapeutic ratio. This difference in fractionation sensitivity between early- and late-reacting tissues is interpreted as reflecting differences in DNA damage repair capacity and constitutes the basis for the differential effect of fractionation or low dose rate.
6.4 Biologically Effective Dose
The linear quadratic model provides a simple way to describe the dose response of different fractionation schemes in terms of biologically effective dose (BED). The BED is regarded as a measure of the true biological dose delivered using a particular combination of dose per fraction d (Gy) and total dose D (Gy) to a given tissue characterised by a specific α/β ratio. It can be written as:


(6.2)
BED represents the dose that is calculated to be required to reach a certain level of effect when a total dose D is given in very small fractions with full recovery between fractions. The BED value increases with increasing dose per fraction and its increment is greater for tissues with a low α/β ratio than for tissues characterised by a high α/β value. The classic BED equation cannot be applied to describe different fractionation schemes obtained using different radiation qualities because the value of α is not the same (Dale and Jones 1999; Herskind et al. 2005).
6.5 Linear Energy Transfer Effect and Relative Biologic Effectiveness
The radiation quality is characterized by the ionisation density in the track given as the Linear Energy Transfer (LET). The differences in tumour cell survival values reported in Fig. 6.2 for the same absorbed dose delivered by different types of radiation suggests different biological effectiveness for each type of radiation.
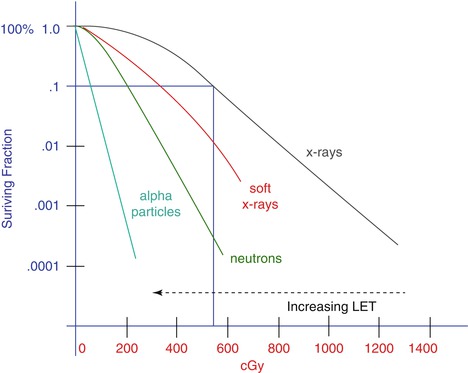

Fig. 6.2
Beams of different radiation quality may have different biological effects at the same physical dose. The same dose kills more cells when delivered as higher LET radiation
The reason behind the different effectiveness of differing types of radiation is to be found at the microscopic level, where the energy is deposited in different patterns for each type.
Figure 6.3 shows the major differences between low LET and high LET radiation. The interactions that occur in a biological system with low LET radiation are relatively far apart from each other; therefore they will be spread throughout the cell, delivering a more uniform distribution of ionisations. In contrast, high LET radiation shows well-defined dense tracks of ionisation that cause more extensive damage along the track.
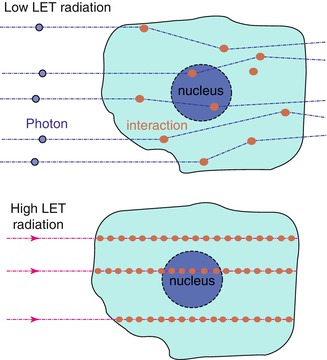

Fig. 6.3
Low and high LET radiation effect on a biological system. The dose required to kill a cell using high LET radiation is smaller than that needed when using low LET radiation
These differences in energy distribution form the basis of the concept of relative biologic effectiveness (RBE). The RBE is defined as the ratio of the absorbed dose of a reference radiation to the absorbed dose of a test radiation to produce the same level of biological effect, other conditions being equal (ICRP 2003; ICRU 1998).


RBE is strongly affected by different factors:
RBE increases with decreasing dose per fraction.
RBE values depend on tissue type.
RBE depends on particle LET: increasing clustering of radiation is known to produce higher lethality.
When a new type of radiation modality is introduced in therapy, it is necessary to determine its RBE relative to the radiation beams already in use and for which the radiation-oncologist has accumulated clinical experience. The aim of the RBE calculations is to help the radiation oncologist to prescribe the right dose with the new type of radiation. Two different formalisms have been developed to calculate the RBE from the LQ model under certain assumptions (Brenner et al. 1999; Dale and Jones 1999). The former formalism including the effect of protracted irradiation has been applied to tumour-bed IORT with Intrabeam (Herskind et al. 2005) as outlined in the appendix (see Sect. 6.10). These calculations are performed using different biological systems and different experimental conditions (Herskind et al. 2005; 2008; Herskind and Wenz 2010).
6.6 Biological Effectiveness of the INTRABEAM System
IORT using low-energy X-rays differs in some specific aspects from IORT using electrons from linear accelerators or dedicated IORT machines. The 50-kV X-rays of the INTRABEAM system have an increased RBE and a steeper dose fall-off. Furthermore, the dose is delivered with a low dose rate over a prolonged time.
Soft X-rays (kV) have an increased RBE compared to standard linear accelerator X-rays (MV). Irradiation types which produce more locally concentrated ionisations, although at the same total amount of ionisations, are more effectively killing tumour cells and thus have an increased RBE. This is especially true for high LET irradiations like neutrons or heavy ions. Although soft X-rays have a somewhat higher LET than high-energy X-rays from linear accelerators, they are not considered to be high LET irradiation. The increased RBE of soft X-rays is most likely a consequence of the fact that the total energy of the beam is deposited within a relatively short distance of the track ends, which means that the ionisation events are locally more concentrated within this area. The absolute value of the RBE of 50 kV X-rays depends on the dose, endpoint, tissue and many other factors. For clinical practice with spherical tumour-bed applicators one may assume a range of 1.2–1.5 based on experimental data for different cell types although the RBE may vary with the distance from the source (Liu et al. 2013).
Stay updated, free articles. Join our Telegram channel

Full access? Get Clinical Tree


