Fig. 9.1
(a) Contrast-enhanced ultrasound image obtained 1 month after percutaneous RFA shows complete non-enhancement of the ablation zone. The ablation zone is irregular because of the location in the subcapsular area and adjacent to the blood vessels. (b) Contrast-enhanced ultrasound image obtained 42 months after ablation shows that the ablation zone has reduced in size
9.3.1.1 US and ceUS
Transient hyperechoic zones momentarily appear within and around a tumor on the baseline US both during and immediately after RFA due to gas bubble formation from water vaporization and necrosis of the tumor and liver tissue. The transient hyperechoic zone can persist for 30–90 min and can be used to roughly estimate the ablation zone during RFA. When the gas dissipates, the echogenicity of the ablation zone is heterogeneous, containing iso-echoic and hyperechoic regions. ceUS can be used after the disappearance of the transient hyperechoic zones to detect residual tumor if an incomplete ablation is suspected. One month after ablation, completely ablated, necrotic tumors appear as well-defined regions with heterogeneous echogenicity and no posterior acoustic enhancement. The ablation zone gradually becomes iso-echoic with time. The ablation zone must be larger than the original tumor, and the former will gradually shrink rather than expand. Sometimes, a hyperechoic needle tract is visible in the middle of or in front of the ablation zone. No internal flow can be visualized in the ablation zone upon Doppler US imaging. The ablation zone will show normal uptake and wash out of contrast agent signal throughout the three phases of CEUS, which are the arterial enhancement phase, portal venous enhancement phase, and interstitial enhancement or delayed phase. Contrast agents increase the accuracy of US, and the ablation zone should be measured using ceUS rather than the baseline ultrasound.
9.3.1.2 ceCT
CT without contrast agents, performed immediately after RFA, reveals a primarily low-density ablation zone. High-density regions representing intratumor bleeding or tissue dehydration can be seen in a few ablation zones. Additionally, small amounts of gas generated by tissue necrosis or boiling during RFA can be observed by CT. These air bubbles are usually round, tubular, or oval shaped and should not be mistaken for infection or a hepatic abscess caused by RFA. With time, the ablation zone evolves into a more homogeneous region of low density upon CT without contrast agents. Occasionally, the differences in tissue properties between the tumor and adjacent liver parenchyma create a target appearance of an ablation zone. A target appearance of an ablation zone is low density upon CT within the ablated tumor (presumably with prominent fatty metamorphosis) and is surrounded by a relatively high-density region of ablated liver parenchyma. The low density of ablated tumors may be due to fatty metamorphosis of HCC, and the high density of the ablated liver parenchyma helps to visualize the ablation margin. The electrode needle tract is often visible along the path of the RF electrode shaft in the ablation zone. It appears as a high-density charring shadow, which disappears over time. The ablation zone does not enhance during any phase of ceCT due to perfusion deficiencies. No expansion of unenhanced area is observed during the portal and delay phase [9].
9.3.1.3 ceMRI
One month after RFA, ablation zones display heterogeneous high-intensity signal upon T1-weighted MRI and either a homogeneous or heterogeneous low-intensity signal upon T2-weighted MRI without contrast enhancement. As time passes, the signal intensity of the ablation zone will gradually become higher on T1-weighted images and more homogeneously low upon T2-weighted imaging. The target appearance can also occur with MR imaging [10].
9.3.2 Transient Hyperemia Surrounding the Ablation Zone
Transient periablational hyperemia appears immediately after RFA in most cases. Liver tissue surrounding the necrotic ablation zone develops hyperemia and edema because of the thermal damage. Pathology has further revealed inflammation in blood vessels and the formation of granulation tissue. Transient periablational hyperemia usually disappears by 1 month post-ablation but can exist for up to 6 months. Transient periablational hyperemia is hypo-echoic upon US, is low-density upon CT, and has a rim of slightly increased signal intensity upon T2-weighted MRI (Fig. 9.2). However, the hyperemia is usually subtle or nonexistent upon unenhanced imaging for most cases. After administration of contrast agents, transient hyperemia is clearly visualized as a thin (usually <5 mm) and uniform rim surrounding the ablation zone. It is hyperenhanced during the arterial phase and iso-enhanced during the portal and delay phases. This hyperemic rim should not be considered a residual tumor or tumor recurrence (Fig. 9.3).
Fig. 9.2
(a) Contrast-enhanced CT image obtained before RFA shows an HCC lesion in the S4. (b) Contrast-enhanced CT image obtained 1 month after ablation showed that the tumor is completely covered by the ablation zone. The RFA zone is round and surrounded by a thin and uniform contrast-enhanced rim, which represents transient periablational hyperemia. Arterioportal shunting adjacent to the ablation zone is also depicted
Fig. 9.3
(a) The arterial phase of a follow-up contrast-enhanced ultrasound image in a 47-year-old male showed a thin and uniform contrast-enhanced rim surrounding the ablation zone and a nodular hyperenhancement on the posterior area of the ablation zone. These represent a transient periablational hyperemia and residual tumor, respectively. (b) Contrast-enhanced ultrasound image in the portal phase showed no wash out in the transient periablational hyperemia, but wash out in the residual tumor. Contrast-enhanced CT in the arterial phase (c) demonstrated the same nodular hyperenhancement and wash out in the portal phase (d)
9.3.3 Arterioportal Shunting
Arterioportal shunting is a common finding upon contrast-enhanced radiological imaging. It is due to mechanical or thermal injury of small hepatic vessels and results in abnormal perfusion to liver tissue that is adjacent to the ablation zone. Arterioportal shunting is visualized as a hyperenhanced wedge shape during the arterial phase that is iso-enhanced during the portal and delayed phases. It is usually not observed upon imaging (US, CT, or MRI) without contrast enhancement. Arterioportal shunting will gradually resolve spontaneously [11].
9.4 Residual Tumors and Tumor Recurrence
9.4.1 Residual Tumors
Residual tumors occur when the ablation zone does not fully cover the HCC lesion. Residual tumors are always difficult to observe during baseline US or unenhanced CT, and they can occur as nodular lesions adjacent to the ablation zone. T2-weighted MRI can distinguish residual tumors. Residual tumors appear as nodular-like regions of high signal intensity residing next to the ablation margin or create irregular peripheral rims of high signal intensity that readily contrast against the low signal intensity background of the ablation zone. Upon contrast-enhanced radiological imaging, residual tumors appear as nodular or irregular hyperenhancements on the periphery of the ablation zone during the arterial phase that wash out during the portal or delay phase [12, 13].
18F-FDG PET/CT can play an important role in the assessment of the presence of residual tumors after RFA [5, 14]. The ablation zone appears cold upon PET imaging, while residual tumors appear as hot foci, indicating increased FDG uptake, adjacent to the ablation zone. Post-RFA inflammation around the ablation zone may also cause the increased FDG uptake. It appears as a low-grade homogeneous distribution of FDG signal surrounding the ablation zone. Residual tumors can be easily masked by this feature. FDG uptake associated with the post-RFA inflammation can appear as early as 2 or 3 days after RFA; hence, 18F-FDG PET/CT examinations should be performed within 1–2 days after the ablation to detect residual tumor tissue.
9.4.2 Local Tumor Progress
LTP usually progresses beyond the ablation zone but initiates within it. Sometimes, LTP may occur through the entire ablation zone. When LTP is present, hypo-echoic nodular lesions will appear at the margin of the hyperechoic ablation zone upon baseline US. LTP has low density on unenhanced CT, low homogeneous signal intensity upon T1-weighted MRI, and slightly increased signal intensity upon T2-weighted MRI. After injection of contrast agents, LTP imaging findings are similar to those of small HCC lesions. If the tumor lacks adequate perfusion, LTP may manifest as an enlarged ablation zone or an uneven edge of the ablation zone, with irregular and less distinct margins. Intrahepatic recurrences and distant recurrences appear similar to HCC. 18F-FDG PET/CT imaging can also be used as an important method to detect tumor recurrences early. Tumor recurrences appear as foci of increased FDG uptake within or outside the ablation zone (Fig. 9.4) [14].
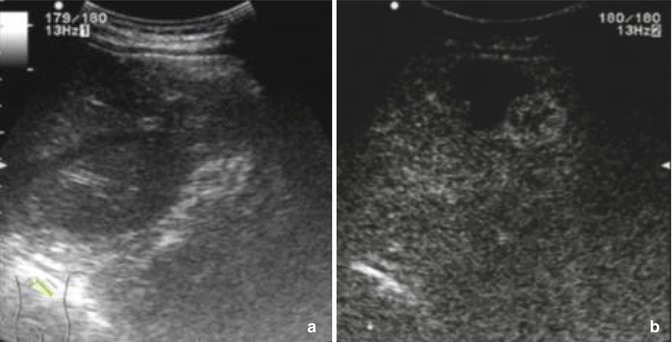
Fig. 9.4
Baseline ultrasound image (a) of a 58-year-old male 6 months after ablation does not detect the nodular hyperenhancement during the arterial phase of contrast-enhanced ultrasound (b)
9.4.3 Residual Tumors and LTP
Residual tumors and LTP can be distinguished by transient hyperemia after ablation. The key features that differentiate them are whether the rim enhancement in the arterial phase is regular and uniform and whether the enhancement washes out in the portal or delayed phases. Additionally, detailed comparisons between preoperative and postoperative images and attentive follow-up care are essential to correctly distinguish each.
9.5 Complications
9.5.1 Vascular Complications
The most common vascular complication is bleeding. Bleeding appears as ascites, the number of which correlate with the quantity blood that enters the peritoneal cavity. A small amount of bleeding can gradually resolve spontaneously. Acute bleeding appears anechoic upon baseline US and as a low-density area upon unenhanced CT. A hepatic hematoma appears as a high-density feature in the acute phase, but the signal intensity of the blood changes over time. ceUS can reveal bleeding by the leakage of US contrast agent into the peritoneal cavity [15].
A hepatic arterial pseudoaneurysm is another vascular complication. It is rare and thought to be caused by mechanical or thermal injury. This pseudoaneurysm appears as a round or oval anechoic area inside the ablation zone and possesses an arterial blood flow signal upon Doppler US. Upon unenhanced CT, pseudoaneurysms appear as fluid areas with high density. A hyperenhancement resembling the hepatic artery will appear during the arterial phase upon ceUS, ceCT, or ceMRI.
9.5.2 Bile Duct Complications
The main bile duct complications are bile duct dilatation and biloma. Bile duct dilatation often occurs in the bile duct surrounding the ablation zone or the distal bile duct adjacent to the ablation zone. It often resolves over time.
Related posts:
 Pathobiologic Characteristics of Small Hepatocellular Carcinoma
 Diagnosis of Small Hepatocellular Carcinoma
 Laparoscopic and Open RFA
 Surgery vs. Radiofrequency Ablation for Small Hepatocellular Carcinoma
 Percutaneous Radiofrequency Thermal Ablation
 Radiofrequency Ablation Systems and Operating Mechanisms
Stay updated, free articles. Join our Telegram channel

Full access? Get Clinical Tree


