precision at 85.8 % accuracy. Our novel method proposes new image features that outperform previous features and utilizes techniques to improve robustness to MR imaging variations.
Keywords
SpineRadiological measurementMRIGradingDiscsRegression1 Introduction
Our primary goal in this paper is to automate radiological measurements in multi-slice clinical Magnetic Resonance Imaging (MRI) spinal scans, and to this end we describe a system to extract the standard clinical Pfirrmann disc grading that is used in the diagnosis and management of back pain patients, exploring accuracy and robustness in the process. The task is defined in Fig. 1.
Our secondary goal is to investigate the need for a complete segmentation of the disc in order to accomplish this task. On the one hand, voxel wise segmentation can help better define the grading task. On the other hand, anatomical units (discs and vertebrae in this case) may be inseparable due to pathological changes, rendering the task ill-defined. Also, in practice, segmentation is often prone to failure so avoiding it can possibly improve the overall results. Thus, we ask the question: to segment or not to segment?
We answer the question by formulating the task as one of regressing between an image support region and the Pfirrmann disc grading, and then investigate a spectrum of ways of obtaining the support region which cover: no segmentation, segmentation of only the vertebrae, and finally segmentation of the disc.


Fig. 1
The task. Given a clinical MRI volume of the lumbar spine (a) as input, fully automatically localize, label, and radiologically measure (b) the six lumbar discs in that volume, according to a standard radiological grading system (c) [15]. The radiological measurement is the ‘degeneration grade’ describing drying out of the disc (darkening in T2 MRI), and disc space collapse, in terms of four radiological features as defined in the main text. Note that in evaluation, the grade is considered correct if predicted to  accuracy, due to the ground truth intra-observer variability. a Input. b Output. c Radiological grading atlas
 accuracy, due to the ground truth intra-observer variability. a Input. b Output. c Radiological grading atlas
The method is evaluated over a large heterogeneous clinical dataset, and this adds to the challenge of the task since T2 images of the same anatomy and pathology look different in different MRI machines and under different protocols (different “tissue contrasts”). We introduce a normalization scheme to address this problem. The task is also challenging because MR imaging artifacts can be confused with pathology.
Background. The normal intervertebral disc is composed of a soft liquid central part, the nucleus pulposus (NP), and a hard ligamentous surrounding, the annulus fibrosus. It is interfaced to the vertebral bodies above and below by cartilaginous endplates. The disc acts as both a cushion and a pivot point in the spine. Disc problems are a common cause of back pain.
One common disc problem is Degeneration, the drying out and collapse of the disc space, and this abnormality is clinically measured using the standard radiological Pfirrmann grade [15], illustrated in Fig. 1. Pfirrmann defines the categorical five-score grade in terms of sequential changes to four MRI features: brightness of the NP, uniformity of the NP, distinction between the NP and the annulus fibrosus, and the disc height.
Since our ground-truth labelling is not perfect—the intra-observer grade agreement in our database is only 71 % based on grading 121 patients twice, while agreement to  is 98 %—we assess our scores to within
  grade accuracy. Note, Pfirrmann [15] measured 88–92 % intra-observer agreement over measurements in a single day. Our database was annotated by one radiologist over several years—achieving similar variability to inter-observer variability witnessed by Pfirrmann.
 is 98 %—we assess our scores to within
  grade accuracy. Note, Pfirrmann [15] measured 88–92 % intra-observer agreement over measurements in a single day. Our database was annotated by one radiologist over several years—achieving similar variability to inter-observer variability witnessed by Pfirrmann.
While the Pffirrmann grade is widely used in clinical practice to assess the overall disc quality, conflicting accounts have been presented in research studies regarding the correlation between the grade, back pain, and surgical outcomes [5, 9, 12].
Given the quite high intra- and inter-observer variability of radiological measurements, one advantage of automating measurement is that it should lead to an improvement in consistency. In turn, this consistency may lead to improvements in both clinical research studies on the correlation of back pain with radiological measurements, and communication between radiologists.
1.1 Related Work
Recently, multiple medical imaging papers have been published attempting to automatically diagnose a number of spinal conditions [1, 7, 14, 16, 19].
The existing publications on Disc Degeneration deal with the binary classification task—e.g. the presence or absence of desiccation/degeneration [1, 7, 14, 19]—rather than measuring the standard radiological Pfirrmann grade or a similar radiological quantity. In addition, they are generally restricted to homogeneous data collected from the same scanner, using the same [1, 19], or a relatively narrow range [14] of protocols.
Image features for Pfirrmann grading have been proposed before [13], however their computation is not fully automatic and they have not been used to automatically measure the grade. Alomari et al. [1] and Neubert et al. [14] automatically predicted a binary grading to high accuracy in MRI scans over a homogeneous dataset; and we compare to their features here. Often, the methods require a segmentation step [14] to accurately delineate the discs, or to find an exact square in the disc [1]. The robustness of the methods to segmentation has not been explicitly studied, however it is an important point.
A number of vertebra and disc segmentation algorithms have been proposed [6, 8, 10, 18]. Vertebra segmentation methods have been more successful than disc segmentation ones. This is largely because vertebrae in MRI have well-defined edges and consistent appearances across patients. In contrast, discs have variable appearance, lack clear boundaries, and vary considerably due to degradation (the very process we are assessing).
1.2 Contributions and Paper Layout
Contributions. We fully automatically measure the Pfirrmann grade to  accuracy, and are the first to present results generalizing across clinical data from a number of sites, scanner types and imaging sequences. We train and assess our results based on ground truth annotations on clinical data, by an expert radiologist with 25 years of experience. We experimentally assess the effect of varying the amount of segmentation to define the feature support region, and compare our features to those proposed in previous work on binary auto-grading [1, 14].
 accuracy, and are the first to present results generalizing across clinical data from a number of sites, scanner types and imaging sequences. We train and assess our results based on ground truth annotations on clinical data, by an expert radiologist with 25 years of experience. We experimentally assess the effect of varying the amount of segmentation to define the feature support region, and compare our features to those proposed in previous work on binary auto-grading [1, 14].
Paper layout. The method is presented in full in Sect. 2, explaining in detail the three steps of the pipeline: feature support region definition, image feature extraction, and regression. The dataset is described in Sect. 3.1, the evaluation protocol in Sect. 3.2, and the experimental results and discussion in Sect. 3.3.
2 Regression of Radiological Measures
In this section, we describe a method for predicting the Pfirrmann grading. It is formulated as a regression task, and we use standard machine learning methods to learn the regressor from expert-annotated training scans, and then apply the regressor to previously unseen clinical scans.
Although Pfirrmann grading is categorical, the underlying fundamental disc degeneration process is continuous over time, and that is why we choose to formulate it as regression rather than classification.


Fig. 2
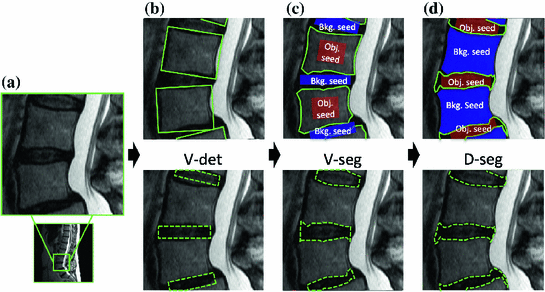
Computation of the feature support regions. The top row illustrates the detection and segmentation steps; the bottom row shows the three corresponding feature support regions for the b V-det, c V-seg, and d D-seg methods. The full segmentation pipeline consists of vertebrae detection, vertebrae segmentation, and intervertebral disc segmentation. In the top row, the green lines show the detection and segmentation outputs, and the Obj. (object) and Bkg. (background) seeds show the initializations used for the segmentations as the red and blue areas. The resulting support regions are shown as green dashed lines in the bottom row. The V-det pipeline is the shortest, involving no segmentation, and the D-seg pipeline is the longest, involving both vertebrae and disc segmentation. See Sect. 2.1 for more detail. a Input image (zoom). b VB Detections. c VB Segmentations. d IVD Segmentations (Color figure online)
The pipeline from a raw multi-slice MRI scan to radiological measurement of disc degeneration has three steps, described in more detail in the following sections: first, finding the support region; second, extracting image features; third, predicting the Pfirrmann grade. In Sect. 2.1, we explore three alternative methods of obtaining the feature support region, named V-det (vertebra detection), V-seg (vertebra segmentation), and D-seg (disc segmentation), illustrated in Fig. 2. This explores three points on the ‘no segmentation’ to ‘full disc segmentation’ spectrum.
2.1 Step 1: Three Alternative Support Regions
Taking a clinical MRI scan as input, this step outputs the feature support region for the six lumbar discs (annotated in Fig. 1) in three different ways, as contrasted in Fig. 2. In V-det, the region is defined as a rectangle between vertebrae bounding boxes. In V-seg, the region is defined as a rectangle based on vertebrae segmentations and excluding any vertebrae voxels. In D-seg, the region is defined as the disc segmentation result, the disc mask. The full algorithm from image to vertebrae and disc segmentation is sequential: (1) vertebrae detection, (2) vertebrae segmentation, (3) disc segmentation, with each step automatically initializing the next. Both the vertebrae and the discs are segmented using the standard graph cuts algorithm of Boykov-Jolly [3] with region and boundary terms. As might be expected, each step in the process has some degree of failure rate. So the more steps we employ, the greater the potential for failure.
Stay updated, free articles. Join our Telegram channel

Full access? Get Clinical Tree


