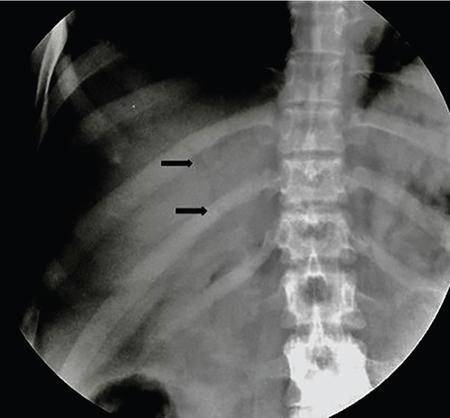
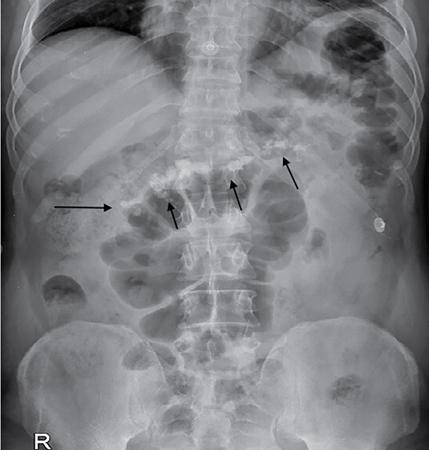
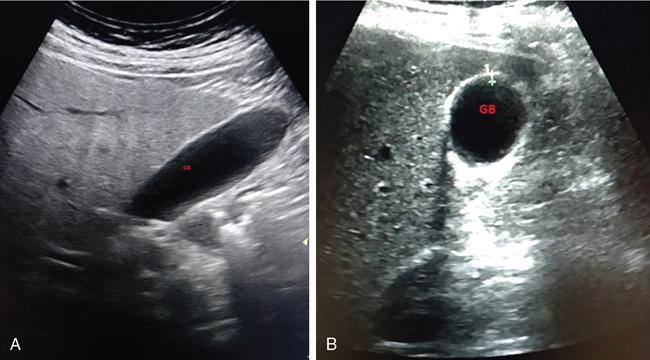
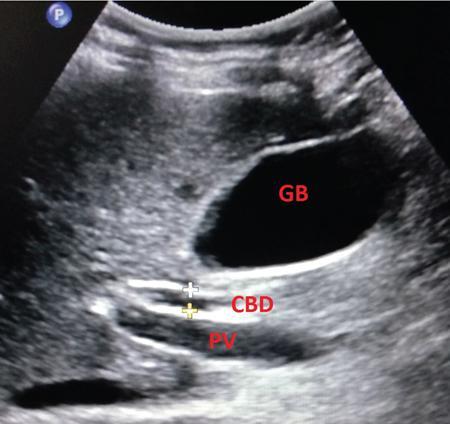
Samarjit Ghuman, Seema Sud, Deeksha Rastogi, Swapnil Sheth, T.B.S. Buxi PLAIN RADIOGRAPHY FOR HEPATOBILIARY IMAGING The diagnostic imaging techniques for hepatobiliary imaging can be intimidating with many techniques/modalities providing the information desired. The job of the diagnostic radiologist includes being familiar with the available choices and pick the ‘best fit’ keeping in mind the pros and cons of each modality, which includes plain X rays, Contrast studies using plain X rays and fluoroscopy, Ultrasound includiojng Doppler and Ultrasound elsastography, CT including multiphase CT and MRI and MRI elastography. Understanding the strengths and weaknesses of every modality as well as the ability to tailor each study individually will help to optimise patient cares. The abdominal radiograph is performed almost exclusively in the supine position and in the AP (anteroposterior) projection. In case of acute abdomen, an erect chest radiograph should also be performed to look for free air under the diaphragm. The standard abdominal radiograph should extend from the diaphragm to the inferior pubic rami, and includes the lateral abdominal wall musculature. Routinely no preparation is required for abdomen radiograph done for hepatobiliary imaging. The radiograph has limited soft-tissue contrast, however, the liver being the largest intra-abdominal organ, casts a perceptible shadow. The margins of the liver can indirectly be seen by outline of adjacent organs like lung, hemidiaphragm, pro-peritoneal fat line, kidney and gas shadows of stomach/colon. The right lobe is seen better than the left lobe of liver. The following pathologies may be visualized on the plain radiograph of the liver. Liver enlargement Liver mass Calcification Increased radiodensity of the liver Decreased radiodensity of the liver An ultrasound is the first line investigation; however, a radiograph may be done for routine evaluation of abdominal pain. The following pathologies may be seen on plain radiograph of the biliary tree. Calculi and Calcifications Gas ULTRASOUND OF HEPATOBILIARY SYSTEM Ultrasonography (USG) is the initial imaging modality of choice for scanning hepatobiliary system. USG is accurate and has high sensitivity and specificity in diagnosing biliary pathologies. Table 9.1.1 shows indications of ultrasound in hepatobiliary system. The real-time nature of ultrasound lends itself to demonstrate mobility of calculi and sludge and the sonographic Murphy sign can easily be elicited during scanning. The main disadvantage is operator dependence, patient’s body habitus, presence of gas which can obscure the visualization of organs, overlying bandages in a postoperative patient and incomplete evaluation in a nonfasting state. USG of upper abdomen should be done after 6–8 hours of overnight fasting. Milk and fatty food should be avoided as they cause contraction of the GB and may cause the GB walls to appear thickened. History of previous surgery, especially cholecystectomy should be elicited. The patient may be positioned in supine or left lateral decubitus position. The GB can be scanned from a high/lateral view, looking through the ribs in supine position or through a sub-costal view in left lateral decubitus position. Position of patient may be changed to demonstrate mobility of structures. The GB is an anechoic structure which is located in the GB fossa along the posterior and inferior aspect of the liver. It has a fundus, body and a neck. It should always be examined in at least two planes (Fig. 9.1.6A and B). The wall of the normal GB should measure 3 mm or less and pathological GB wall thickening can be due to cholecystitis or a neoplastic aetiology. Calculi appear as mobile hyperechoic foci, with distal acoustic shadowing. Other pathologies include polyps and sludge which can be differentiated on the basis of their mobility. The CBD measures less than 6 mm in diameter with increase in the diameter with patient’s age and after cholecystectomy. The CBD is usually scanned in an oblique subcostal plane with the patient in the left decubitus position (Fig. 9.1.7). Dilatation of the intrahepatic biliary radicles is readily assessed with USG and normal intrahepatic biliary radicles are usually not appreciated on USG. Ultrasound of the liver, broadly, is done to assess the size, surface (smooth, coarse or lobulated) parenchymal echogenicity (increased or decreased) vascularity and for presence and evaluation of intrahepatic masses or fluid collections. The liver is divided into right and left lobes by plane of middle hepatic vein which passes through GB fossa and notch of IVC (Cantlie Line). Couinauds classification is the most commonly used system for liver segmental anatomy and described liver into eight functional segments. It is based on distribution of portal and hepatic veins. Every segment has its branch from portal vein, hepatic artery and bile duct (Fig. 9.1.8). Curvilinear transducer (3–5 MHz) is used for routine examination of liver and GB (Fig. 9.1.9). A high-frequency linear transducer (9–11 MHz) (Fig. 9.1.10) can be used to look for subtle irregularity of the liver surface for early Cirrhosis and fine details of GB wall. The liver is scanned in deep inspiration, which causes inferior movement of liver, so that superior borders of the liver are well visualized. Supine position is used for the size of the liver. The measurement is made in sagittal mid clavicular position on right side, in craniocaudal dimension. It is taken from diaphragm to the lower end of the liver. It should be <16 cm and varies with age and sex. The liver is divided into four vertical sectors by three hepatic veins and plane of bifurcation of portal vein divides these 4 sectors in to 8 segments. The right hepatic vein creates vertical plane in the right lobe separating segments V and VIII (anterior) from VI and VII (posterior). The portal vein bifurcation creates a transverse plane and divides these segments into superior (VII, VIII) and inferior segments (V, VI). The left hepatic vein divides the left lobe into medial (IVa, IVb) and lateral sectors (II, III). The left portal vein divides left lobe into superior (Iva, II) and inferior segments (III, IVb). The middle hepatic vein separates medial segments of left lobe (IVa, IVb) from anterior segments of right lobe (V, VIII). Ligamentum teres separates segment III from IVb. Ligamentum venosum separates segment I from IV and II. Cystic duct is an anechoic tubular structure which connects neck of the GB to the extrahepatic biliary tree. In long axis view of GB, the neck of the GB is related to main lobar fissure which appears as a linear echogenic line which runs obliquely between neck of GB and right portal vein. In the right oblique sub coastal view CBD is seen anterior and parallel to portal vein. A series of standardized sections or views may be obtained for liver scanning. Transverse Subcostal View: In this view the probe is angled cephalic and placed transversely under the ribs on the right side and portions both lobes of the liver can be seen (Fig. 9.1.11). Mid Transverse View (Fig. 9.1.12) in this transducer is kept in transverse plane in the midline below the xiphisternum. It visualises the liver in an inferior to superior transverse oblique plane and portions of both lobes of liver can be seen along with right and left portal veins. This view is obtained by angling the transducer superiorly toward the hepatic venous confluence. In this view, we can see the three hepatic veins joining the IVC. Right Parasagittal View for Both Right Lobe and Kidney: This view allows assessment of inferior right lobe of liver. It also allows assessment of relative echogenicity of liver and renal cortex as both are seen together in the same image. Normal liver parenchymal echogenicity is greater than renal cortex and less that renal medulla (Fig. 9.1.14). Parasagittal Right MidClavicular View: In this transducer is kept in sagittal plane in right midclavicular line, and oriented supero-inferiorly. This is the standard view for assessing craniocaudal span of liver (Fig. 9.1.15). Parasagittal View for the Left Lobe: For evaluation of left lobe of liver and lateral segments (2 and 3) (Fig. 9.1.16). This view is obtained along the direction of the main portal vein. CEUS of the liver is done to evaluate Focal Liver Lesions and complements traditional B mode ultrasound and Doppler study. It is a simple, accurate and cost-effective tool complimenting indeterminate CT and MRI findings or for characterization of lesions in patients who cannot receive CT/MRI contrast and can be used in patients with compromised renal function, with minuscule risk of side effects. As CEUS is real-time, microvasculature can be studied along with tissue perfusion kinetics. Indications and uses of CEUS: Contrast agents and technique: Interpretation: Contrast-enhanced ultrasound of a hepatic hemangioma in different phases (Fig. 9.1.19). Limitations of CEUS: Liver elastography is a noninvasive method for diagnosing liver fibrosis. Liver fibrosis is induced by chronic liver disease leading to cirrhosis and liver cancer. Liver biopsy is the gold standard for diagnosing the degree of fibrosis and for staging but it is an invasive method. Elastography helps in analysing the elasticity or the stiffness of the tissue. A stiffer liver tissue indicates fibrosis or chronic liver disease. ARFI is based on the principle of measuring Shear wave velocity. Short duration acoustic pulses which are generated in the tissue and these give rise to shear waves which travel, perpendicular to the ultrasound beam. These shear waves cause tissue displacement followed by recovery. This displacement and recovery depend on tissue stiffness. To monitor these shear waves US beams of low intensity are emitted continuously parallel to the main beam along with the push pulses, and these beams can gather data regarding the tissue stiffness. The shear waves cause tissue displacement and this tissue then recovers from the impulse. From this data the degree of tissue stiffness can be obtained which is displayed either as a map or quantitatively where tissue elasticity is expressed as shear wave velocity measured in meters per second. F0, normal; F1, enlarged fibrotic portal tract; F2, periportal/initial porto-portal septa with intact architecture; F3, architectural distortion with no obvious cirrhosis; F4, cirrhosis. It is also known as Transient Elastography (TE) and works on the similar principle as ARFI, the difference being that B mode ultrasound image is not produced. DOPPLER OF PORTAL VEIN The portal vein divides at the portahepatis into right and left branches. The right portal vein divides into anterior and posterior branches, and the left portal vein divides into medial and lateral branches. Portal vein shows a continuous, forward low-velocity flow (15–28 cm/s) on colour Doppler scanning. The flow is hepatopetal, that is, towards liver and is red in colour as it is flowing towards the transducer. It has an undulating pattern and shows respiratory variation with increase flow in inspiration. It may reflect cardiac variation and shows postprandial increase calibre and flow in healthy individuals. Normal Doppler waveform of portal vein (Fig. 9.1.22). Portal hypertension can be defined as elevated pressure within the portal venous system resulting in impaired blood flow through the liver. INTRAOPERATIVE PANCREATIC AND HEPATIC ULTRASOUND Intraoperative ultrasonography of the pancreas was first described in 1980 by Lane and Glazer. It is an important technique for guidance of both open and laparoscopic surgical procedures of the pancreas. As the transducer is in direct contact with the organ of interest, with no interference with air of adjacent soft tissue, it provides good resolution. It is considered superior to CT and MRI in assessing the intraoperative tumour resectability and vascular invasion and guiding resection. Indications and uses For intraoperative US during open surgical procedures, a high-frequency linear-array transducer or the hockey stick transducer (Fig. 9.1.23) are used which create high-resolution detail of the exposed pancreas. The side-fire curved linear-array transducer is effective for obtaining a wider view of the pancreas and its surrounding structures and for scanning the liver. Intraoperative hepatic ultrasound gives the real-time visualization of the hepatic anatomy and aid for surgical planning and making decision during surgery. Indications and uses Transducer and technique Limitations MULTIDETECTOR CT OF THE HEPATOBILIARY SYSTEM AND CHOLANGIOGRAPHY The cross-sectional plane of the patient is denoted as the x/y plane. The plane along which the table moves is the ‘z’ plane. Multidetector CT denotes more than one detector along the Z-axis, with the latest machines having up to 320 and now even 640 rows of detectors. This provides CT with very fast, high resolution, isotropic images which can be reconstructed in any plane or even curved planes. MDCT scanners can comfortably scan the entire abdomen in 10 seconds or less, thereby allowing visualization of different phases of contrast enhancement. Contrast Media (CM) after administration gets distributed from the intravascular compartment into the interstitial spaces. Intravascular arterial enhancement (for angiography) and parenchymal enhancement have different kinetics. Parenchymal enhancement is directly proportional to total iodine dose being administered and inversely proportional to weight, which is a marker of extracellular volume into which contrast redistributes. Rate of iodine administration has no effect on degree of parenchymal enhancement. As a general rule approx. 500–600 mg of iodine/kg body weight achieves adequate hepatic parenchymal enhancement. For a 60 kg adult, this translates into approx. 100–120 mL of contrast containing 300 mg of iodine per mL. Intravascular or arterial enhancement is controlled by rate at which iodine is administered (flow rate and iodine concentration of CM) iodine flux and duration for which contrast is administered longer injection also leads to better overall arterial opacification due to recirculation effects. This principle is made use of while performing abdominal CT Angiography. Higher iodine delivery rate per unit time using a higher iodine concentration contrast medium also improves conspicuity of vessels and hypervascular lesions such as HCC. For identical parameters, difference in arterial enhancement between patients is dependent on cardiac output with enhancement being inversely proportional to cardiac output. For optimal imaging and enhancement, in multiphase imaging and angiographic studies, contrast material administration and parenchymal or vascular enhancement must be synchronized with CT data acquisition. The two main methods are: Test bolus technique: A test dose of contrast is given and the time to peak enhancement is measured in a ROI placed in a target vessel this information can be used to tailor CT acquisition. Automated bolus Triggering: ROI is placed in target vessel (usually aorta at level of diaphragm) on a plain image. While CM is injected, a series of low dose scans is obtained through the ROI. When the density of contrast reaches a predefined threshold (e.g. 150 HU), at time ‘t’ the scan is automatically triggered. The trigger delay after time ‘t’ is a minimum of 2 sec, and can be programmed to any value. Bolus tracking is nowadays the method of choice for planning contrast medium administration and this technique provides more homogenous opacification. Saline chase is recommended in all multiphase protocols. Significant amount of contrast may be present in the peripheral veins after injection of IV contrast and use of saline chaser leads to better vascular enhancement and lower overall contrast dose (Fig. 9.1.24). Using the above, a standard sequence of acquisitions and contrast enhancement techniques can be tailored to the pathology and organ of interest and pre-programmed into the scanner menu, which includes kVp, mAs, pitch, rotation time, slice thickness etc. This is known as a scan protocol. However, these can be modified as necessary. For example, rotation time can be shortened and pitch can be increased for breathless patients to reduce scan times (Table 9.1.4). Multidetector CT is the workhorse of hepatobiliary imaging. It plays a major role in imaging congenital, traumatic, infective, neoplastic and vascular pathologies of the hepatobiliary system. Scans can be obtained with or without intravenous (IV) iodinated contrast material administration. Multidetector CT scanners are capable of imaging multiple phases at different points of time following injection of contrast and provide dynamic imaging due to fast scan times and rapid coverage of the abdomen. Indications for liver imaging include, but are not limited to: Unenhanced Scan: Hepatic fat estimation, radio opaque biliary calculi. Single Phase Scans: Liver abscess, polytrauma, follow up of known oncologic or benign lesions, abdominal pain, suspected cholecystitis. Multiphase Studies: Evaluation of hepatic masses, imaging in cirrhosis, imaging for resectability, liver donor evaluation, malignancy of GB, hepatic venous outflow obstruction etc. CT Angiography of Hepatic Vessels: Trauma, vasculitis, post-operative bleeding and as a part of multiphase studies. Depending on the indication, scanning protocols can be tailored to highlight the suspected pathology and provide relevant answers for further management (Table 9.1.5). The liver has a dual blood supply, most of which is derived from the portal vein. After injection of contrast, until the portal vein provides recirculated contrast material filled blood to enhance the hepatic parenchyma, the hepatic parenchymal enhancement is relatively poor and dependent only on the hepatic artery. The hepatic arterial phase can be divided into an early arterial phase without any portal opacification, a late arterial or portal inflow phase in which there is some portal vein opacification. This is followed by a portal venous phase in which portal and hepatic veins are enhanced (also called the hepatic venous phase in some articles). In addition, an unenhanced/plain scan and an equilibrium phase can also be acquired. Tumour conspicuity of hypervascular lesions was found to be best on the late arterial or portal inflow phase (Fig. 9.1.25). The early arterial phase is seen up to 10 seconds after trigger, and provides ‘angiographic’ images of hepatic arterial anatomy. This phase is used to provide details regarding arterial anatomy and morphology. Later arterial phase 18–23 seconds, portal venous phase 60–70 seconds and equilibrium phase 180 seconds are obtained after trigger. Equilibrium phase images have been shown to increase detection of hepatocellular carcinoma in cirrhotic patients. The portal venous phase is the standard phase for routine chest/abdomen survey and follow up of hepatic abscesses and hypovascular metastases. Single Phase Scan Protocol: Oncologic follow-up, Liver Abscess – For routine single-phase CT, contrast as per body weight can be injected over 40 seconds and scanning can be done after an empiric delay of 70 seconds from the beginning of injection. This protocol provides good parenchymal enhancement and portal and hepatic vein visualization. Plain scan is optional. Dual-Phase Scan Protocol: Hepatic evaluation in patients with malignancies known to have hypervascular metastases – Neuroendocrine tumours, renal cell carcinoma, thyroid carcinoma, (.) melanoma etc. Late arterial Phase 20–22 seconds and Portal venous phase at 60–70. Plain scan optional. Hepatic Resection Protocol: For patients with known hepatic mass being evaluated for resection. Early arterial phase provides pure arterial or angiographic images. It is obtained at 8–10 seconds post trigger followed by portal venous phase at 60–70 seconds. This is required for arterial and venous anatomy and volumetric evaluation if required. Plain scan is not required. In case a hepatic mass needs characterization as well as resectability planning, late arterial and equilibrium scans may also be done. Indications for angiography are further discussed in the section on angiography. The same biphasic protocol using angiography or arterial phase images is used in patients with trauma suspected to have pseudoaneurysms, hepatic artery thrombosis or dissection in transplant recipients, evaluation of living donors and in patients in whom an angiographic ‘road map’ is required prior to intervention. Triphasic or 4 phase scan Protocol: Standard of care for patients with cirrhosis being evaluated for Hepatocellular carcinoma and for patients being evaluated for hepatic mass of uncertain aetiology. Late arterial phase scan: 20–22 seconds, Portal venous scan at 60–70 seconds and Equilibrium scan at 180 seconds. Plains scans are optional. Our institutional practice is to always do plain scans in patients who have undergone hepatic intervention. Plain scans also help to visualize siderotic and steatotic nodules. A further delayed scan is suggested by some authors at 10–15 minutes for characterization of hepatic masses of uncertain provenance. This is particularly useful in cholangiocarcinoma (Table 9.1.6).
9.1: Radiological techniques in hepatobiliary imaging
Introduction
Technique
Preparation
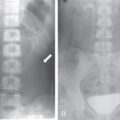
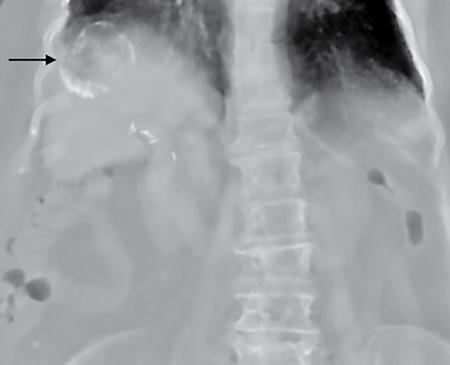
Plain radiography for liver
Radiography for gallbladder and biliary tract


Radiography for pancreas
Introduction
Patient preparation
Scanning technique
Gallbladder and biliary tree
Liver
Hepatic anatomy on ultrasound

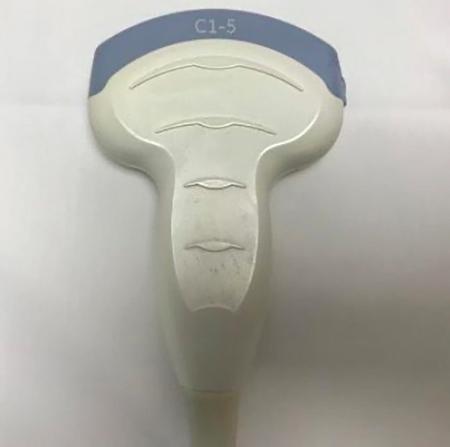
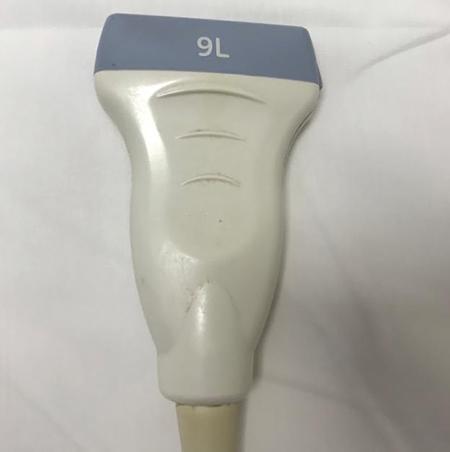
Transducers
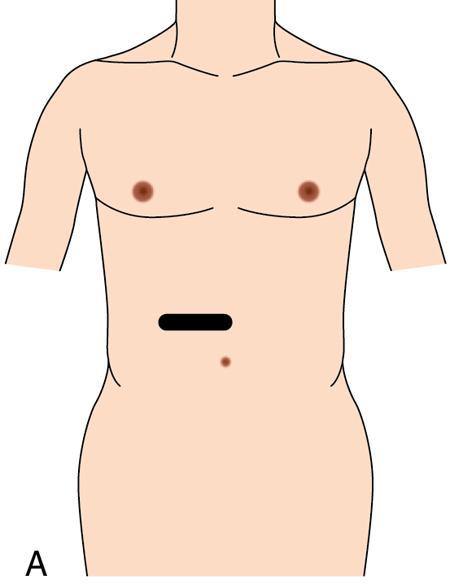
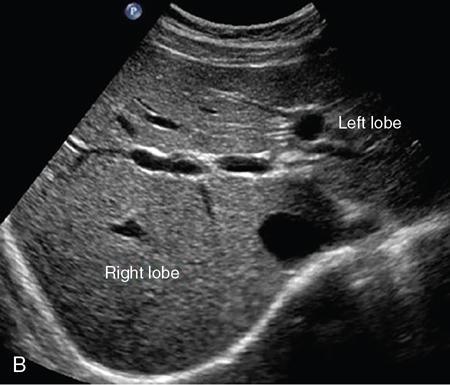
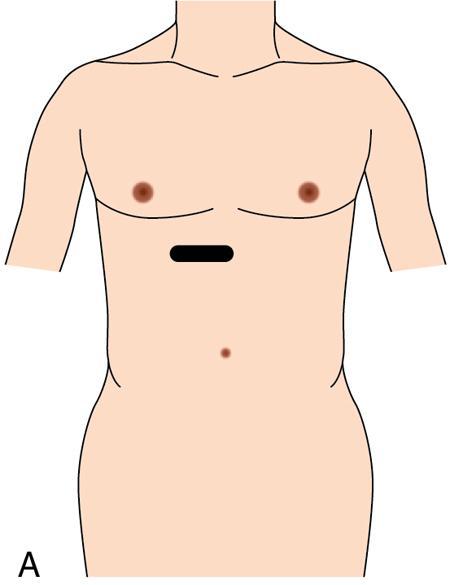
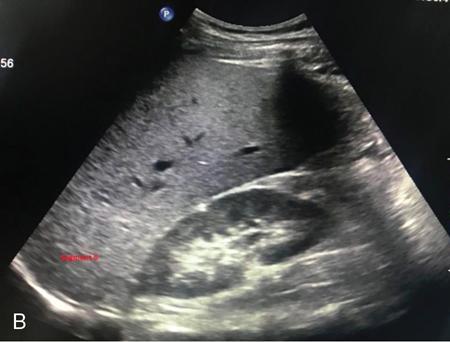
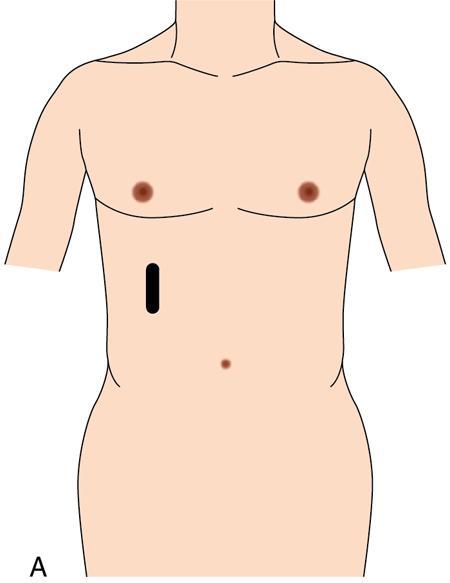
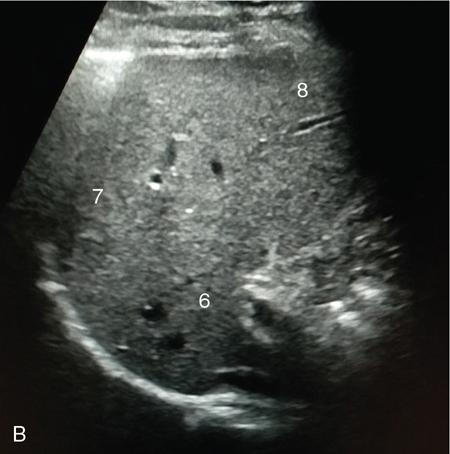
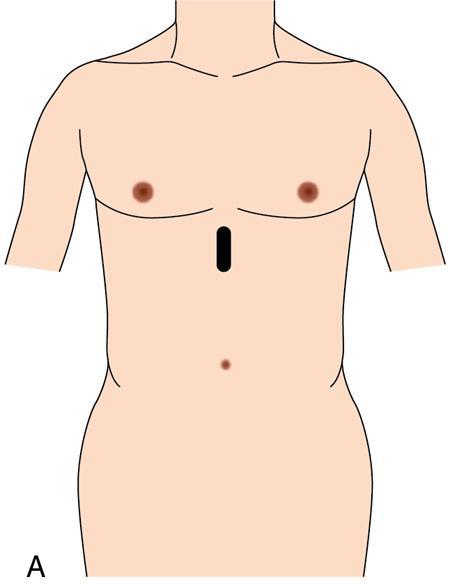
Technique of scanning liver
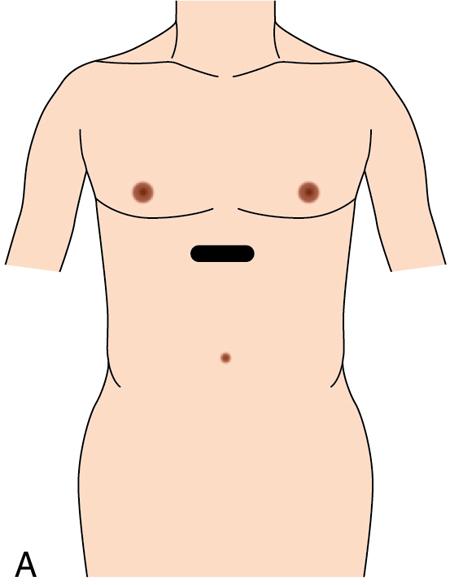
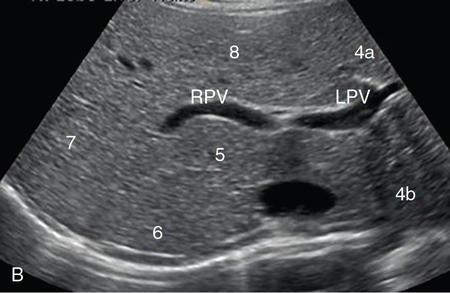
Transverse plane for hepatic veins (Fig. 9.1.13)


Oblique 45-degree view for main portal vein (Fig. 9.1.17)
Pitfalls
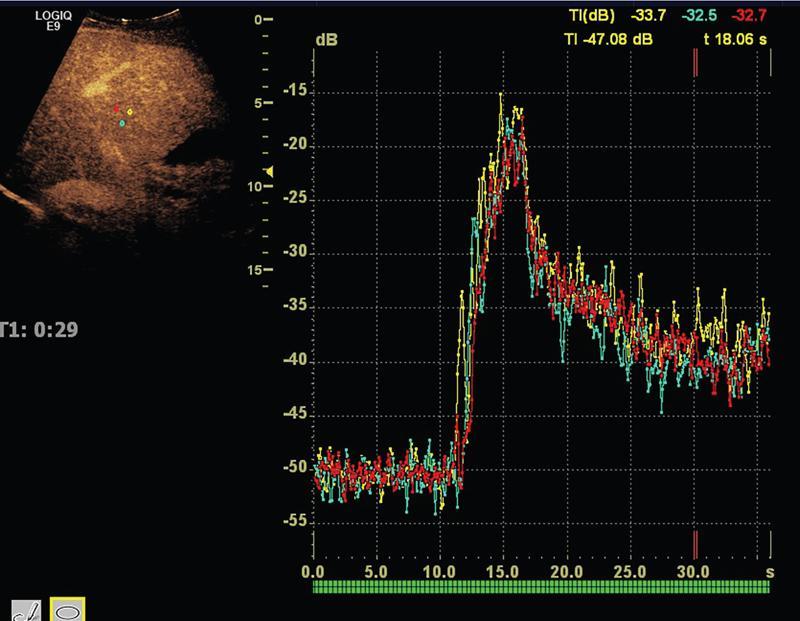
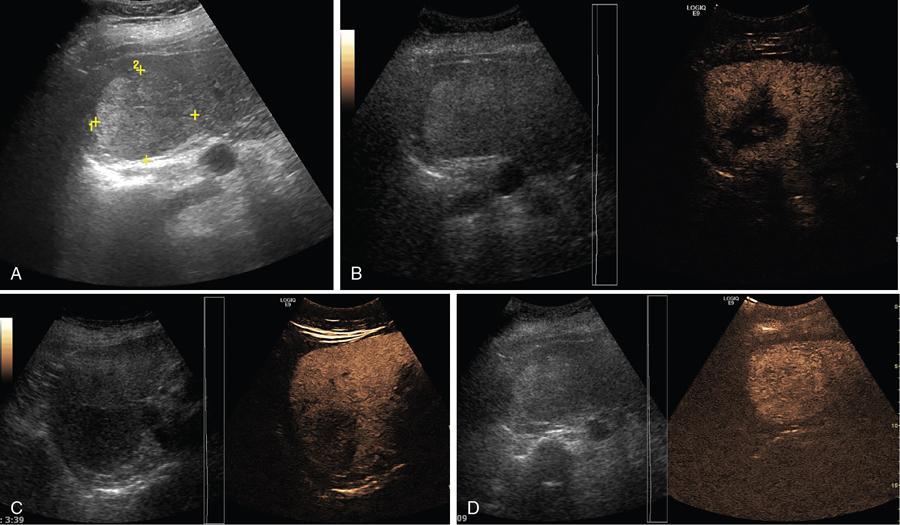
Contrast-enhanced ultrasound (CEUS)
Phase
Post Injection Time in Seconds
End Time
Arterial
10–20
25–35
Portal venous
30–45
120
Delayed phase
>120
Microbubble disappearance (240–360)
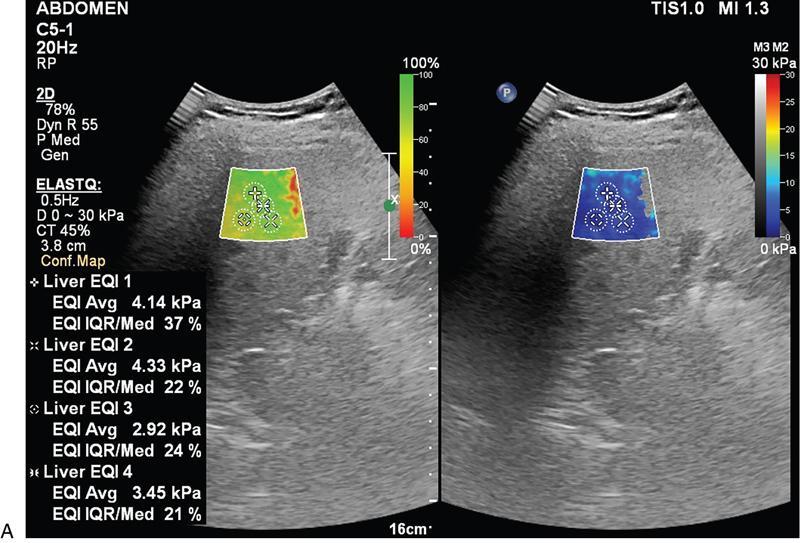
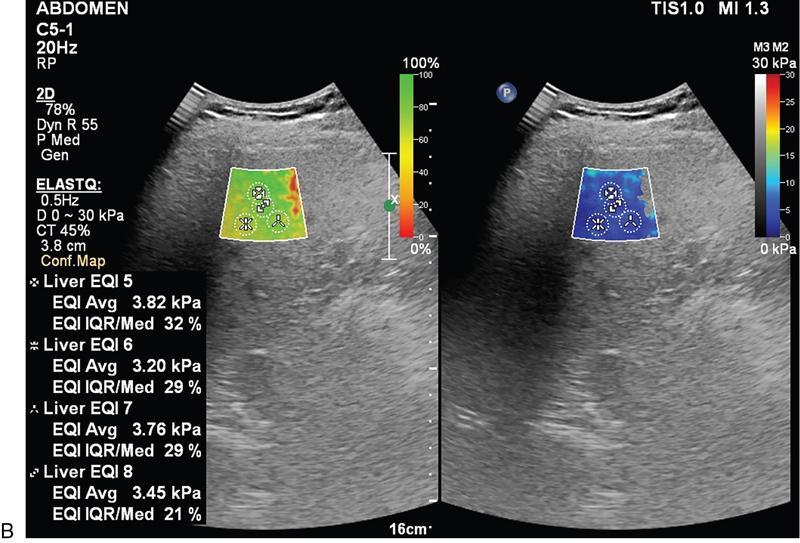
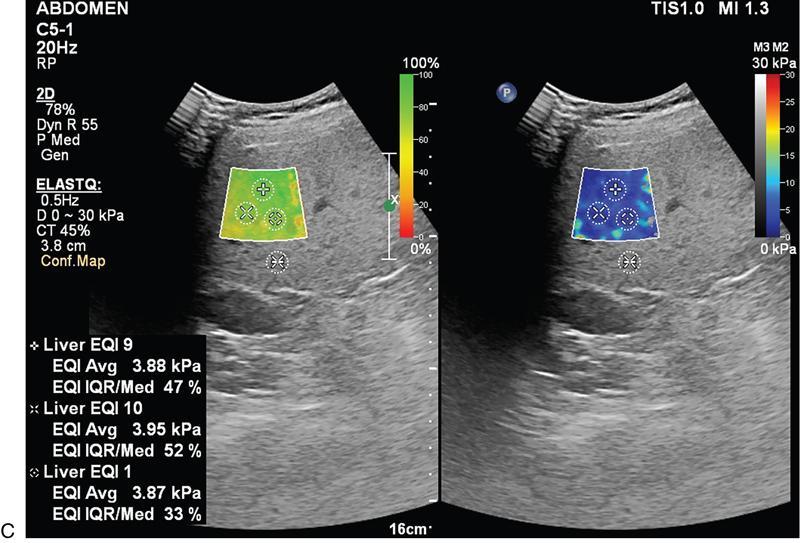
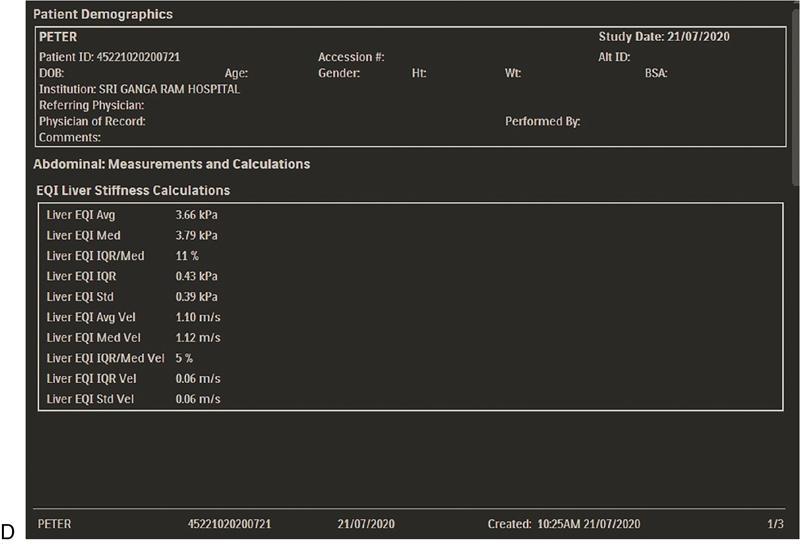
Liver elastography
Two main methods used are ARFI (acoustic radiation force impulse) and fibroscan
Indications and uses
Technique
Scoring system
Liver Fibrosis Staging
Metavir Score
kPa
m/s
Normal
F0
2.0–4.5
0.81–1.22
Normal–Mild
F0–F1
4.5–5.7
1.22–1.37
Mild-Moderate
F2–F3
5.7–12.0
1.37–2.00
Moderate–severe
F3–F4
12.0–21.0+
2.00–2.64+
Limitations of ARFI
Fibroscan
Introduction
Indications and uses
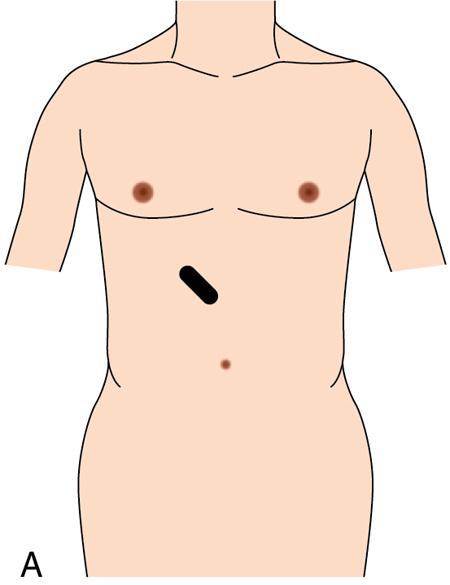
Technique
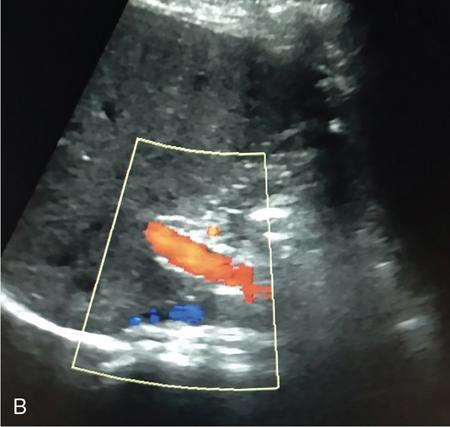
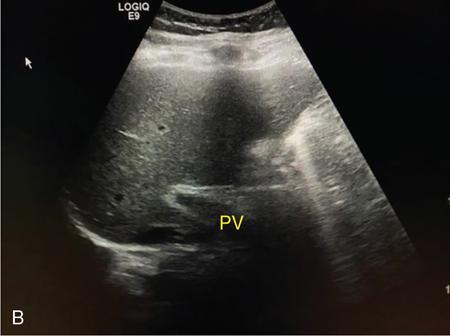
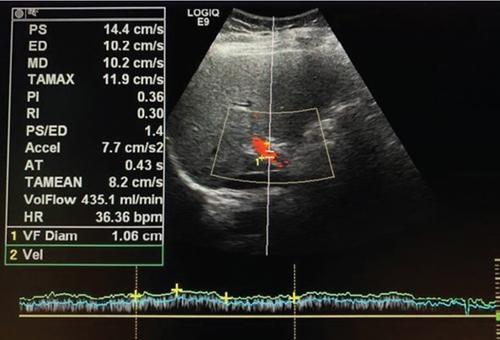
Doppler imaging
Sonographic features of portal hypertension
Pitfalls
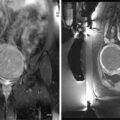
Intraoperative pancreatic ultrasound
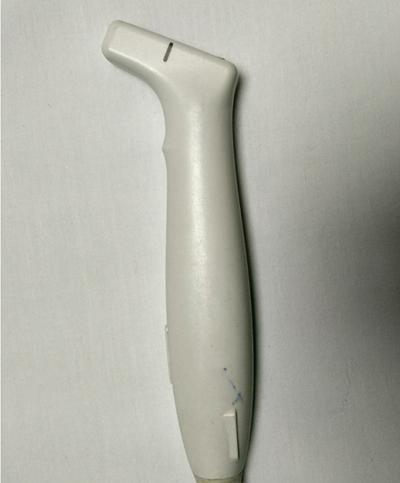
Transducers for use in intraoperative US
Technique
Pitfalls
Intraoperative hepatic ultrasound
Multidetector CT of the hepatobiliary system
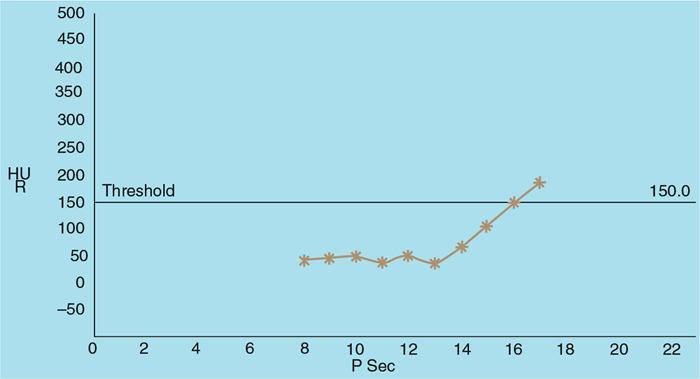
Principles of contrast administration and enhancement
Indications for diagnostic imaging of liver and gallbladder
Phase
Timing
Visualization
Early arterial (CT angiography)
8–10 seconds post-trigger
Arterial tree
Later arterial/portal inflow
15–20 seconds post-trigger
Hypervascular hepatic lesions
Portal/hepatic venous
60–70 seconds post beginning of CM injection
Hypovascular lesions against enhanced hepatic parenchyma
Equilibrium
180 seconds post beginning of CM injection
Some HCC in cirrhotic liver
Delayed
5 minutes post-trigger
Cholangiocarcinoma, hemangioma
Scan protocols for hepatic imaging
Clinical Indications
Plain
Early Arterial
Late Arterial
Portal Venous
Equilibrium
Evaluation of cirrhosis for hepatocellular carcinoma
O
N
Y
Y
O
Hepatic resection, liver donor vascular evaluation, suspected hepatic arterial pathology
O
Y
Y
Y
O
Follow-up of oncology patients, liver abscess
N
N
N
Y
N
Hepatic steatosis/liver attenuation index, suspected biliary calculi
Y
N
N
N
N Related posts:
![]()
Stay updated, free articles. Join our Telegram channel

Full access? Get Clinical Tree


Radiological techniques in hepatobiliary imaging
9.1.1
9.1.2
9.1.3
9.1.4
9.1.5