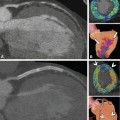
Fig. 10.1
Improved depiction of the right coronary artery (RCA) on curved multiplanar reformations using motion mapping with automatic identification of the phase with least motion during mid-diastole (Panel a), when compared with standard reconstructions centered at 70% (Panel b) and 80% (Panel c) of the cardiac cycle, which show minimal (Panel b) and more severe (Panel c) motion artifacts (arrowheads). Note the excellent visualization of the distal vessel segment with automatic phase selection (asterisk in Panel a). Ao aorta, LM left main coronary artery
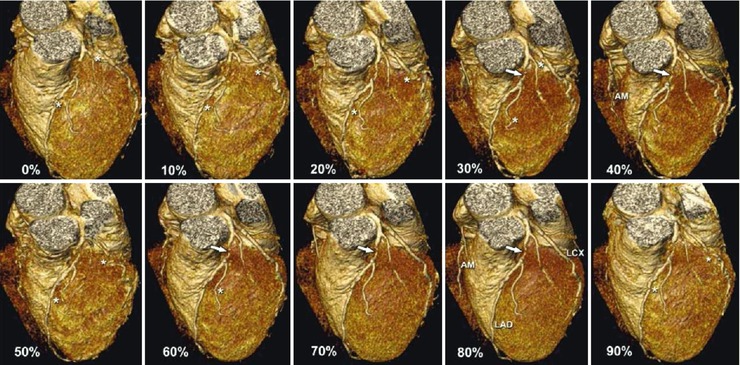
Fig. 10.2
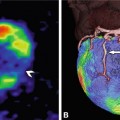
Three-dimensional volume-rendered reconstructions of the coronary arteries (left anterosuperior views) shown for 10 image reconstruction intervals throughout the entire cardiac cycle (centered at 0–90%). There is a significant stenosis (arrow) of the proximal left anterior descending coronary artery (LAD), which is best seen at 70 and 80% but also at 40%. In comparison, however, the left circumflex coronary artery (LCX) is best seen at 70 and 80%. There are multiple motion artifacts in the other reconstruction intervals (marked with asterisks), rendering these phases nondiagnostic (artifacts were identified using the axial source images). Interestingly, the right coronary artery with its acute marginal (AM) branch is well depicted during mid-diastole (80%) as well as end-systole (40%). In many cases, the right coronary artery is best seen at end-systole (especially at higher heart rates)
However, even after all the desired phases are reviewed, a coronary artery segment may occasionally still prove to be of nondiagnostic quality, e.g., because of artifacts resulting from very high or irregular heart rates or patient movement.
If a stenosis is seen in any phase, this finding should be confirmed by excluding motion artifacts. This confirmation can be accomplished in two ways: (1) by correlating the results with those for the same coronary segment in another phase, and/or (2) by reviewing the axial images in lung window settings in order to detect potential motion in the image (e.g., at the heart-lung border). If no stenoses are seen and image quality is good, it is not necessary to go through all the reconstructed coronary artery phases. The comprehensive assessment of a cardiac CT study on a workstation takes time and concentration.
10.1.2 Systematic Approach
The review of a cardiac CT data set focuses on the coronary arteries but should also comprise assessment for other cardiac findings and extracardiac findings. As in all radiological examinations, a systematic approach is pivotal to a comprehensive evaluation of all anatomical regions (List 10.1). Easy evaluation of the coronary arteries is now possible by reading (semi)automatic curved multiplanar reformations, which are crucial for detecting pathology. However, the findings should always be confirmed on the original slices in axial, sagittal, and/or orthogonal orientations. Reading is improved when curved multiplanar reconstructions, double-oblique reconstructions, and source images can be evaluated simultaneously. Thin-slab (3–5 mm) maximum-intensity projections are usually very helpful in evaluating the continuity of the coronary arteries.
List 10.1. Systematic approach to reading cardiac CT studiesa
1.
Obtain a quick overview of the gross anatomy, e.g., by looking at three-dimensional renderings
2.
Assess the individual coronary arteries and major side-branches by using reconstruction tools and viewing original slices, preferably simultaneouslyb
3.
Evaluate the cardiac extracoronary structuresc
4.
Evaluate extracardiac organsd
a The approach may vary with the workstation used.
b Double-oblique reconstructions, thin-slab maximum-intensity projections, and curved multiplanar reformation are very helpful displays for evaluating the major coronary arteries and their large side-branches. Any pathology detected on such advanced reconstructions should be confirmed on original axial, coronal, or sagittal slices.
c This includes the cardiac valves, the myocardium, the atrial, and ventricular cavities (e.g., for presence of intracavitary thrombus), evaluation of (left) ventricular function, the pericardium, and the aortic root.
d This includes assessment of all organs other than the heart and has to be performed on large fields of view. Evaluate the large vessels (e.g., the aorta for dissection or aneurysm and the pulmonary arteries for presence of emboli), mediastinum, hila, lungs, chest wall and breasts, abdominal organs, and bones in organ-adapted window-level settings.
Among patients with suspected coronary artery disease, only 5% have obstructive (>50% diameter reduction) stenoses in distal segments or minor side branches without a more proximal stenosis (Fig. 10.3). Thus, major branches and side branches as well as bifurcations are first places to look when searching for significant stenoses. Prestenotic dilatation of the vessel lumen is an interesting indirect indicator of a significant stenosis located distally, and its recognition is critical. Furthermore, aneurysms of the coronary arteries are present in 5% of patients with atherosclerotic coronary artery disease but can also be present in patients without significant stenoses (Fig. 10.4).
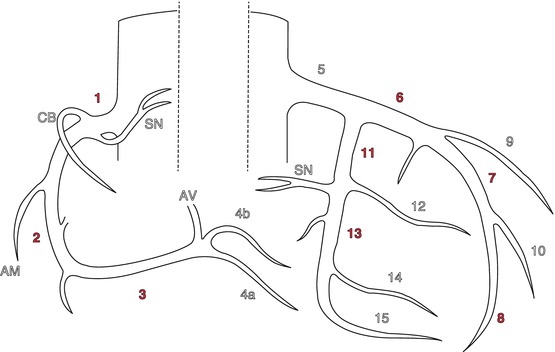
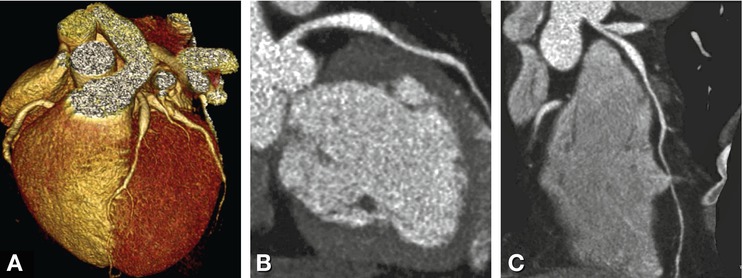
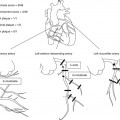
Fig. 10.3
Coronary artery model using 17 segments based on the AHA segmentation published in 1975 by Austen et al. The segments which account for more than 5% of percutaneous coronary interventions each and are thus of major relevance in reading cardiac CT have pink numbers (1–3, 6–8, 11, 13). The left main coronary artery (segment 5) is also of great relevance and in about 3% of cases obstructive stenoses are found here; they are mainly treated with bypass grafting (about two-thirds of cases) and less commonly with percutaneous coronary intervention. It is important to note that it is very rare to detect an isolated distal obstructive (>50%) stenosis without a significant proximal lesion in a patient. Nevertheless, also side branches and distal segments (as small as 2 mm in diameter) need to be searched for significant stenoses that might be amenable to treatment. Bifurcations are other important sites to look for stenoses when ruling out coronary artery disease. The right coronary artery consists of 5 segments (1-4a/b), with the distal segment (4) being further subdivided into 4a (posterior descending artery, PDA) and 4b (right posterolateral branch) in right-dominant circulation. The left anterior descending coronary artery consists of segments 6–10, with the two diagonal branches being segments 9 and 10. The left circumflex coronary artery consists of segments 11–15, with the two (obtuse) marginal branches being segments 12 and 14. In case of right-coronary dominance, at least one right posterolateral branch (segment 4b) is present and supplies the inferolateral myocardial segments. If the left coronary artery is dominant, the distal left circumflex ends as the posterior descending coronary artery (segment 4a). In case of codominance, segment 4a is part of the right coronary, and the distal left circumflex ends as a posterolateral branch (4b) after giving off two marginal branches. AM acute marginal branch, Av atrioventricular node branch, CB conus branch, SN sinus node artery (Modified from Austen et al. Circulation 1975)
Fig. 10.4
Dilation without significant coronary stenosis. Volume-rendered image (Panel a) and multiplanar reconstructions (Panels b and c) of the left anterior descending coronary artery in a 47-year-old male with atypical chest pain. The patient had no coronary artery stenoses but did have dilating coronary artery disease. Note the dilation in the proximal left descending coronary artery. There is some focal myocardial bridging, and the right and left circumflex coronary arteries were also dilated (not shown)
If images look very poor on every reconstruction despite adequate contrast and compliance of the patient during the examination, one should inspect the recorded ECG tracing for irregularities, such as premature ventricular contraction, extrasystoles, or atrial fibrillation, or search for postprocessing errors by looking at the phases selected for image reconstruction. Using ECG editing, image degradation due to ECG irregularities can often be overcome by deleting or adding R waves for triggering and reconstructing image data without scanning the patient again (Fig. 10.5).
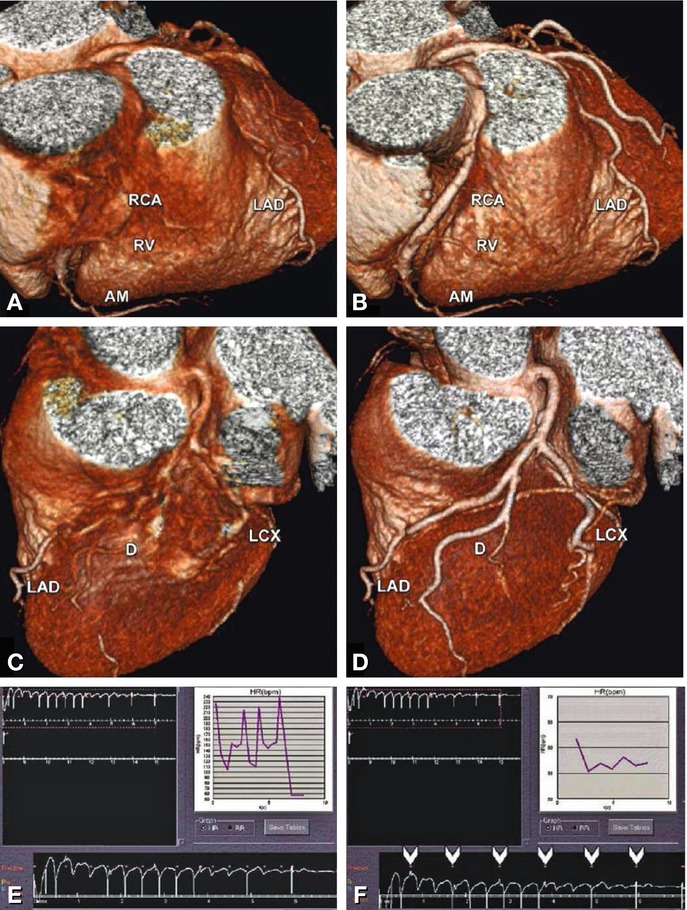
Fig. 10.5
Use of ECG editing significantly improves the image quality of reconstructions on the basis of the same raw data (without rescanning the patient). The left side (Panels a, c, and e) shows the results before editing, and the right side (Panels b and d) the three-dimensional reconstructions obtained after ECG editing. The entire course of the coronary arteries is blurred before ECG editing because of extrasystoles during scanning (Panel e, differentiating supraventricular and ventricular extrasystoles was not possible using this data and Holter ECG was recommended). Excluding the arrhythmic peaks and using only the typical R-wave peaks for editing (arrowheads in Panel f) greatly improves the images of both the right (Panel b) and the left (Panel d) coronary artery system. The right-hand corner insets in (Panels e and f) show the unedited and edited heart rate courses over time that were used for image reconstruction. AM acute marginal artery, D diagonal branch, LAD left anterior descending coronary artery, LCX left circumflex coronary artery, RCA right coronary artery, RV right ventricular branch
10.1.3 Source Images
Reading cardiac CT datasets requires knowledge of coronary and cardiac anatomy (Chap. 3). The axial source images represent the basic reconstructions that contain all information available in the three-dimensional dataset. Conclusions and final diagnoses should always be based on standard slices in the axial and orthogonal planes (which is possible because of isotropic voxel size in CT). Scrolling through the slices back and forth on a workstation is the best way to look at the source images. Additional information can be obtained from thin-slab maximum-intensity projections (see below) and interactive double-oblique positioning of slices along or orthogonal to lesions.
List 10.2. Reconstructions available for reading cardiac CT angiography studies
1.
Axial, coronal, and sagittal images are the primary source of information
2.
Curved multiplanar reformations are convenient for identifying stenoses
3.
Maximum-intensity projections give a good overview of vessels and lesions but may obscure stenoses and overestimate calcified lesions
4.
Angiographic emulations and three-dimensional renderings may be used for elegant display and presentation of findings
Compared with the source images, all other reconstructions such as curved reformations, maximum-intensity projections, angiographic emulations, and volume rendering (List 10.2) tend to reduce the information content and may even obscure relevant information. The main advantage of these reconstructions, which can be prepared by the technician, is that they make evaluation of the coronary arteries much easier because large vessel segments are displayed in a single image. This wide view can be beneficial in detecting abnormalities such as short coronary stenoses or wall irregularities (Fig. 10.6). Also, reconstructed images can be useful for demonstrating results during multidisciplinary team meetings. Printouts showing the reconstructed coronary arteries can be sent to the referring physicians as summaries of image findings and images stored in the picture archiving and communication system can be used for demonstration in interdisciplinary conferences.
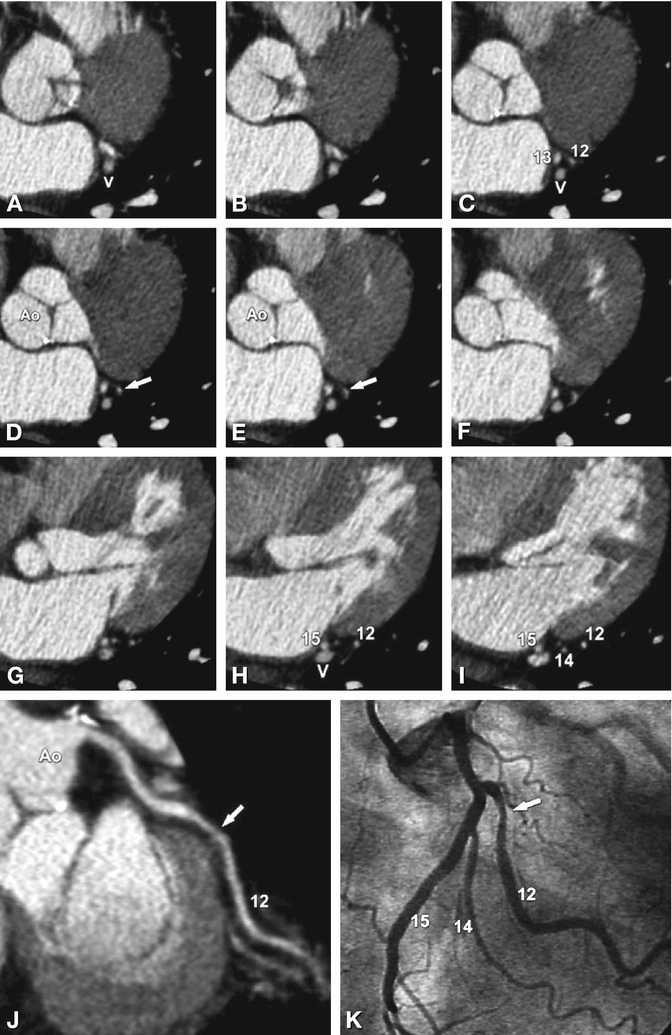
Fig. 10.6
Short coronary artery stenosis of the first obtuse marginal artery (segment 12) that might be missed on axial images (Panels a–i), which show the stenosis on only two consecutive slices (arrow in Panels d and e).
In contrast, this 75% diameter stenosis (as measured on quantitative coronary angiography) is easily detected on a curved multiplanar reformation (arrow on Panel j), demonstrating the advantage of such reconstructions along the vessel course. There is good agreement of the CT finding with conventional coronary angiography (Panel k). V cardiac vein
10.1.4 Curved Multiplanar Reformations
Curved multiplanar reformations are generated using a centerline along the coronary vessel path and show large parts of the coronary vessel lumen in a single image (Figs. 10.6 and 10.7). Depending on the workstation used, the curved multiplanar reformations may be rotated around their centerlines, thereby rotating the coronary artery lumen around its longitudinal axis and greatly improving the visual estimation of the severity of the stenosis. The curved multiplanar reformations also allow rendering cross-sectional images orthogonal to the vessel course, which further facilitates the quantification of the percent diameter stenosis (based on reference and stenosis diameters, Fig. 10.8).
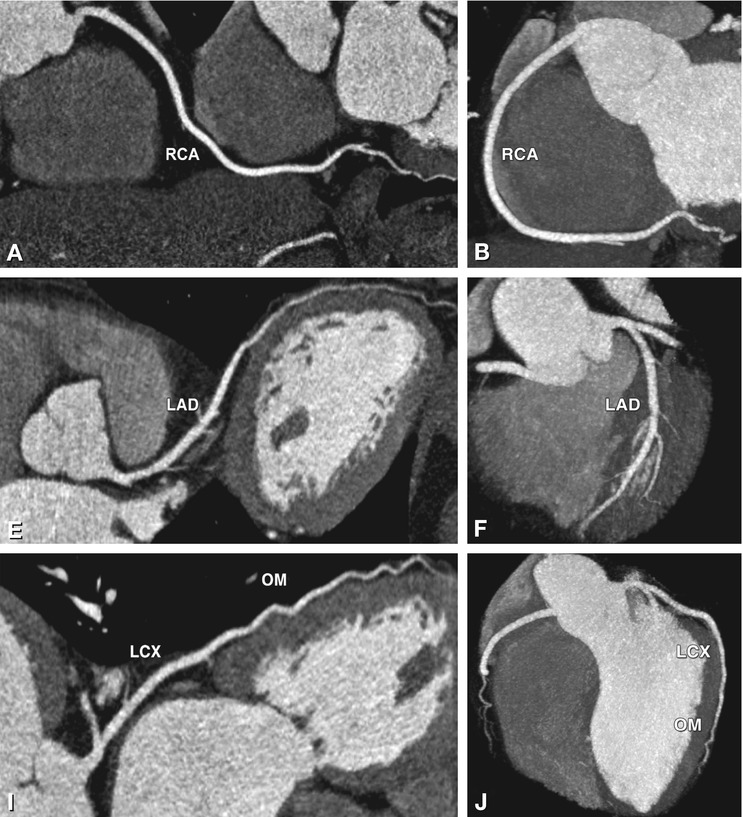
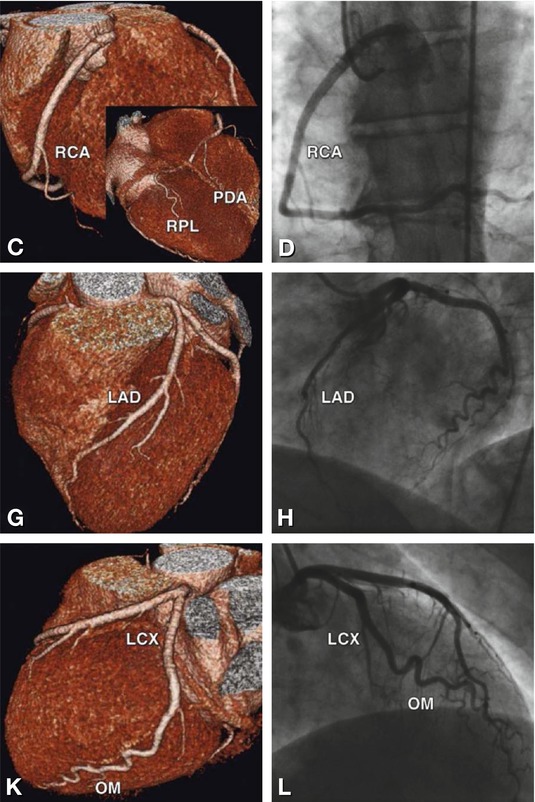
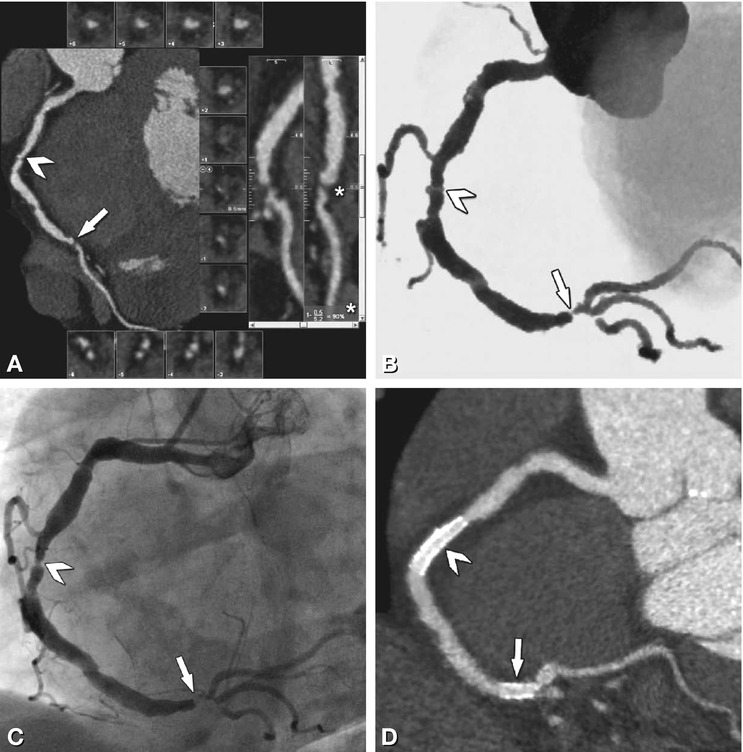
Fig. 10.7
Normal coronary arteries as seen on curved multiplanar reformations (first column), maximum-intensity projections(second column), and three-dimensional volume-rendered reconstructions (third column) of multislice CT using 64 simultaneous detector rows. There is good correlation with conventional coronary angiography (last column). The results are shown separately for the right coronary artery (RCA, Panels a–d), left anterior descending coronary artery (LAD, Panels e–h), and left circumflex coronary artery (LCX, Panels i–l). Curved multiplanar reformations allow estimation of the percent diameter stenosis from two perpendicular directions along the long axis or from orthogonal cross-sections and also the detection of coronary artery plaques, with evaluation of their composition. Maximum-intensity projections give a nice overview of the entire vessel but may obscure stenoses because of their projectional nature. Three-dimensional reconstructions provide an overview of long segments of the coronary arteries but should not be used for reading cases. Please note that there is right coronary artery dominance in this patient, with the right coronary giving off the posterior descending artery (PDA), as well as a large right posterolateral artery (RPL, inferior view of the heart in the inset in Panel c). OM obtuse marginal artery
Fig. 10.8
Measurement of percent diameter stenosis using curved multiplanar reformations and orthogonal cross-sections. Right coronary artery with a high-grade stenosis at the crux cordis (arrow and asterisk in the perpendicular longitudinal views in Panel a). The reference vessel diameter is measured proximal and distal to the lesion, and the stenosis diameter is measured within the lesion on orthogonal cross-sections (squared insets in Panel a). From these measurements (automatic or by caliper) the percent diameter stenosis (in this case 90%) is calculated (asterisk in Panel a). There is good correlation with angiographic emulation of CT (Panel b) and conventional coronary angiography (Panel c) regarding this high-grade coronary artery stenosis. A second stenosis is present in segment 2 of the right coronary artery, which was calculated to be a 75% diameter stenosis on quantitative analysis (arrowhead in Panels a–c). Both stenoses were treated with stent placement and there was no significant in-stent restenosis on a cath view reconstruction of the follow-up CT (Panel d)
Continuously improving automatic vessel detection and segmentation tools are available for the creation of curved multiplanar reformations. These automatic software tools are currently available on all commercial workstations and allow diagnostic accuracy to be maintained while relevantly reducing analysis time. When using one of the currently available reconstruction tools, however, the user must be aware of two limitations of automatic segmentation that can lead to false-positive or false-negative lesions: First, the automatic vessel probing tools do not always entirely follow the course of the coronary vessels (especially if these are very tortuous). The resulting images may suggest stenoses on the curved multiplanar reformations that are, however, usually readily identified as artifacts (Fig. 10.9). The centerline should be checked (e.g., on three-dimensional renderings) when stenoses are suggested (Fig. 10.9), and the findings should be confirmed on the original images. Anders et al. have shown that, especially for less experienced readers, curved multiplanar reformations alone are not recommended but should be supplemented by interactive double-oblique reformations along the vessels. The second common limitation of automatic vessel detection is that the most proximal segment of the coronary artery may not be completely probed. Significant proximal stenosis can thus be missed if one looks only at the automatically probed vessel segments. However, this limitation is also easily overcome by manually or automatically adding the vessel portions that have been missed by the automatic tool (Fig. 10.10). Fully automated computer-aided diagnosis systems for coronary CT angiography have become available recently (Fig. 10.11). These are currently being validated for clinical use and may have the potential to be used as a second reader to increase sensitivity, especially when a less experienced reader is interpreting the scan.
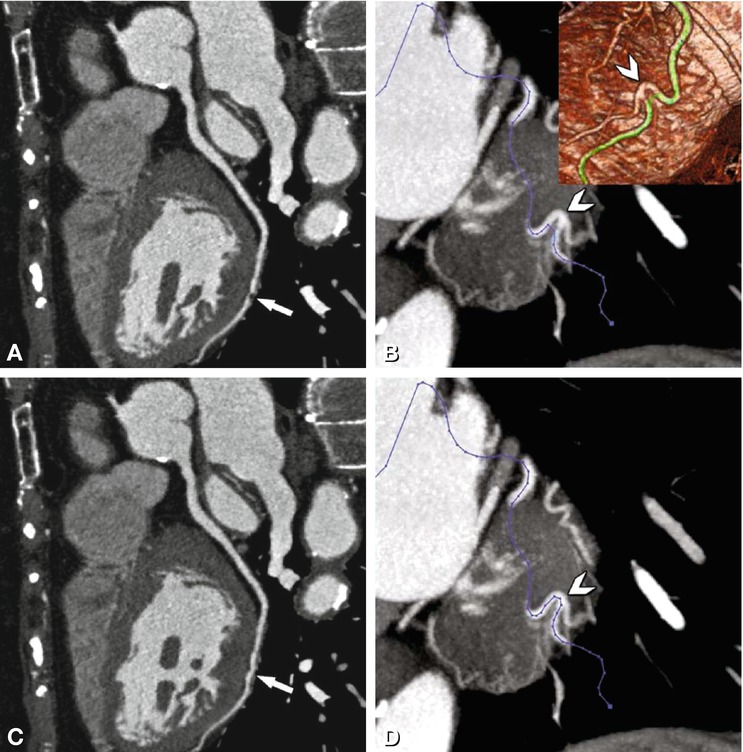
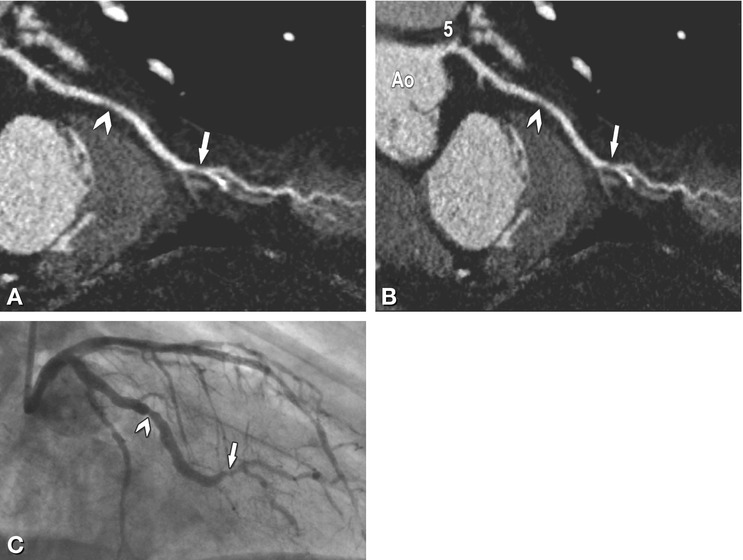
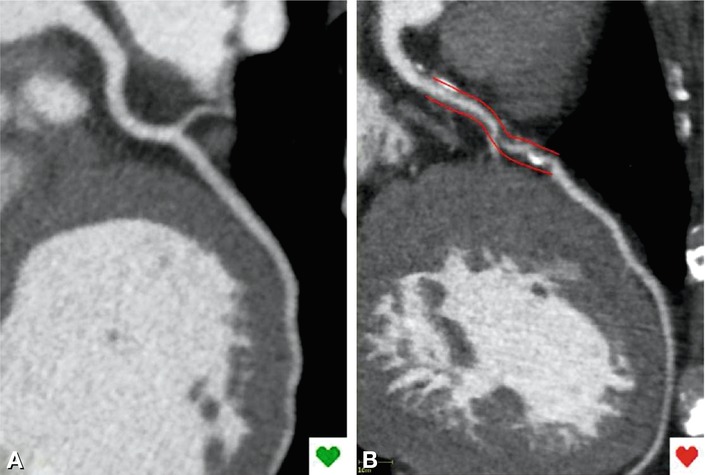
Fig. 10.9
Coronary artery pseudostenosis on a curved multiplanar reformation, caused by an automatic detection tool error. Pseudostenosis on the curved multiplanar reformation along the left circumflex coronary artery (arrow in Panel a) is caused by a short-track route of the automatic probing tool. This error in vessel tracking (arrowhead) is easily recognized on a maximum-intensity projection (blue centerline in Panel b) and in the green centerline on a three-dimensional reconstruction (inset in Panel b). After manual correction of the centerline (arrowhead in Panel d) the curved multiplanar reformation shows the actual course of the left circumflex coronary artery, which is unremarkable and continuous (Panel c)
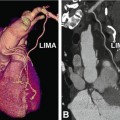
Fig. 10.10
The proximal vessel segment is sometimes missed by the automatic probing tool. Using such a curved reformation (Panel a), proximal stenoses cannot be excluded and, as illustrated here, manual extension of the centerline to the aorta (Ao) is necessary to visualize the entire vessel (Panel b) including segment 5 (left main coronary artery). There is a nonsignificant (arrowhead, 40%) and a significant stenosis in the first obtuse marginal branch (arrow, 70%), with good correlation with conventional coronary angiography (Panel c)
Fig. 10.11
Fully automated computer-aided diagnosis system for coronary CT angiography. This software (RCADIA, Cor Analyzer) allows automatic identification of patients without stenosis (Panel a) and with coronary stenosis (Panel b), who are indicated by green and red heart icons (inset), respectively
In addition to motion artifacts resulting from a rapid or irregular heartbeat, heavily calcified coronary segments pose the greatest challenge because they obscure the coronary artery lumen (Fig. 10.12). Heavily calcified segments may not be evaluable, although severe calcifications do not per se exclude evaluation. In this situation, visualization of coronary stenoses can be improved by using specific window-level settings (Fig. 10.13).
Get Clinical Tree app for offline access
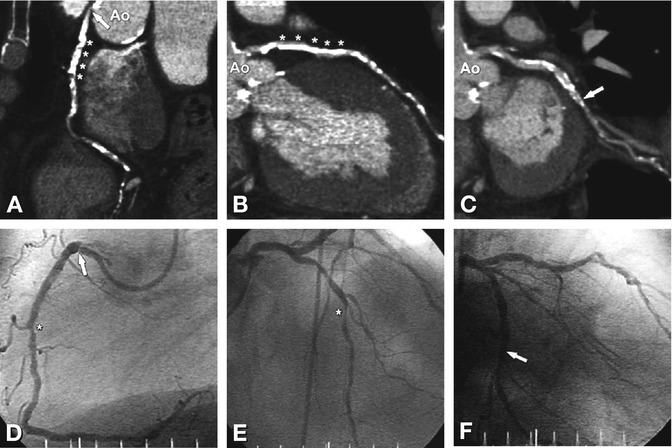
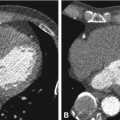
Fig. 10.12
Severe coronary calcifications can hamper the interpretation of CT coronary angiography. In this 82-year-old male patient, there are severely calcified plaques (asterisks) along the major course of the right coronary artery (Panel a) and left anterior descending coronary artery (Panel b). The resulting blooming artifacts obscure the coronary artery lumen, rendering the affected coronary artery segments nondiagnostic. These calcifications were found to cause only short significant stenoses (asterisk) in conventional coronary angiography (Panels d and e). There are additional less pronounced calcifications in the left circumflex coronary artery (arrow in Panel c), but these likewise preclude a definitive diagnosis regarding the presence of significant coronary artery stenosis. Conventional coronary angiography shows moderate stenosis of the left circumflex coronary artery (Panel f). Using stent kernels for severely calcified lesions might help to reduce the artifacts, although this approach results in higher noise levels that may also hamper evaluation. Specific window-level settings might be an option for analysis of both calcified and noncalcified plaques (Fig. 10.13). Note that there is also a short ostial stenosis of the right coronary artery (arrow in Panels a and d). Ao aorta
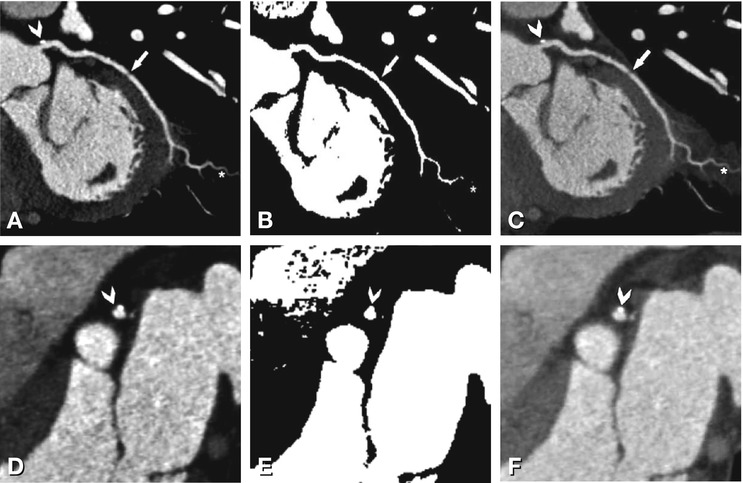
Fig. 10.13
Specific window-level settings may be used for different coronary artery plaques. The upper row presents curved multiplanar reformations along the left circumflex coronary artery, and the lower row presents cross-sections orthogonal to the left main coronary artery (as indicated by the direction of the arrowhead in Panel a). Noncalcified coronary plaques and outer vessel boundaries are best visualized using a window representing 155% of the mean density within the coronary lumen and a level representing 65% of the mean density within the lumen as described by Leber et al. (Chap. 14). (Panels a and d


Related posts:

Stay updated, free articles. Join our Telegram channel
Full access? Get Clinical Tree
