Fig. 31.1
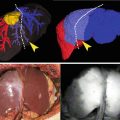
Demonstration of retrograde refilling of the ischemic area by the fluorescent dye. (a) Five seconds recording after initial fluorescence signals arose from a partially ischemic bowel loop; (b) Five seconds later, the ischemic area was partly filled by retrograde flow (no vessels were apparent and the refilling was slow); (c) The graph shows the slope of pixel intensity evolution over time: the blue and the green line represent the evolution of fluorescence on the vascular area and resection line respectively, showing a very steep and fast increase; the red line is the fluorescence signal on the ischemic zone. Note that after some time, by retrograde filling, fluorescence intensity could reach similar values to those of vascular areas; (d) The bowel loop with some mesenteric vessels clipped to create a segmental ischemia: points A, B, C marked on the loop correspond to the vascular area, resection line and ischemic area as identified by fluorescence time-to-peak and corresponding to the slopes displayed on the (c) panel; (e) The image shows the enhanced reality obtained by using the steepness of the slopes (speed to reach maximum intensity) to create the virtual perfusion cartography which was overlapped with real-time image
We aimed to fuse the concept of fluorescence videography with augmented reality (AR) to guide intestinal resection and assess vascular supply at the future anastomotic site.
AR is the process of superimposing virtual images of a patient onto real-time intraoperative images to enhance visual perception. Virtual images are created from preoperative DICOM images (CT-scan, Nuclear Magnetic Resonance or US) by 3D software manipulation in order to obtain a virtual clone of the patient [10–12].
In our method of assessment of bowel vascular supply, FLuorescence-based Enhanced Reality (FLER), virtual images of bowel perfusion (virtual vascular cartography) are generated from intraoperative live images based on fluorescence signals of indocyanine green.
To push the concept of fluorescence-guided evaluation of the future anastomotic site forward, our Research and Development department developed a dedicated image analyzer software (ER-PERFUSION, IRCAD, France) to obtain FLER [13].
FLER is a fluorescence videography system integrating a near-infrared endoscope (D-Light P, Karl Storz®, Tuttlingen, Germany) able to detect the fluorescence signal emitted by indocyanine green (ICG) and the ER-PERFUSION software, which can generate a virtual perfusion cartography based on fluorescence time-to-peak.
To assess time-to-peak in FLER, a dye injection is performed in real time while looking at the region of interest, in order to capture and record the “dynamics” of diffusion as well as the evolution of fluorescence. The virtual perfusion cartography is created by averaging the signals over a 20–40 s video at the speed of 5–25 frames per second and attributing a color code based on the time required to reach the maximum intensity of each pixel. Each single pixel composing the virtual perfusion cartography is a dynamic image (2D + diffusion time) representing the average of several images (from 100 to 200). The virtual cartography can be overlapped with real-time laparoscopic images in order to obtain the enhanced reality effect (Fig. 31.2).


Fig. 31.2
Schema of fluorescence-based enhanced reality. (a) A loop of small bowel was suspended and a window in the mesentery is made by sealing 3–4 vessels; (b) The fluorescence signal emitted by indocyanine green is captured by the near-infrared laparoscope (D-Light P, Karl Storz®, Tuttlingen, Germany); (c) A virtual perfusion cartography is generated using the ER-PERFUSION software, based on fluorescence time-to-peak and overlapped with laparoscopic images to obtain the FLER effect
In the experimental setting, FLER showed the ability to exactly detect future resection lines in a laparoscopic model of mesenteric ischemia. In the initial experimental model of small bowel ischemia, the software was set to detect a reduction of fluorescence time-to-peak of 50 % and the areas identified by enhanced reality (ischemic, future resection lines, and vascular areas) showed significant and congruent changes in lactate levels, mitochondria respiratory rate, and metabolomic fingerprint of ischemia [13].
The use of the fluorescence time-to-peak slope has two advantages when compared to the use of the absolute value of “fluorescence intensity.” First, time-to-peak is independent of the distance between the light source and the imaged area. This is not the case with fluorescence intensity, which is highly dependent on distance (a low perfused area may look more intensively fluorescent when observed closely and vice versa; a highly perfused area may look poorly fluorescent when observed from far away). We experimentally demonstrated the relationship between the light source-target distance and fluorescence intensity, using a customary electromagnetic tracking device (METRIS 3D) [14]. The METRIS 3D system is composed of a tube (1.2 m long and 2.2 mm in diameter) that fits into the operating channel of a conventional endoscope and contains seven 8 by 1 mm miniature electromagnetic probes distributed on its length. Electromagnetic probes are tracked by a commercially available magnetic tracking system (Aurora, Northern Digital Inc, Waterloo, Ontario, Canada). To track the position of the D-Light P laparoscope, the METRIS 3D system was attached onto the shaft of the laparoscope, and a 2 cm plastic tool was also fixed to establish a set distance. The laparoscope was then used to target the fluorescence calibrating tool in a dark environment, and was moved in and out several times (Fig. 31.3).
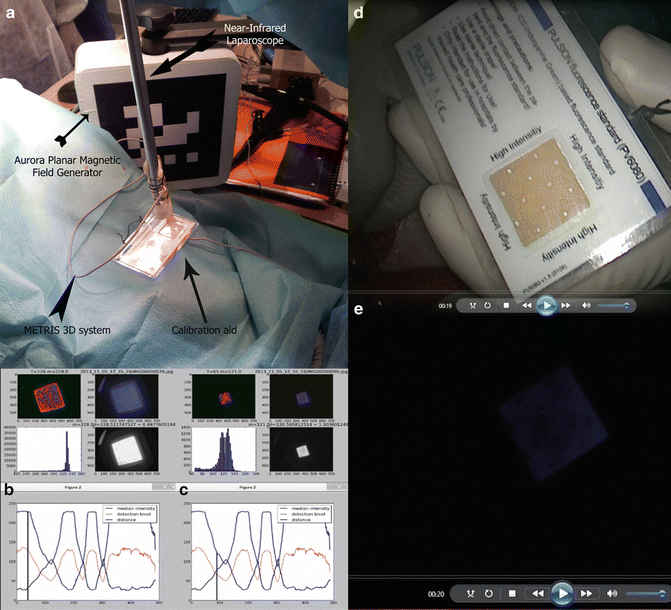

Fig. 31.3


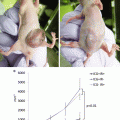
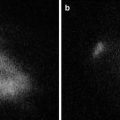
Relationship between fluorescence intensity and distance. (a) The METRIS 3D system is composed of a tube (1.2 m long and 2.2 mm in diameter) which fits into the operating channel of a conventional endoscope and contains seven 8 by 1 mm miniature electromagnetic probes distributed on its length. Electromagnetic probes are tracked by a commercially available magnetic tracking system (Aurora, Northern Digital Inc., Waterloo, Ontario, Canada). To track the position of the D-Light P laparoscope and measure the distance between the tip of the scope and the fluorescence calibrating tool, the METRIS 3D system was attached onto the shaft of the laparoscope and a 2 cm plastic tool was also fixed to establish a set distance. In (b) and (c) the inverse relationship between fluorescence intensity and distance is shown: the white square represents the “standard” response of the calibration tool when illuminated with the near-infrared laparoscope. The shorter the distance (black line), the higher the intensity (blue line). (d) The fluorescence calibration tool is shown in white light, and (e) the same image is shown after switching the D-Light P laparoscope to near-infrared mode
Stay updated, free articles. Join our Telegram channel

Full access? Get Clinical Tree


