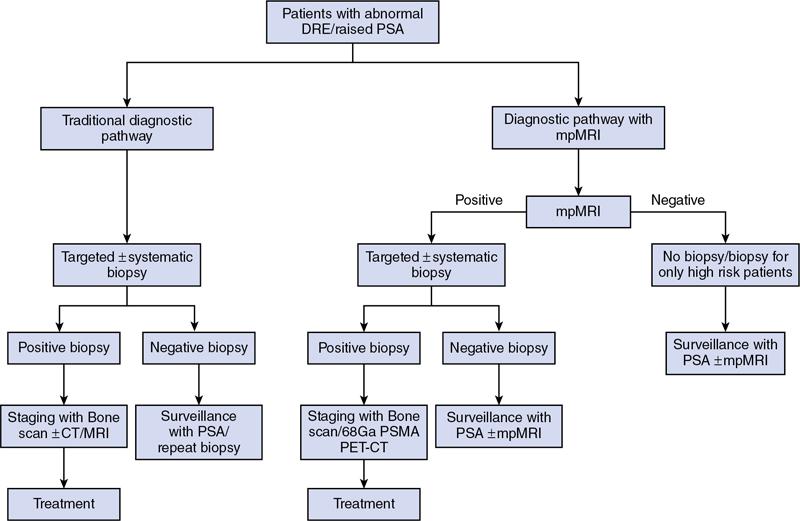
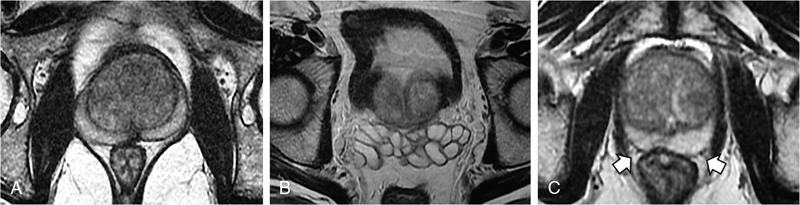
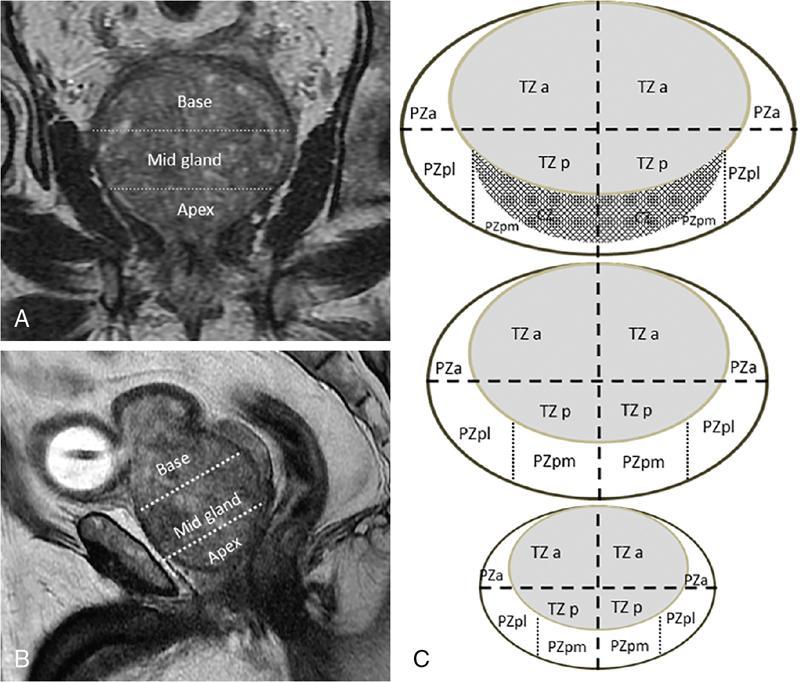
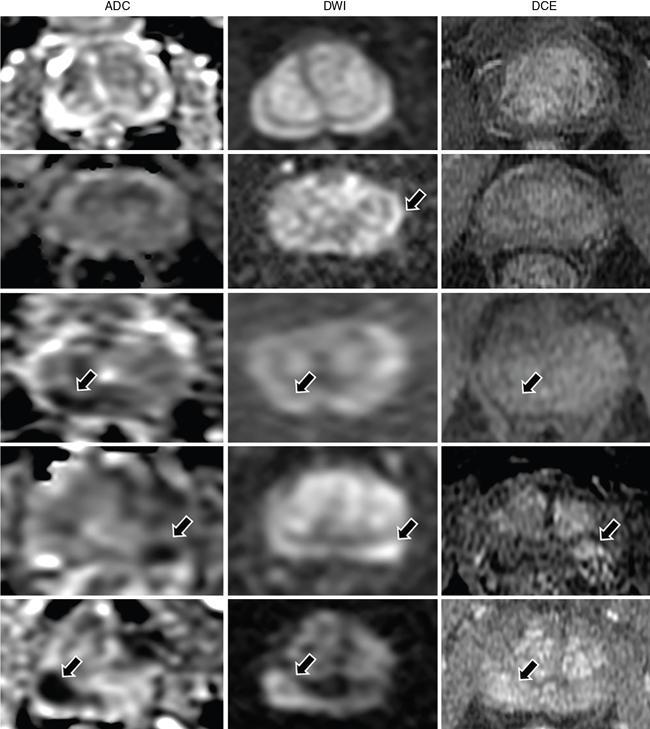
MULTIPARAMETRIC MRI OF THE PROSTRATE Dayala Sundaram Worldwide prostate cancer is the most common solid organ malignancy and the second most common cancer in men. The incidence of prostate cancer in India is 3.9 per 100,000 men and contributes 9% of all cancer-related mortality. Traditionally, serum prostate specific antigen (PSA) and digital rectal examination (DRE) are used as screening tools, and systematic transrectal ultrasound (TRUS)-guided biopsy is considered as the gold standard for confirmation for the detection of cancer prostate. Nevertheless, this combined approach has led to the risk of overdiagnosis and overtreatment of clinically insignificant low volume and indolent tumours. On the other hand, tumour in the anterior aspect of the gland tends to be missed by TRUS-guided biopsy until they grow to a substantial size and reach within 15–20 mm from the posterior margin, leading to delayed diagnosis. Moreover, systematic TRUS biopsy has also proven to underestimate the final Gleason score of the tumour following radical prostatectomy, leading to inaccurate triaging and selection of therapeutic options. Multiparametric magnetic resonance imaging (mpMRI) changed the paradigms on prostate cancer detection. It struck a balance between underdiagnosis and overdiagnosis with a clinical priority not to miss any clinically significant cancer (Gleason score ≥4 + 3, and/or volume ≥0.5 cc, and/or extraprostatic extension). Initially, MRI was not used for the primary detection of the tumour, but it was mainly used for locoregional staging in biopsy-proven patients since it provided only morphologic information with T1-weighted imaging (TIW) and T2-weighted imaging (T2WI). Ever since the introduction of mpMRI, which combines the morphological assessment of T2WI and molecular and physiologic assessment by diffusion-weighted imaging (DWI) and dynamic contrast-enhanced (DCE) imaging, it has been used in primary tumour detection as well as staging. Over the period, mpMRI has been proven to have high sensitivity and negative predictive value (NPV) in diagnosing clinically significant prostate cancer, however, with more variable specificity. A positive association has also been established between abnormal mpMRI and increased tumour volume and high grade. Overall, the introduction of mpMRI has changed the traditional diagnostic pathway in the management of prostate cancer (Fig. 11.24.1.1). Efforts were taken to improve the global standardization in image acquisition, interpretation and reporting of mpMRI of prostate and prostate imaging reporting and data system (PI-RADS) was introduced in 2012. T1WI, T2WI, DWI, DCE and spectroscopy were identified as the key sequences. In 2015, PI-RADS version 2 (v2) was released with the inclusion of key advancements in image acquisition and incorporation of a five-point final assessment scoring system for peripheral zone (PZ) and transition zone (TZ). Spectroscopy was excluded in PI-RADS v2. The recent update, PI-RADS version 2.1 (v2.1), proposed in 2019, endorses small adjustments to obviate ambiguities in the scoring system and reduces inter-reader variability. PI-RADS is intended for detection, localization and risk stratification in patients with suspected cancer in the prostate gland and staging the confirmed cases. However, detection of recurrence, progression during active surveillance and evaluation of other parts of the body (e.g. skeletal system) are not included in PI-RADS. In mpMRI following recent TRUS-guided biopsy, the postbiopsy haemorrhage in the prostate gland and seminal vesicles may confound assessment. Since the postbiopsy changes may persist for many months, and it may not always be feasible or necessary to postpone the MRI examination. Moreover, if mpMRI is performed following a negative TRUS biopsy, the possibility for clinically significant prostate cancer (csPCa) at the site of postbiopsy haemorrhage is less likely without corresponding suspicious finding on MRI. If postbiopsy haemorrhage or inflammation adversely affects the interpretation of a study, then at least 6 weeks or longer should be considered for follow-up. MR spectroscopy was recommended in PI-RADS v1. However, no incremental value was acclaimed by MR spectroscopy in routine clinical use despite prolonging the duration of the study and requirement of dedicated software. Hence, MR spectroscopy was not included in PI-RADS v2. High-resolution T2WI is the fundamental sequence in mpMRI useful to identify the zonal anatomy, assess abnormality within the gland, seminal vesicle invasion, extraprostatic extension and nodal metastasis. Due to high glandular content, the normal PZ appears as homogeneously hyperintense. Whereas, due to high cellularity and less water content, the clinically significant cancer in the PZ usually appears as a hypointense focus. Moreover, the decrease in intensity on T2WI is proven to be positively associated with the aggressiveness of the tumour. Due to the high cellularity, the normal TZ also appears heterogeneously hypointense, which makes the detection of cancer difficult in the TZ. Caveats: Benign conditions like prostatitis, haemorrhage, glandular hypertrophy, postbiopsy scar and post-therapy changes may show similar hypointensity. Benign stromal elements may appear hypointense in the TZ. Scoring: PI-RADS v2.1 recommends separate five-point scoring system for lesions in PZ and TZ based on T2WI. However, T2WI scoring is used only in overall risk assessment of TZ lesions and caries no significance in PZ lesions (Table 11.24.1.1). DWI quantifies the degree of the random movement of water molecules within the prostate. Due to high cellularity, the motion of the water molecules is inhibited within the tumour, which is seen as a high signal on DWI and low signal intensity on apparent diffusion coefficient (ADC) maps. It is recommended to obtain one low b-value image set at 50–100 s/mm2 and one intermediate b-value image set at 800–1000 s/mm2. b50 is used instead of b0 to prevent shine through of vessels. A high b-value image set with ≥1400 s/mm2 is also mandatory, which preferably should be acquired separately or calculated from low and intermediate b-value images. According to PI-RADS v2.1, high b-value image (≥1400 s/mm2) must be used for interpretation. In the high b-value image (≥1,400 s/mm2), background signal from the nonmalignant tissue is suppressed; hence, the sensitivity and accuracy are increased (Fig. 11.24.1.2). Moreover, the degree of signal reduction on ADC map has been proven to be positively associated with increasing Gleason score. However, at high b-value, the SNR decreases, to compensate for the signal loss, it is essential to increase the number of excitations (NEX) with increasing b-value. Caveats: Some benign hyperplastic (BPH) nodules in the TZ may show restricted diffusion. Susceptibility artefacts may be encountered in DWI by air in the rectum or metal hip prosthesis, which can be minimized by using short TE. Scoring: Each suspicious lesion in the PZ and TZ are scored based on five-point scoring system (Table 11.24.1.2). DCE involves the rapid acquisition of T1WI after the administration of intravenous Ga-based contrast agent. Due to tumour angiogenesis prostate cancers often demonstrate early enhancement compared to normal tissue. Some of the tumour shows early washout, while others may retain contrast for a longer duration. DCE, in combination of T2WI and DWI, further increases the sensitivity for detection of csPCa, particularly in men with lower PSA levels (<10 ng/mL) and for less experienced readers. DCE also plays an essential role in the assessment of local recurrence following prior radical treatment or focal therapy. Caveats: Presence of early enhancement alone not definitive for cancer and the absence of early enhancement does not exclude the possibility completely. Diffuse enhancement may be noted in prostatitis. DCE has a limited role in assessing lesions in the TZ. Scoring: Lesions in the PZ are assessed with positive or negative scoring. A negative score on DCE not only indicates the absence of early enhancement but also includes diffuse or multifocal enhancement in the gland (Table 11.24.1.3). Useful to detect biopsy-related haemorrhage within the gland or seminal vesicles and to detect nodal and skeletal metastasis. Tumour focus will not show any significant changes on T1WI. With a broad range of MRI scanners with different static field strength, receiving coil technologies and software platforms, it is difficult to achieve a bespoke mpMRI prostate imaging guidance for every MR system. Hence, individual parameters like repetition time (TR)/echo time (TE) acquisition matrices should be tailored for every system to obtain high-resolution images. The number of slices can depend on the size of the prostate gland. In benign prostatic hyperplasia (BPH), the central zone (CZ) is compressed and displaced by the enlarged TZ. The prostatic pseudocapsule or surgical capsule is a thin hypointense rim at the interface of TZ and PZ. Seminal vesicles appear hyperintense on T2WI. Neurovascular bundles are noted in the posterolateral aspect at 5-o’clock and 7-o’clock positions (Fig. 11.24.1.3). PI-RADS v2.1 segmentation model has 41 sectors: 38 for the prostate, 2 for the seminal vesicles and 1 for the external urethral sphincter. Prostate is divided into right/left by a vertical line through the centre and from superior to inferior, divided into three regional parts: the base, the mid gland and the apex. PZ on both sides at each level subdivided into three sections: anterior (a), medial posterior (mp) and lateral posterior (lp). Similarly, the TZ on both sides at each level subdivided into two sections: anterior (a) and posterior (p) (Fig. 11.24.1.4). Sector map may help the radiologists, urologists and pathologists to precisely localize findings described in mpMRI reports and provide a roadmap for MRI targeted biopsy/therapy and for surgical dissection. It can be used as a visual aid for discussions with patients regarding biopsy and therapeutic options. Each suspicious lesion is scored individually based upon the zonal location of the lesion. The PZ lesions are scored with DWI and ADC, and the TZ lesions are scored with T2WI and DWI. The individual scores are used to get a combined overall risk assessment category score from 1 to 5. Percentage of malignancy for each category is given in Table 11.24.1.5. The dominant sequence in the PZ is DWI, and the lesions in the PZ are scored from 1 to 5 based on ADC map and corresponding DWI. DCE plays a secondary role only in assessing the equivocal cases (PI-RADS 3) in the PZ. A lesion with PI-RADS score 3 based on ADC map and DWI can be upgraded to overall assessment PI-RADS category 4 if it shows early enhancement on DCE (Fig. 11.24.1.5). Scoring criteria should be firmly adhered to avoid the potential scoring of inflammation (score 2) as score 3, which in turn can be upgraded to overall PI-RADS category 4 if showing early enhancement on DCE. Marked hyperintensity on DWI is defined as more pronounced signal change than any other focus in the same zone. Lesions in the TZ are assessed with T2WI and DWI (Fig. 11.24.1.6). No significant role for DCE in TZ lesions. Since T2W is the primary determining sequence if the lesion has a T2W score of 4 and DWI score of 2, the final assessment category should be 4. Shape and margin of the lesion are the critical features for evaluation. Focal lesions, nodules or regions that differ from the imaging characteristics of the background should be scored. If multiple nodules with similar degrees of restricted diffusion scattered throughout the TZ, they should not be scored since they make restricted diffusion as a feature of background. The classic-appearing encapsulated BPH nodules are considered as a normal variant and assigned PI-RADS score 1. BPH nodules with high cellularity may have marked restricted diffusion, still can be categorized as score 1 with the help of T2WI. The atypical nodules, which are not fully encapsulated, and hypointense areas between the nodules are classified under score 2. If they have a marked restricted diffusion (DWI score of ≥4), they can be upgraded to PI-RADS 3 overall assessment category. Lesions in category 3 can be upgraded to category 4 if they demonstrate a DWI score of 5 (i.e. size >15 mm or invasive behaviour) (Fig. 11.24.1.7).
11.24: Recent advances in reproductive system
Introduction
Indications for mpMRI
Contraindications
Timing of mpMRI following TRUS biopsy
Patient preparation
Technical specifications
MRI sequences
T2-weighted imaging
Score
Transition Zone (TZ)
1
Normal appearing TZ or typical nodule (round, completely encapsulated nodule).
2
Mostly encapsulated nodule or homogeneous circumscribed nodule without encapsulation (atypical nodule)/homogeneous mildly hypointense area between nodules.
3
Heterogeneous signal intensity with obscured margins. Includes others that do not qualify as to 4, or 5
4
Lenticular or noncircumscribed, homogeneous, moderately hypointense lesions measuring <1.5 cm
5
Same as 4, but size of the lesion ≥1.5 cm/definite extraprostatic extension/invasive behaviour
Diffusion-weighted imaging

Score
Peripheral Zone (PZ) or Transition Zone (TZ)
1
No abnormality on ADC and high b-value DWI (i.e. normal)
2
3
4
Focal marked hypointensity on ADC map and marked hyperintensity on high b-value DWI; <1.5 cm in greatest dimension
5
Same as 4 but size of the lesion ≥1.5 cm in greatest dimension/definite extraprostatic extension/invasive behaviour
Dynamic contrast-enhanced MRI
Score
Peripheral Zone (PZ)
(−)
(+)
Focal and earlier enhancement than adjacent normal prostatic tissue corresponds to suspicious finding on T2WI and/or DWI
T1-weighted imaging
Acquisition protocol
Normal MRI anatomy of the prostate (Table 11.24.1.4)
Histologic Zone
Anatomy
% of Glandular Tissue
Appearance on T2WI
% of Cancer
Peripheral zone (PZ)
Between pseudocapsule and capsule
70%–80%
Hyperintense
70%–75%
Transition zone (TZ)
Surrounding the urethra proximal to the verumontanum
5%
Heterogeneous signal intensity
20%–30%
Central zone (CZ)
Surrounding ejaculatory ducts
20%
Low signal
Uncommon
Anterior fibromuscular stroma (AFMS)
Anterior to the transition zone
Nil
Hypointense and symmetric
—
Sector map
Assessment and reporting
Category
Risk of Clinically Significant Prostate Cancer (csPCa)
% PCa
PI-RADS 1
Very low (possibility for csPCa is highly unlikely)
13–24
PI-RADS 2
Low (possibility for csPCa is unlikely)
PI-RADS 3
Intermediate (possibility for csPCa is equivocal)
34–50
PI-RADS 4
High (possibility for csPCa is likely)
60–77
PI-RADS 5
Very high (possibility for csPCa is highly likely)
91–97
Evaluation of peripheral zone

Evaluation of transition zone

Related posts:


Stay updated, free articles. Join our Telegram channel

Full access? Get Clinical Tree


