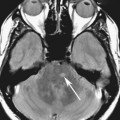
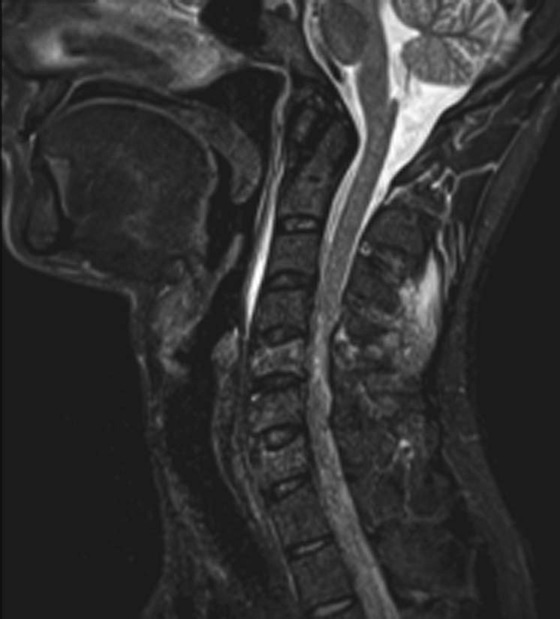
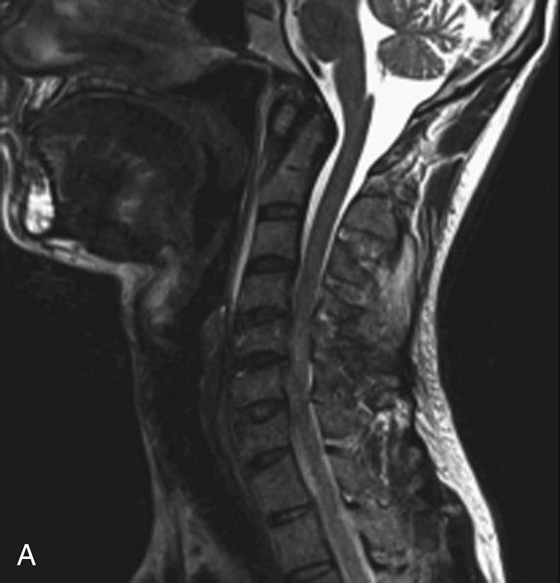
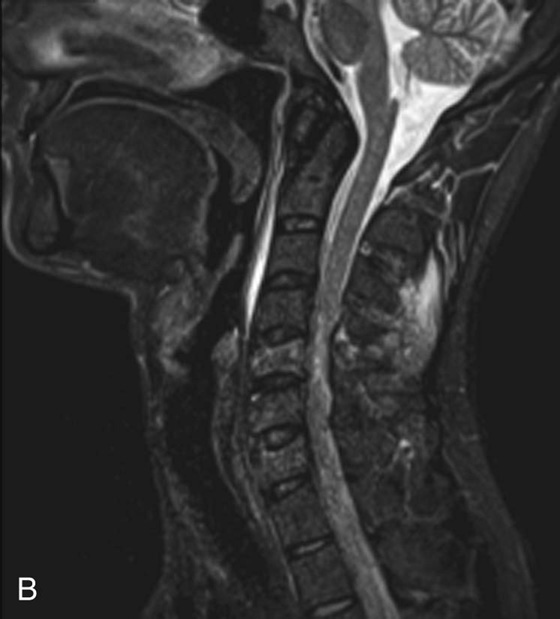
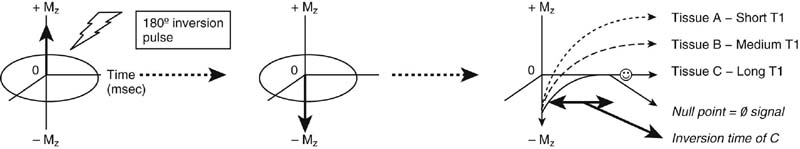
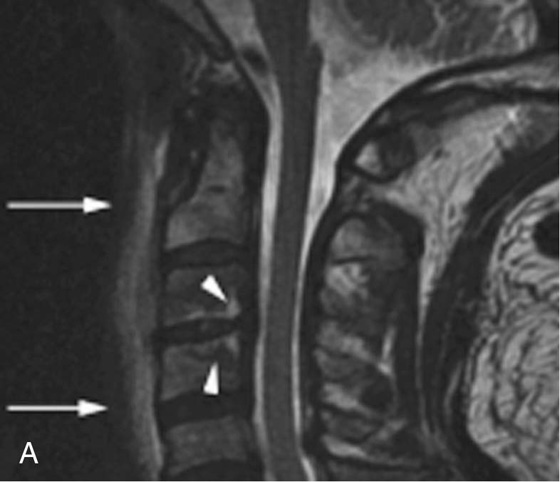
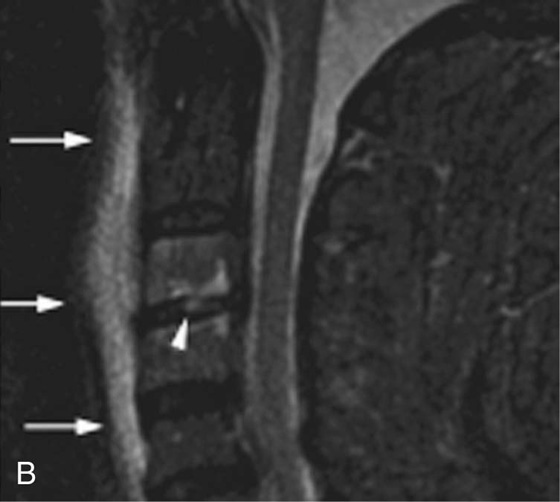
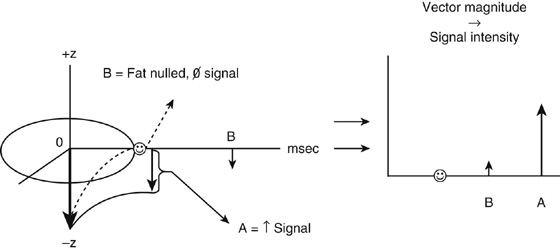
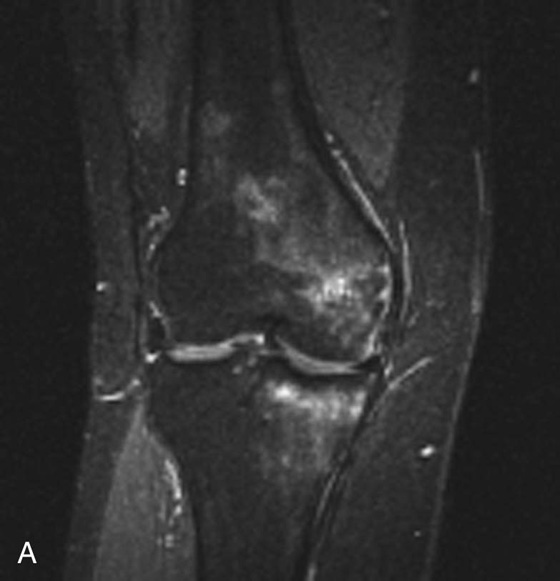
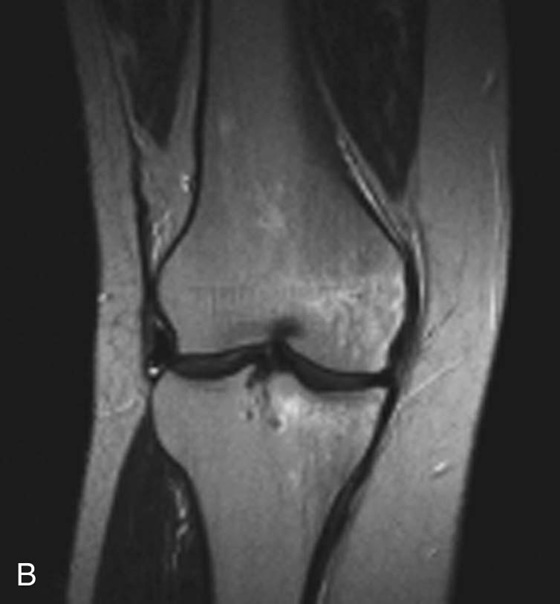
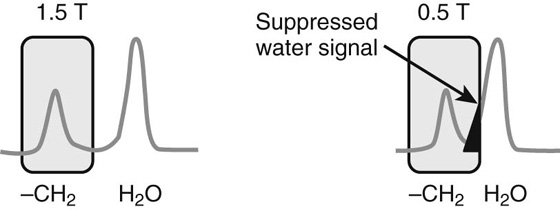
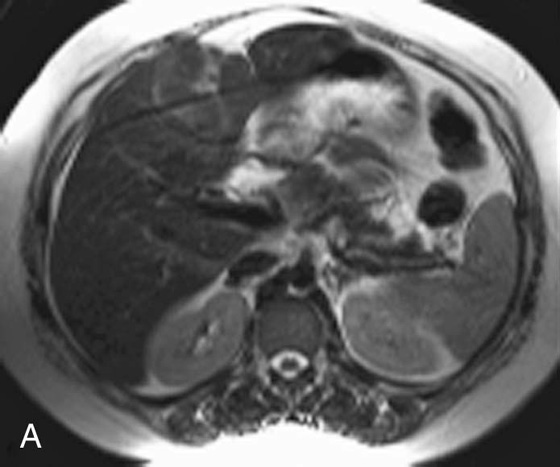
Chapter 6 Phil B. Hoang, Erica Berg, Allen W. Song, and Elmar M. Merkle 1. What weighting are these two images? 2. What is the normal signal intensity of fat on T2W FSE sequences? 3. What soft tissue was purposely suppressed in the image on the bottom? 4. We used STIR instead of FSFS in this instance. Why do you think this was done? 5. The patient had a history of trauma; what is the diagnosis? FIGURE 1A. Sagittal T2-weighted (T2W) fast spin echo (FSE) image of the cervical spine demonstrates mild height loss of the C5 vertebral body and high T2 signal in the prevertebral soft tissues. Cervical spinal canal stenosis is noted at this level with possible mild high T2 signal within the cord. FIGURE 1B. Sagittal short tau inversion recovery (STIR) image at the same level. Prevertebral edema is more conspicuous, with edema now evident in the C5, C6, and C7 vertebral bodies. Persistent, abnormal high signal intensity of the posterior soft tissues is consistent with ligamentous injury. Possible mild high T2 signal in the spinal cord at this level is confirmed on the STIR. 1. Both of these images are T2 weighted. 2. Fat is high in signal on T2-weighted (T2W) fast spin echo (FSE) images. 3. Fat was purposely suppressed on these images. 4. Short tau inversion recovery (STIR) was used to avoid incomplete fat suppression, which occurs in the frequency-selective fat saturation (FSFS) technique due to the magnetic field inhomogeneities from the asymmetric tissues of the posterior neck. 5. The diagnosis is compression fractures of C5 to C7 with cord contusion and ligamentous injury. The high signal intensity of fat on T2-weighted (T2W) fast spin echo (FSE) sequences may obscure both osseous and soft tissue edema. Utilization of a fat suppression technique (see Fig. 1B) is necessary to reveal the urgent abnormalities in this case. Because of its ability to both suppress fat and increase the conspicuity of edema, short tau inversion recovery (STIR) was the preferred fat suppression technique. Inversion recovery belongs to the family of preparatory pulse sequences. Chapter 5 reviewed both frequency-selective and spatial-selective presaturation pulses, and this chapter reviews inversion recovery. While the use of a preparatory pulse in inversion recovery is similar to frequency-selective techniques, the principle behind the desired signal nulling is different. Inversion recovery deploys a nonspecific preparatory pulse, which affects all protons and relies on different longitudinal recovery rates of different tissues to reach the desired signal nulling effect. The preparatory pulse is often a 180° inversion pulse. All protons are flipped in polarity, going from positive (+Mz) to negative (−Mz) magnetization. Protons will begin to recover their net (+Mz) longitudinal magnetization as determined by their specific T1 relaxation times (Fig. 1). Tissue-specific T1 recovery times form the basis for inversion recovery and enable signal suppression (or nulling) depending on the parameter selected; the most common tissues targeted are fat, cerebrospinal fluid (CSF), and myocardium. The null point is the position in time following the inversion preparatory pulse when the targeted protons produce minimal signal, and occurs when the tissue has recovered its equilibrium magnetization to the zero value. The interval between the administration of the inversion pulse and the excitation pulse is known as the time to inversion (TI). The TI to null a particular proton pool can be calculated with the following formula: 0.693 × T1, with T1 being the longitudinal relaxation time of that particular proton pool. At 1.5T, the radiofrequency (RF) pulse is sent at 175 msec to suppress fat, and is somewhere between 2000 and 2500 msec for CSF. Since T1 relaxation times prolong with increasing magnetic field strengths, inversion times will also prolong. Two inversion recovery techniques are in common clinical use and are primarily discussed in this chapter. The first is short T1 (or tau) inversion recovery (STIR), and the second is fluid-attenuation inversion recovery (FLAIR). Inversion recovery used in cardiac imaging is also briefly discussed. STIR is used to both suppress the signal from fat and to increase contrast in tissues exhibiting long T1 relaxation and T2 decay times. Contrast in STIR has been described as the “inverse” of T1, as tissues low in signal intensity on T1W sequences are correspondingly high in signal intensity on STIR. In the setting of magnetic field inhomogeneities and low field strengths, STIR is preferred over frequency-selective saturation for fat suppression. While STIR provides homogeneous fat suppression, it does so nonspecifically. As an unintended consequence, any tissue that exhibits a T1 relaxation time similar to fat will also suppress. FLAIR is a staple in neuroimaging. The inversion time is set to eliminate signal from free water and simple fluids (i.e., CSF). Because of the long T1 relaxation time of free water, the TI is longer than what is used in STIR and is typically in the range of 2000 to 2500 msec at 1.5T. Nulling CSF signal improves lesion-parenchyma contrast, most notably for lesions within the CSF itself and lesions at the CSF-brain border. FLAIR is particularly important for depicting lesions that do not enhance following gadolinium administration. FLAIR techniques can also be applied on T1-weighted (T1W) imaging, which has been utilized to accentuate faintly enhancing central nervous system lesions and to improve gray-white differentiation. Cardiac imaging makes extensive use of inversion recovery to obtain the desired myocardial and vascular contrast. In the evaluation of myocardial viability, normal myocardial signal nulling improves detection of enhancing scar tissue. Inversion recovery uses two 180° inversion preparatory pulses to null signal from flowing blood; specifically, the first preparatory pulse nonselectively inverts all protons, while the second selectively inverts protons within the image slice, so that these protons are now back in equilibrium magnetization. This produces “black blood” images; this topic is further discussed in Chapter 10. FIGURE 2A. Sagittal T2W FSE image of the upper cervical canal demonstrates areas of abnormal hyperintense signal involving the end plates adjacent to the C3/C4 disc (arrowheads). There is also adjacent prevertebral soft tissue swelling and high-intensity signal (arrows). FIGURE 2B. Sagittal STIR image at the same level demonstrates increased conspicuity of the end plate and disc signal abnormalities (arrowhead). More diffuse high signal involving the C3 and C4 vertebral bodies is now evident. Compare the signal intensity of the prevertebral soft tissue swelling (arrows) to that in A. Discitis-osteomyelitis. The abnormal high-signal edema of the C3 and C4 vertebral bodies is more conspicuous on STIR because the normal high signal from bone marrow is suppressed; note the low signal within the normal C2 and C5 vertebral bodies on the STIR image due to suppression of yellow marrow (see Fig. 2B). The prevertebral soft tissue swelling is also more striking on the STIR image. This case illustrates an important point about STIR; tissues with long T1 relaxation times, such as the prevertebral soft tissue edema in Case 2, will produce hyperintense signal, and tissues exhibiting short T1 (fat) will be low in signal. This pattern is the opposite of that seen in conventional T1W images, and is the reason why the contrast in STIR is referred to as the inverse of T1. Following the 180° inversion pulse, fat recovers its equilibrium longitudinal magnetization faster than tissues with longer T1 times. Once fat recovers to its null point, the excitation pulse is sent, rendering the fat unable to produce signal. The majority of protons in tissues with longer T1 times remain inverted, yet maintain a large vector with respect to their null points. In STIR, signal intensity depends on the magnitude (and not polarity) of the protons’ longitudinal vector. In other words, it does not matter if the protons are pointing north (+Mz) or south (−Mz); rather, it is how far and how many of those protons are pointing north or south in relation to their respective null points that determines the signal intensity. The size of the protons’ longitudinal vector influences signal intensity, not the direction of the protons (Fig. 2). FIGURE 3A. Coronal STIR image of the knee. High-signal marrow edema is identified in the medial tibial plateau and medial femoral condyle. Fraying of the lateral meniscus free edge represents a degenerative radial tear. FIGURE 3B. Coronal T2W FSE image at the same position. The edema is largely obscured by the high-signal-intensity marrow. Bone marrow edema. As mentioned in the Chapter 2, fat is high in signal intensity on a T2W FSE image. This is because of the use of multiple 180° refocusing pulses, which disturbs J-coupling effects normally seen in conventional T2W-spin echo sequences. As you recall, J-coupling refers to the spin-spin coupling of atomic nuclei in lipid molecules that results in shortening of T2 relaxation. This interruption of J-coupling affects the spin-spin interaction in fat, resulting in T2 prolongation and high signal intensity on a T2W sequence. This can become problematic when evaluating bone marrow, where high-T2-signal edema may be masked by the similarly high-signal-intensity fat. In this setting, the use of fat suppression becomes a necessity. The benefit of fat suppression was previously illustrated in Cases 1 and 2; Case 3 demonstrates how high marrow signal on the T2W FSE image (see Fig. 3B) virtually obscures the edema in the medial knee, which was clearly depicted on the corresponding STIR image (see Fig. 3A). Fat suppression using a frequency-selective fat saturation (FSFS) technique would have been just as effective in depicting the edema in Case 3 … if only this study has been done at a higher main magnetic field strength (Case 3 was performed on a 0.6T magnet). Recall that the resonant frequencies of water and lipid protons are very similar at lower magnetic field strengths, resulting in a small chemical shift (approximately 74 Hz at 0.5T, 224 Hz at 1.5T, and 448 Hz at 3.0T). Had the narrow-bandwidth saturation pulse used to suppress fat been applied, the water protons precessing within the frequency range of the saturation preparatory pulse would have also been inadvertently suppressed (Fig. 3).1 FIGURE 4A.
Inversion Recovery
CASE 1

ANSWERS
CASE 1
Discussion
Preparatory Pulses Part II: Inversion Recovery
CASE 2
Diagnosis:
Discussion
CASE 3
Diagnosis:
Discussion
CASE 4
Related posts:
![]()
Stay updated, free articles. Join our Telegram channel

Full access? Get Clinical Tree


Recovery