The imaging of rectal cancer has evolved noticeably over the past 2 decades, paralleling the advances in therapy. The methods for imaging rectal cancer are increasingly used in clinical practice with the purpose of helping to detect, characterize and stage rectal cancer. In this setting, MR imaging emerged as the most useful imaging method for primary staging of rectal cancer; the present review focuses on the role of MR imaging in this regard.
Key points
- •
Primary staging by MR imaging is the cornerstone for decisions on the administration of neoadjuvant therapy and on the surgical procedure of choice in rectal cancer.
- •
Routine MR protocol should include high-resolution T2-weighted sequences in 3 planes and a diffusion-weighted sequence with high b-value.
- •
MR imaging assesses prognostic factors such as depth of tumor invasion into and beyond the rectal wall, the presence lymph node metastases, extramural venous invasion, involvement of the mesorectal fascia, and invasion of the peritoneum.
Introduction
The prognosis of rectal cancer is strongly related to several factors that include the depth of tumor invasion into and beyond the bowel wall, the number of lymph nodes involved with tumor, extramural venous invasion (EMVI), involvement of the mesorectal fascia (MRF), and the invasion of the peritoneum. Accurate preoperative assessment of these prognostic factors is fundamental for selecting patients for neoadjuvant therapy and planning surgical approach to optimize complete excision.
To improve patient selection for individually tailored therapies, accurate imaging techniques, able to differentiate early stage tumors from advanced tumors, are warranted. Several modalities have been used in the preoperative evaluation of rectal cancer, including endorectal ultrasound, computed tomography scans, and MR imaging. However, a recent consensus paper stated that MR imaging should be the first-choice examination for primary staging of rectal cancer. Because primary staging MR imaging needs to be as accurate as possible, the European Society of Gastrointestinal and Abdominal Radiology published a consensus paper on MR imaging for the clinical management of rectal cancer, which was recently updated, with the aim of defining a state-of-the-art MR protocol for rectal cancer and how imaging findings should be interpreted and reported.
Technical notes and protocol
MR imaging for staging rectal cancer should be performed with an external surface coil on a 1.5 T or 3.0 T MR imaging system. No consensus exists regarding the use of spasmolytics or endorectal filling for staging MR imaging examinations. Spasmolytics can be beneficial for upper rectal tumors and when imaging is performed at 3.0 T, because in these cases bowel movement artifacts are most prevalent. Endorectal filling can reduce susceptibility artifacts related to luminal gas during diffusion-weighted imaging (DWI). However, its use cannot be recommended, because rectal wall distension may interfere with interpretation of the distance between the tumor and the MRF. Another potential drawback of rectal filling is that the high T2 signal of the gel may originate shine-through effects on DWI. A potential alternative is the use of a microenema to reduce the amount of luminal gas.
The protocol should include 2-dimensional high-resolution T2-weighted sequences in 3 planes. The axial and coronal images should be angulated ( Fig. 1 ), respectively, perpendicular and parallel to the long axis of the lesion and the slice thickness should be 3 mm or greater. For low rectal cancers, images axial and coronal to the anal canal may be helpful in defining invasion of the sphincteric complex. A DWI sequence (including at least a high b-value of ≥800) should be also included even if there is no evident benefit for DWI at primary staging, but because DWI improves the response assessment after CRT. Fat-suppressed, T1-weighted and dynamic contrast-enhanced sequences are not routinely recommended because they offer no additional benefits.

Early cancers considered for local excision should be evaluated by (additional) endorectal ultrasound, given its superior diagnostic performance for differentiating T1 from T2 tumors.
Mesorectal fascia status
Some authors suggest that CRM status, in combination with nodal status, yields a better prognostic model than the TNM system. Recently, it was reported that the CRM status is superior to the TNM system for assessing the risk of local recurrence, disease-free survival and overall survival.
Addressing accurately the relationship between the tumor and the MRF, which determines the status of the circumferential resection margin (CRM), because the MRF corresponds with the dissection plane in total mesorectal surgery, is probably the most important task that MR imaging has to fulfill ( Fig. 2 ). Because sometimes staging (particularly T staging and specifically the differentiation between T2 and T3 tumors) will not noticeably change the overall preoperative or operative management of the patients, the clinically pertinent benefit of MR imaging is the assessment of the distance from the tumor to the MRF, which is strongly predictive of local recurrence.

MR imaging provides an accurate information about CRM status. Beets-Tan and colleagues reported that the prediction of MRF involvement was addressed with excellent interobserver agreement, allowing an MR imaging disease-free distance of 5 and 6 mm to correspond with a histopathologic disease-free margin of 1 and 2 mm, respectively. Another study confirmed a high accuracy (95%) for prediction of CRM status. Brown and colleagues showed a 92% agreement between MR images and histologic findings for prediction of the CRM.
A recent study showed that a margin of 1 mm or less measured by MR imaging correlated accurately with pathologic CRM involvement and poor outcome. The rate of pathologic CRM positivity was 53% in the group with a margin of 1 mm or less defined by MR imaging, and decreased to 7% to 8% when the tumor distance to the MRF was greater than 1 mm but no more than 5 mm. The 5-year local recurrence rate for patients with CRM-positive disease on MR imaging using a cut-off 1 mm or less was 20%, compared with 4% to 8% in those with larger margins.
Recently, the European Society of Gastrointestinal and Abdominal Radiology consensus paper proposed that the MRF is involved if the distance between MRF and tumor is 1 mm or less, threatened if that distance is between 1 mm and 2 mm, and free if greater than 2 mm ( Fig. 3 ).

T staging
Preoperative T staging of rectal cancer by imaging is a complex task. Even if the present T-staging system is sometimes used for clinical decision making, it does not discriminate between tumors with a wide CRM and tumors with a threatened or involved CRM. Although many of these tumors are classified in the same stage (T3), they have a wholly different risk for local recurrence.
The accuracy for T staging is not as high as desirable, varying between 65% and 86% and was not as reproducible as expected, with considerable interobserver variability. One exception to the above was shown by Brown and colleagues, who reported 100% accuracy and complete agreement between 2 readers on the assessment of tumor stage.
Important MR imaging criteria relevant for T staging are summarized, according to Brown and colleagues, as follows:
- •
Stage T1: low signal in the submucosa and replacement of the submucosal layer by abnormal signal not extending into the muscle coat
- •
Stage T2: intermediate signal within the muscularis propria
- •
Stage T3: broad-based bulge or nodular projection or intermediate signal projecting beyond outer muscle coat
- •
Stage T4: extension of abnormal signal into adjacent organ or through the peritoneal reflection
Therefore, the outer margin of the muscularis propria will remain intact with stage T2 tumors or less, whereas it will be disrupted in T3 disease ( Fig. 4 ).

Nevertheless, most staging failures with MR imaging occur in the distinction between T2 stage and borderline T3 stage lesions, with overstaging caused by desmoplastic reaction surrounding the lesions, because it is difficult to distinguish between spiculation in the perirectal fat caused by fibrosis alone (T2) and spiculation caused by fibrosis that contains tumor (T3). Underestimation is less frequent and generally related to microscopic invasion of the mesorectal fat ( Fig. 5 ).

However, differentiating between minimal T3 infiltration and T2 lesions is probably of little consequence for patient management, because patients with minimal T3 infiltration into the mesorectal fat are also at low risk of surgical failure from CRM involvement.
Conversely, the depth of tumor invasion is known to be an important prognostic factor, and the prognostic heterogeneity of T3 disease has been recognized previously. In the Erlangen Registry of Colorectal Carcinomas, patients with cancer invading beyond the border of the muscularis propria by 5 mm or less had a significantly more favorable prognosis than those with invasion of more than 5 mm regarding local recurrence and cancer-related survival. Also, some pT3 patients had results like pT2 patients: for node-negative pT3 patients with invasion beyond the muscularis propria of 5 mm or less of and for node-negative pT2 patients, the local recurrence rates were 10% and 9%, with 5-year survival rates of 91% and 94%, respectively.
Perhaps more important than defining the exact T3 substage based in the depth of invasion beyond the muscularis propria (T3a: <1 mm; T3b: 1–5 mm; T3c: 6–15 mm; T3d: >15 mm), is to differentiate tumors that, generally, could be approached primarily by surgery (T3a-b disease) from more advanced tumors (T3c-d disease) that should undergo preoperative (chemo)radiation therapy ( Fig. 6 ).

Stage T4 tumors are diagnosed by demonstrating infiltration into the peritoneal reflection (T4a) or adjacent organs (T4b) ( Fig. 7 ).

N staging
Nodal disease is a powerful prognostic indicator. In the Dutch total mesorectal trial, patients with stage III (TxN1) disease had a 10-fold higher risk for local recurrence than did those with stage I (T1–2N0 stage) disease and a 3-fold higher risk than did those with stage II (T3N0 stage) disease. Additionally, patients with stage N2 disease have a significantly higher risk of local recurrence compared with those with N0 or N1 disease.
Rectal cancer most frequently spreads to the mesorectal lymph nodes, and, to a lesser degree, along the superior rectal artery. Most mesorectal nodes are found at the level of the primary tumor. The likelihood of nodal metastases increases with the T stage of the tumor, occurring in up to 50% of patients with stage T4 disease.
Lateral pelvic sidewall nodal dissemination occurs in 10% to 25% of patients with rectal cancer, more often in low cancers. Involved sidewall nodes increase the risk of systemic dissemination. Predictably, the 5-year survival in patients with pelvic sidewall node metastases is low (25%–42%). Because pelvic sidewall nodes are not routinely removed during total mesorectal surgery, extended lymphadenectomy may be needed.
Only approximately 65% of mesorectal nodes found on histopathology can be identified on MR imaging. Despite the identification of nodes as small as 2 to 3 mm, reliable detection of nodal metastases on MR imaging is currently not possible. The dilemma with enlarged nodes is to discriminate between reactive and metastatic nodes, and with small nodes micrometastases are easily missed.
There has been limited success in the application of size criteria to characterize nodal disease, mainly because mesorectal nodes, whether benign or malignant, tend to be small. In a study of 424 surgical specimens containing 12,759 nodes, the mean nodal diameter was 3.34 mm and the mean diameter of metastasis was 3.84 mm.
Moreover, there is no consensus on the size criterion for prediction of metastatic nodes. In previous studies, MR imaging size criteria were variable, ranging from any detectable node to nodes more than 1 cm. A higher cutoff value yields high specificity but low sensitivity, whereas the reverse is true if a smaller cutoff is used. The citations of long or short axis diameter were also unclear in most articles and the accuracy ranged widely (43%–85%).
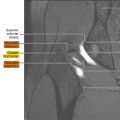
The borders and the signal characteristics of nodes on MR imaging seem more accurate than size in discriminating between benign and malignant nodes. These are round-shaped, show irregular borders or display heterogeneous signal on T2-weighted images ( Fig. 8 ).


