Renal, Bladder, and Adrenal Ultrasound
Imaging Technique
Kidneys
A renal US examination typically includes sonography of both kidneys, the perirenal areas, the aorta, inferior vena cava (IVC), and the urinary bladder. The American Institute of Ultrasound in Medicine provides guidelines for a satisfactory examination [1]. A sector or curved array transducer using frequencies between 2.25 and 5.0 MHz is recommended. The right kidney is examined from an anterolateral or direct lateral approach with the patient supine or in left lateral decubitus position, using the right lobe of the liver as a sonographic window. The left kidney is often more difficult to visualize because the spleen provides a more limited sonographic window. The left kidney is often obscured by bowel when scanned from the anterior abdomen. Placing the patient in right lateral decubitus position provides access to a more lateral and posterior approach through the spleen and psoas muscle. Multiple images of both kidneys are documented in longitudinal and transverse planes including the upper pole, middle section, and lower pole. Maximum renal lengths are recorded. Renal volumes may be calculated by measuring transverse and anteroposterior (AP) diameters from a mid-kidney transverse image. The standard formula (volume = length × width × AP diameter × 0.52) is utilized. The bladder lumen, wall thickness, and mucosal surface are documented. The retroperitoneum is examined for ureteral dilatation, adenopathy, or other abnormality.
Bladder
For US examination, the bladder should be moderately distended to stretch the wall and to better visualize the mucosal surface and bladder lumen. Images are obtained in transverse and longitudinal planes. Attention should be directed to the trigone area, ureteral orifices,
and prostate gland. Transvaginal scanning will improve evaluation of the bladder in women. Large cystic pelvic masses may be mistaken for the bladder. When this is suspected, the bladder should be emptied by voiding or Foley catheter and rescanned.
and prostate gland. Transvaginal scanning will improve evaluation of the bladder in women. Large cystic pelvic masses may be mistaken for the bladder. When this is suspected, the bladder should be emptied by voiding or Foley catheter and rescanned.
Adrenal Glands
Although small and tucked away in the retroperitoneum normal and abnormal adrenal glands can be visualized by US in most patients with a little effort and attention to anatomic landmarks. Normal adrenal glands are prominent and easily seen in the third-trimester fetus and the newborn, but require exacting technique to visualize in most adults. Adrenal abnormalities may be detected during routine renal sonography. Careful attention to the location of the adrenal glands is the key to recognizing them on US. The right adrenal gland is truly suprarenal and is best visualized by a posterolateral approach in transverse plane looking for the adrenal gland just above the right kidney, between the liver and right crus of the diaphragm posterior to the IVC as it enters the liver. The left adrenal gland is imaged by a posterolateral approach in coronal plane through the long axis of the left kidney. The left adrenal gland is seen between the upper pole of the left kidney and the aorta. High-resolution, real-time sonography allows visualization of normal adrenal glands in 71-92% of adults [4].
Anatomy
Kidneys
The normal adult kidney is bean-shaped with a smoothly convex, often lobulated, outer border (Fig. 3.1). The kidney is well defined by a thick fibrous capsule outlined by echogenic perirenal fat. This echogenic fat continues into the renal sinus, entering at the anteromedially oriented renal hilum and filling the middle of the kidney. The outer renal cortex is equal to, or slightly less than, the liver and spleen in echogenicity. Renal cortical echogenicity distinctly greater than liver parenchymal echogenicity is highly indicative of impaired renal function [5]. Liver parenchymal echogenicity distinctly greater than renal cortical echogenicity is highly indicative of diffuse hepatocellular fatty infiltration [6]. The cortex that extends centrally into the kidney is called septal cortex as it surrounds and separates the less echogenic medullary pyramids. Fusion of septal cortex from adjacent lobes produces a normal, but often bulbous, mass of cortex referred to as a column of Bertin (see Fig. 3.3) [7]. Distinct differentiation of cortical and medullary echogenicity is a sign of a
normal kidney. In infants up to 24 months of age, the echogenicity of the cortex is significantly greater than the renal cortex in adults and older children (Fig. 3.2). Its echogenicity commonly exceeds liver parenchymal echogenicity. The medullary pyramids remain echolucent and prominent. This appearance has been mistaken for hydronephrosis.
normal kidney. In infants up to 24 months of age, the echogenicity of the cortex is significantly greater than the renal cortex in adults and older children (Fig. 3.2). Its echogenicity commonly exceeds liver parenchymal echogenicity. The medullary pyramids remain echolucent and prominent. This appearance has been mistaken for hydronephrosis.
 Figure 3.1 Normal Adult Kidney. The renal cortex (short arrow) is equal in echogenicity to the liver parenchyma (l). The renal pyramids (long arrow) are slightly hypoechoic compared to the renal cortex. The septal cortex extends between the medullary pyramids. The central renal sinus (s) is invested with echogenic fat. The contour of the kidney is sharply defined by fat in the perirenal space. The length of the kidney is measured between cursors (+). |
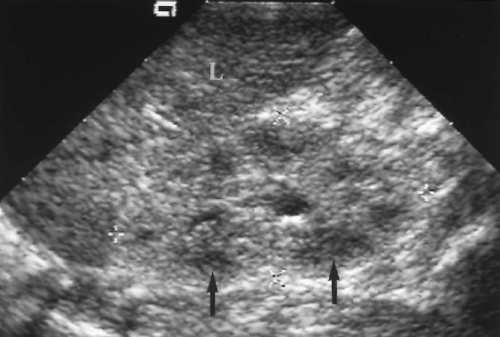 Figure 3.2 Normal Newborn Infant Kidney. Longitudinal view of the normal right kidney (between cursors, +, x) of a newborn infant demonstrates echogenicity of the cortex to be slightly greater than the echogenicity of the liver (L). The medulla (arrows) is significantly less echogenic. |
Persistent fetal lobation is a common renal anatomic variant [8]. The normal kidney is made up of 12-18 separate lobes consisting of a medullary pyramid surrounded by subcapsular and septal cortex [9]. A single lobe drains into a simple calyx. When several lobes drain into a single calyx, the calyx is considered to be a compound calyx. The fetal lobes act as tiny independent kidneys early in fetal life but progressively fuse into a single kidney with maturation. Incomplete lobular fusion is common and results in V-shaped indentations on the renal surface (Fig. 3.3). A prominent indentation between the upper and lower portion of the kidney has been called the junctional defect [7]. These normal V-shaped defects should not be mistaken for parenchymal scars.
Calyces unite to form the renal pelvis, which exits the renal sinus at the hilum. The calyces and pelvis are usually collapsed and are not seen as discrete structures within the renal sinus. When patients are well hydrated, high urine output causes mild normal dilatation of the calyces and pelvis. The renal pelvis may also be seen as a prominent fluid-filled structure when it is “extrarenal,” that is, primarily outside of the renal sinus. Lower surrounding tissue pressure allows the pelvis to be chronically dilated. These normal variations must be differentiated from hydronephrosis.
The main renal arteries are solitary in 60% of individuals and multiple and smaller in the remainder. The renal arteries arise from the lateral aspects of the aorta approximately 1 cm below the origin of the superior mesenteric artery. The right renal artery passes behind the IVC causing a small but prominent indentation on the posterior wall of the IVC (see Fig. 2.11). The left renal artery has a short direct course to the left kidney. Renal arteries are more commonly multiple when the kidney is malpositioned or malrotated. Supplemental renal arteries may course directly into the polar regions of the kidney without coursing through the renal hilum. Renal veins are usually solitary. The right renal vein is anterior to the right renal artery and courses anterosuperiorly to enter the IVC usually somewhat above the level of the right renal hilum. The left renal vein courses transversely anterior to the aorta to enter the IVC. The left gonadal vein enters the left renal vein just outside the left renal hilum. The right gonadal vein enters the IVC directly just below the junction of right renal vein and IVC.
The Doppler spectrum of the normal renal artery shows continuous forward flow into the kidney with relatively high velocities maintained throughout diastole indicating low intrarenal vascular resistance. Maximum normal peak systolic velocity is 180 cm/sec. Normal resistive index (RI) is below 0.70. The Doppler spectrum of the renal vein shows continuous venous flow with slight respiratory undulation.
Doppler spectra can be obtained from tiny intrarenal arteries (interlobar and arcuate arteries), whether they are actually visualized or not, by placing a Doppler sample volume
at the corticomedullary junction along the borders of the pyramids. The RI, calculated from the spectral display, has diagnostic value in a number of disease states. Like the main renal artery, RI of 0.70 is the upper limit of normal for intrarenal arteries. A number of representative readings should be averaged to determine a single representative value [10].
at the corticomedullary junction along the borders of the pyramids. The RI, calculated from the spectral display, has diagnostic value in a number of disease states. Like the main renal artery, RI of 0.70 is the upper limit of normal for intrarenal arteries. A number of representative readings should be averaged to determine a single representative value [10].
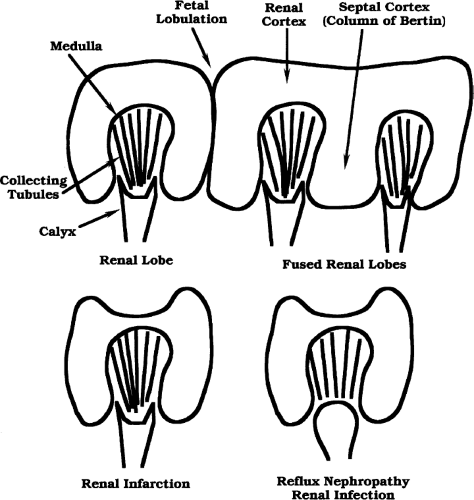 Figure 3.3 Normal Renal Lobes. Line drawing illustrates the basic anatomy of the renal lobes. The normal adult kidney is made up of approximately 14 lobes, which are the basic structural unit of the kidney. Each lobe resembles a kernel of corn and consists of subcapsular and septal cortex containing glomeruli and a central medulla (medullary pyramid) containing collecting tubules and portions of the loops of Henle. The collecting tubules drain urine into calyces. Lack of complete fusion of the renal lobes results in fetal lobulation with a V-shaped defect on the capsular surface marking the junction of the lobes. Fusion of the lobes results in a smooth capsular surface. A column of Bertin refers to fusion of the septal cortex of two adjacent lobes. A prominent column of Bertin may be mistaken for a renal mass. The junctional defect is a prominent V-shaped defect in the cortical surface that marks the junction of lobes from the upper pole with lobes of the lower pole. Renal parenchymal scarring, occurring as a result of infarction, reflux nephropathy, or renal infection, produces a U-shaped defect that overlies the calyx. The calyx underlying the parenchymal scar is normal in shape with infarction but is blunted as a result of reflux nephropathy or recurrent infection. |
Characteristics of the normal kidney are summarized in Table 3.1.
Bladder
The exact shape and appearance of the bladder varies with the degree of distension. When empty or nearly empty, the bladder wall is thick and somewhat irregular due to contraction of the wall musculature and wrinkling of the mucosa. With filling, the wall thins and the mucosa flattens to a smooth, well-defined surface. The normal bladder wall does not exceed 4 mm in thickness when the bladder is distended. The trigone is defined by the slight protuberances of the ureteral orifices and the more inferior urethral opening. The ureteral orifices are most easily located by identifying ureteral jets. Periodic ureteral peristalsis (average rate, 6 waves per minute) squirts jets of urine into the bladder lumen. These jets are seen on gray-scale US as tiny streams of microbubbles, and on color flow US as flashes of color projecting into the bladder lumen (Fig. 3.4) [11]. The urethral orifice is seen as a slight V-shaped depression at the bladder base. Enlargement of the prostate elevates the bladder base. Postvoid bladder volume does not normally exceed 22 mL. Normal
urine is anechoic. Reverberation artifact commonly projects into the bladder from the anterior bladder wall. Residual urine after voiding is quantified by the standard formula: volume = width × height × length × 0.52 (Table 3.2).
urine is anechoic. Reverberation artifact commonly projects into the bladder from the anterior bladder wall. Residual urine after voiding is quantified by the standard formula: volume = width × height × length × 0.52 (Table 3.2).
Table 3.1: US Characteristics of Normal Kidneys | |||||||||||||||||
|---|---|---|---|---|---|---|---|---|---|---|---|---|---|---|---|---|---|
|
Adrenal glands
Adrenal glands are composed of cortex and medulla, which have different embryologic origin, function, and US appearance. The cortex secretes the steroid hormones cortisol, androgens, and aldosterone, whereas the medulla secretes catecholamines. The cortex is hypoechoic to liver parenchyma, whereas the medulla is near isoechoic with fat (Fig. 3.5).
Adrenal glands are relatively larger in the fetus and newborn because of the presence of the prominent fetal cortex that atrophies by 1 of year of age.
Adrenal glands are relatively larger in the fetus and newborn because of the presence of the prominent fetal cortex that atrophies by 1 of year of age.
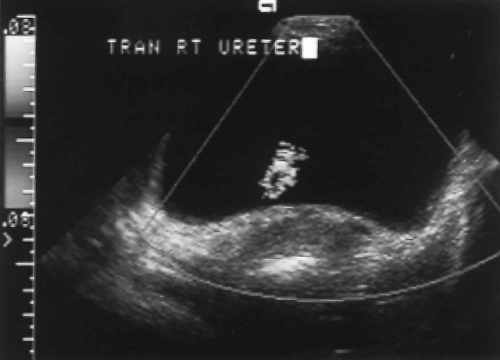 Figure 3.4 Normal Ureteral Jet. Ureteral peristalsis produces a flash of color as urine squirts into the bladder lumen (see Color Figure 3.4). |
Table 3.2: US Characteristics of Normal Bladder | ||||||||||||||||
|---|---|---|---|---|---|---|---|---|---|---|---|---|---|---|---|---|
|
Kidneys
Congenital Anomalies
Horseshoe Kidney
Horseshoe kidney describes the appearance of congenital fusion of the lower poles of both kidneys [12]. This is the most common renal fusion anomaly with a prevalence of 1:400
individuals. One-third of affected patients have additional congenital anomalies. Horseshoe kidneys are prone to urinary stasis, infection, calculus formation, hydronephrosis, vesicoureteral reflux, anomalous blood supply, and have increased susceptibility to traumatic injury.
individuals. One-third of affected patients have additional congenital anomalies. Horseshoe kidneys are prone to urinary stasis, infection, calculus formation, hydronephrosis, vesicoureteral reflux, anomalous blood supply, and have increased susceptibility to traumatic injury.
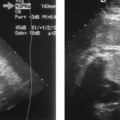
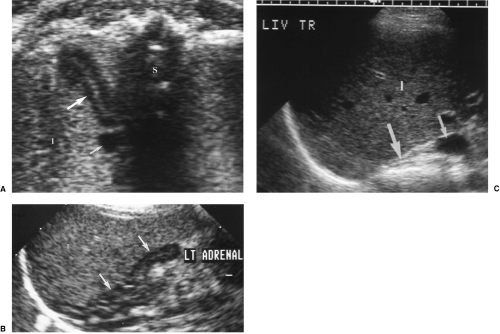 Figure 3.5 Normal Adrenal Glands. US images show the normal adrenal glands (long arrows) in the fetus at 35 weeks (A), the newborn (B), and the adult (C). The cortex is hypoechoic and the medulla is echogenic. The short arrows indicate the inferior vena cava. l, liver; S, fetal spine. |
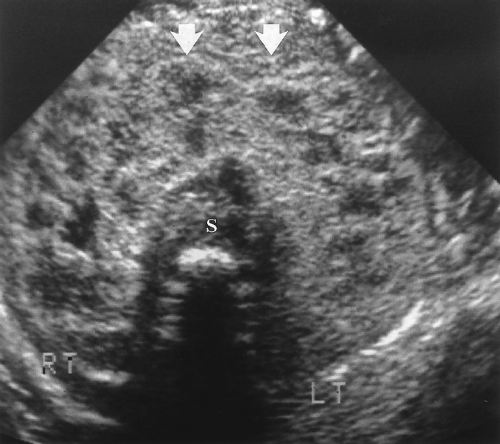 Figure 3.6 Horseshoe Kidney in an Infant. Transverse image shows the fusion (arrows) of the two kidneys (RT, LT) anterior to the spine (S). |
The key to US diagnosis is demonstration of the isthmus connecting the kidneys across the midline (Figs. 3.6, 3.7) [12]. The isthmus crosses the midline anterior to the IVC and aorta just below the origin of the inferior mesenteric artery. The isthmus may be functioning renal parenchyma with echogenicity identical to the kidney or it may be thinner and more echogenic fibrous tissue. In 15% of cases, the isthmus may not be demonstrable by US.
The kidneys are low in position because the isthmus encounters the inferior mesenteric artery stopping the normal ascent of the kidneys. A definitive sign of low position is the left kidney lying caudal to the inferior tip of the spleen.
The long axes of the kidneys are reversed with the lower poles positioned closer together than the upper poles. The kidneys appear curved or bent and the lower poles are ill defined, narrowed, and elongated (Fig. 3.7). The lower poles of the kidneys are not defined on routine longitudinal images. The orientation of the renal pelvis is anterior rather than anteromedial.
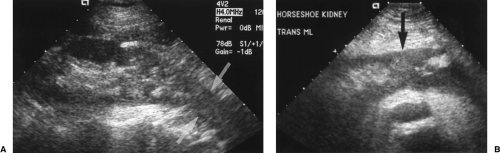 Figure 3.7 Horseshoe Kidney in an Adult. A. Longitudinal image of the left kidney shows elongation of the lower pole (arrows) without visualization of its lower margin. B. Transverse image over the spine shows the connection of the lower poles (arrow) of both kidneys. |
Collecting System Duplication
Duplication of the collecting system is the most common congenital anomaly of the urinary tract. Duplication is complete when two separate ureters drain separate portions of one kidney. This anomaly is associated with ureteroceles, obstruction, and reflux. Incomplete duplication ranges from a bifid renal pelvis to duplex ureters that join before entering the bladder through a single orifice. Because non-dilated ureters are seldom demonstrated by US, precise classification is not often possible by US alone.
Two central echogenic sinuses separated by a band of parenchyma suggest some degree of collecting system duplication, statistically most often a bifid pelvis without ureteral duplication.
With complete duplication, the ureter draining the lower pole collecting system inserts in the normal location at the bladder trigone. The ureter draining the upper pole collecting system always inserts lower and medial to the orifice of the lower pole system. This ectopic location, sometimes outside of the bladder in the prostate or vagina, often results in ureteral obstruction and formation of an ectopic ureterocele. The ectopic ureterocele may mechanically disrupt the valve mechanism of the lower pole ureteral insertion and result in vesicoureteral reflux (VUR).
Stones and Obstruction
Renal Stone Disease
Urolithiasis has its highest prevalence in men aged 20-40 years. Approximately 12% of men and 5% of women experience renal colic caused by stone disease at least once in their lifetimes. Most renal stone disease is idiopathic.
Both radiopaque and radiolucent calculi produce highly echogenic foci with acoustic shadowing (Fig. 3.8).
US reliably demonstrates stones >5-mm size, but smaller stones are commonly not detected [13]. Up to 40% of the small stones present may be missed [14].
US is inaccurate in measuring stone size.
Calcifications in renal arteries or within tumors must not be mistaken for renal stones.
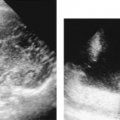
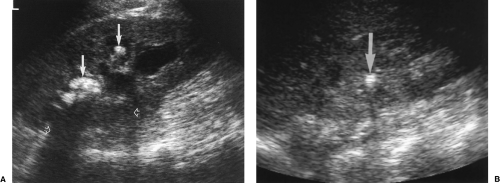 Figure 3.8 Renal Calculi. A. Numerous stones are seen within dilated calyces as echogenic foci (closed arrows) with acoustic shadowing (open arrows). B. Solitary stone produces a bright echogenic focus (arrow) in the renal sinus and casts an acoustic shadow. |
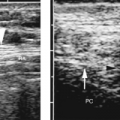
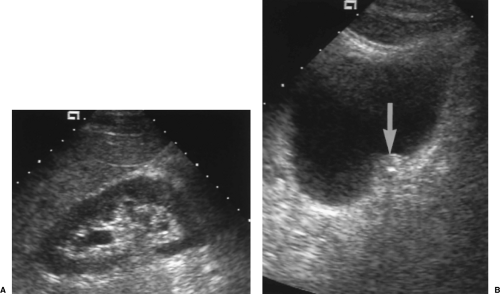 Figure 3.9 Acute Obstruction with Impacted Distal Ureteral Stone. A. Acute obstruction produces minimal dilatation of the renal calyces, although the patient experienced severe pain. B. Longitudinal image of the bladder reveals a swollen uterovesical junction (arrow) with a small impacted stone that shadows. |
A color Doppler “twinkling sign” has been described within or just distal to urinary tract calculi [16]. This appears as a comet tail of alternating bands of red and blue colors. The artifact is useful in identification of calculi and must not be mistaken for blood flow. The artifact is accentuated by increasing Doppler power.
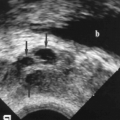
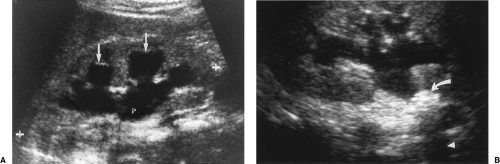 Figure 3.10 Moderate Hydronephrosis. A. Rounded calyces filled with urine (arrows) connect to the fluid distended pelvis (P). Cursors (+) mark the poles of the kidney. B. Hydronephrosis terminates abruptly at a calculus (arrow) impacted at the ureteropelvic junction. Note the acoustic shadow (arrowhead) emanating from the stone. |
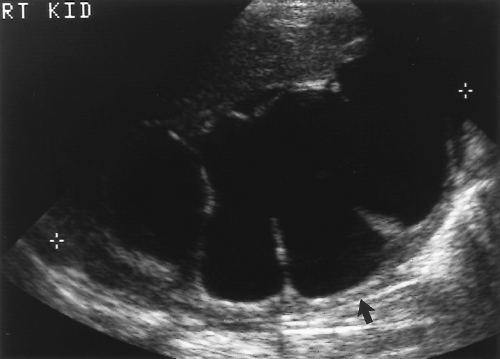 Figure 3.11 Marked Hydronephrosis. The renal collecting system is markedly dilated, and the renal parenchyma is thinned (arrow), indicating long-standing hydronephrosis. The cause of hydronephrosis in this case was diabetes insipidus. Cursors (+) mark the poles of the kidney. |
Hydronephrosis and Obstruction
US demonstration of hydronephrosis is not, by itself, diagnostic of urinary obstruction. Hydronephrosis is an anatomic finding, not a functional one, and is caused by acute and chronic urinary obstruction, VUR, pregnancy, high urine output states (diabetes insipidus), and congenital dilatation of the collecting system (prune belly syndrome). Hydronephrosis may be absent or minimal when obstruction is acute or incomplete (Fig. 3.9), and hydronephrosis may persist for months after obstruction is relieved. Confirmation of functional urinary obstruction must be provided by Doppler US findings, or by additional imaging (intravenous urography, radionuclide studies).
Dilatation of the calyces, pelvis, and ureter constitutes the anatomic finding of hydronephrosis (Fig. 3.10). Calyces appear rounded and cystic and communicate with the renal pelvis. Well-hydrated normal patients may show mild pelvicalyectasis that is accentuated when the bladder is full. Re-imaging after emptying the bladder shows resolution of this normal dilatation.
Pelvicalyceal dilatation is most severe when obstruction is long-standing (Fig. 3.11). Chronic obstruction is often associated with diffuse parenchymal atrophy. Proximal obstruction causes greater dilatation than distal obstruction. Acute obstruction, even when complete, often causes only mild hydronephrosis (Fig. 3.9).
Physiological hydronephrosis is seen in the third trimester of 90% of pregnancies with the right side being more commonly and more severely affected [17].
Parapelvic cysts mimic the US appearance of hydronephrosis (Fig. 3.12). US differentiation is difficult. The correct diagnosis is confirmed most easily by referring to previous imaging studies that show the presence of renal sinus cysts causing compression and attenuation of the collecting system. Clues to US diagnosis include non-uniform size and appearance of the cysts, the presence of uninvolved areas of the renal sinus, and the observation that the parapelvic cyst does not abut the tip of the medullary pyramid.
Extrarenal location of the renal pelvis often results in dilatation of the pelvis without associated dilatation of the calyces or ureter. This is a normal variant that should not be mistaken for pathologic hydronephrosis.
Demonstration of ureteral jets caused by periodic ureteral peristalsis confirms patency of the ureter [11]. Gray scale US shows a stream of low-level echoes extending from the ureteral orifice into the bladder lumen. Color Doppler accentuates detection of this fluid jet (Fig. 3.4).
Absence of a ureteral jet on the affected side during several minutes of observation confirms complete obstruction [11]. This finding is unreliable in pregnancy [18].
Intrarenal artery RI >0.70 is highly suggestive of obstruction, provided (a) technique is adequate and waveform is large enough to be clearly measured; (b) the patient is older than 4-5 years (RI is normally >0.70 in children under 5 years); and (c) significant
medical renal disease is not present. Elevated RI is a more reliable sign of obstruction when the opposite kidney has a normal RI. Obstruction may elevate the intrarenal RI before significant hydronephrosis is present. RI values return to normal after obstruction is relieved, even though pelvicalyectasis may still be present [19].
Pregnancy-induced hydronephrosis does not typically elevate the intrarenal artery RI. RI >0.70 is highly suggestive of obstructing calculus in a symptomatic pregnant patient [20].
Urinary obstruction in the newborn may be overlooked on US examinations performed immediately after birth because of dehydration and limited renal function. Infants with antenatal demonstration of fetal pyelectasis are best evaluated at 4-7 days with the examination repeated at 6 weeks [21].
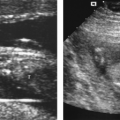
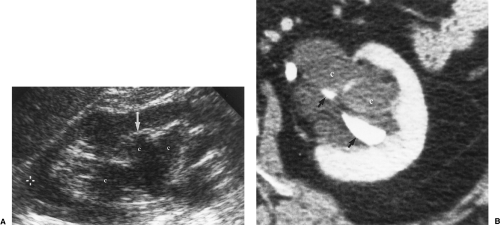 Figure 3.12 Parapelvic Cysts Mimic Hydronephrosis. A. Longitudinal US image shows fluid-filled structures (c) in the renal sinus that mimic dilated calyces and pelvis. Note that the dilated “calyx” is separated from the renal parenchyma by a layer of echogenic fat (arrow). Compare to the images in Figure 3.10. True dilated calyces directly abut the tip of the medullary pyramid. Cursor (+) marks the upper pole of the kidney. B. CT scan shows the parapelvic cysts (c), which compress the contrast-filled collecting system (arrows). |
Vesicoureteral Reflux and Reflux Nephropathy
VUR is a common problem of childhood associated with frequent urinary tract infections and progressive renal damage if untreated. VUR is seen in adults with neurogenic bladders and bladder outlet obstruction.
VCUG (voiding cystourethrography) is the imaging method of choice for demonstration of VUR. A normal renal US does not exclude VUR [22].
VUR is a common cause of fetal and neonatal hydronephrosis. Intermittent, waxing and waning hydronephrosis seen over several minutes of observation suggests VUR [23]. The condition may be unilateral or bilateral.
Findings of reflux nephropathy include focal renal parenchymal scarring, usually most prominent at the upper pole with associated dilatation of the underlying calyx (see Fig. 3.40). The renal pelvis is spared. Chronic infection progressively scars the kidney and impairs renal growth.
Serial renal length measurement is a sensitive method of monitoring renal growth in children with VUR [24].
 Figure 3.13 Echogenic End-Stage Kidney. The kidney (between cursors, +) is significantly more echogenic than the adjacent liver parenchyma (l). Differentiation of cortex from medulla, and even from the renal sinus, is lost. The kidney is small, measuring only 7 cm, indicating it is end stage and unlikely to respond to any form of therapy. The patient has chronic renal failure. |
Diffuse Renal Parenchymal Disease
Renal Failure
In the clinical setting of impaired renal function, US is used to demonstrate the size and appearance of the kidneys and to detect the rare occurrence of bilateral obstruction presenting with renal failure. US diagnosis of a specific cause of renal failure is exceedingly rare [25].
Diffuse increased echogenicity of the parenchyma of both kidneys is the US hallmark of diffuse renal parenchymal disease (Fig. 3.13). Corticomedullary differentiation is usually absent.
End stage kidneys are small and echogenic (Fig. 3.13).
US is commonly used to guide renal biopsy to provide a specific diagnosis and identify a hopefully treatable cause of renal failure. Kidneys smaller than 9 cm in length in adults are usually end-stage kidneys unresponsive to treatment [25,26]. Biopsy is seldom beneficial to these patients.
An extracapsular rim of perirenal lucency (“kidney sweat”) has been described in 14% of patients with renal failure [27]. The significance of this finding is unknown.
Diabetic Nephropathy
Diabetes mellitus is the most common cause of chronic renal failure in the United States. Patients develop proteinuria, hypertension, and progressive renal failure over the course of their disease.
Bilateral renal enlargement (>13 cm length) with normal parenchymal echogenicity is seen early in the course of disease [28].
With time the kidneys shrink, become diffusely echogenic, and show high (>0.70) intrarenal artery RI.
Human Immunodeficiency Virus-Associated Nephropathy
Nephropathy associated with human immunodeficiency virus (HIV) infection is an important cause of AIDS morbidity. Patients present with rapid deterioration of renal function and proteinuria [29].
Additional findings include a globular appearance to the kidney, decreased renal sinus fat, and heterogeneous parenchyma with echogenic striations [29].
 Figure 3.14 HIV-Associated Nephropathy. The renal parenchyma (between cursors, +) is distinctly more echogenic than the liver parenchyma (l). The renal sinus (s) lacks echogenic fat. Both kidneys measured large (15 cm). These findings are characteristic of HIV nephropathy. |
Echogenic Renal Pyramids
Increased echogenicity of the medullary pyramids is usually a non-specific finding of metabolic disease. Nephrocalcinosis is the most common cause, but numerous other diseases may cause this finding (Table 3.3) [31].
Echogenicity of the renal pyramids exceeds the echogenicity of the renal cortex (Fig. 3.15). The condition is bilateral. Acoustic shadowing is usually absent. Renal cortical echogenicity is normal.
Renal Tumors
Renal Cell Carcinoma
Renal cell carcinoma (RCC) accounts for 90% of solid renal tumors. When a solid renal mass is encountered, the US examination should be extended to examine the retroperitoneum for nodal metastases and should utilize Doppler to look for extension of tumor into the renal vein or IVC. The tumor is often clinically silent until it becomes large. Small “incidental” RCC may be discovered by routine renal US [32].
Table 3.3: Causes of Increased Echogenicity of the Renal Pyramids | |||||||||||||||||||||||||||||||||
|---|---|---|---|---|---|---|---|---|---|---|---|---|---|---|---|---|---|---|---|---|---|---|---|---|---|---|---|---|---|---|---|---|---|
|
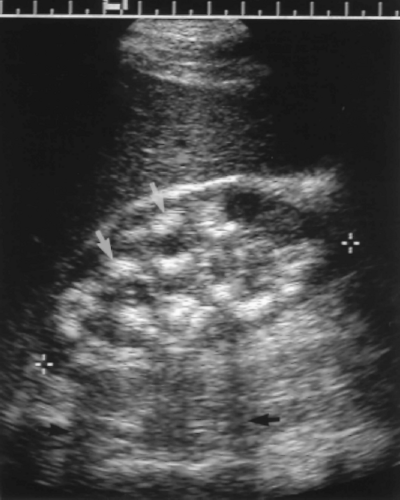 Figure 3.15 Echogenic Renal Pyramids. The renal pyramids (white arrows) are markedly echogenic (instead of echolucent). Acoustic shadows (black arrows) emanate from some of the pyramids in this case of medullary nephrocalcinosis. Cursors (+) mark upper and lower poles of the kidney. |
Most RCC are solid tumors that may be hyperechoic, isoechoic, or hypoechoic compared to renal parenchyma (Fig. 3.16). Tumors commonly have a slightly more heterogeneous echotexture than parenchyma. They cause a focal bulge that distorts the margin of the kidney or impinges on the renal sinus.
Necrosis, hemorrhage, and cystic degeneration cause intratumoral cystic spaces (Fig. 3.17).
Calcification is common (up to 18%) and variable in appearance: punctate, coarse, central, peripheral, or curvilinear (Fig. 3.17).
Cystic forms of RCC most often have thick walls and internal debris [33]. RCC arising within simple cysts are rare and appear as cysts with a mural nodule.
Multicystic form of RCC has thick walls (>2 mm) and thick septations (Fig. 3.18).
Doppler shows prominent vascularity with high velocity flow in most tumors. Absence of hypervascularity does not exclude malignancy, because some RCC are hypovascular.
Metastatic lymphadenopathy is visualized as hypoechoic solid nodules near the renal vessels and around and between the aorta and IVC.
Tumor thrombus within the renal vein or IVC appears as solid tissue enlarging the vein (Fig. 3.19) [34]. Color flow US may show venous blood flow diverting around the tumor thrombus and, sometimes, arterial flow within the tumor thrombus. Venous flow within the vein is absent if the vein is completely occluded.
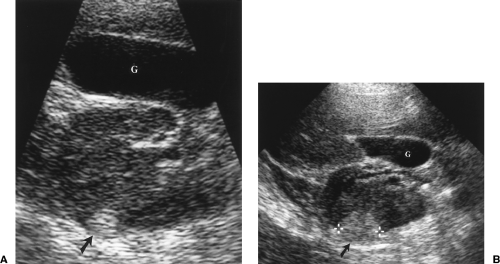 Figure 3.16 Echogenic Renal Cell Carcinoma. A. Initial US shows a small, solid echogenic mass (arrow) in the renal parenchyma. The lesion resembles angiomyolipoma; however, CT failed to demonstrate intratumoral fat. B. US scan 6 months later shows enlargement of the tumor (arrow, between cursors, +). Surgical excision confirmed renal cell carcinoma. The gallbladder (G) is seen anterior to the kidney in both images. |
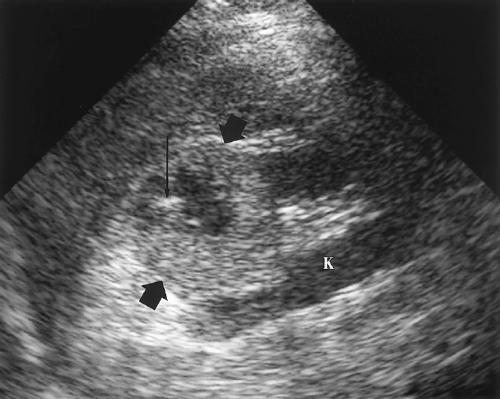 Figure 3.17 Renal Cell Carcinoma with Hemorrhage and Calcification. This tumor (between fat arrows) expands from the upper pole of the kidney (K) and has central low density representing necrosis and hemorrhage. Punctate calcification (long arrow) is also present within the tumor. |
Angiomyolipoma
Angiomyolipoma (AML) is a common benign renal tumor that contains variable amounts of blood vessels (angio), smooth muscle (myo), and fat (lipoma) [35]. AML is multiple and bilateral in patients with tuberous sclerosis, but is more commonly an isolated lesion discovered incidentally by US. Most tumors are asymptomatic, but large tumors may bleed, especially during pregnancy, or cause flank pain or a palpable mass.
Tumor appearance depends upon the proportion and distribution of the tumor elements (Fig. 3.20) [36].
A well-defined, homogeneous hyperechoic lesion is the classic appearance of an AML that is predominantly fat (Fig. 3.21).
Lesions with minimal fat are typically isoechoic to renal parenchyma [37].
Tumors may be markedly heterogeneous with a mixture of fat, smooth muscle, and blood vessels (Fig. 3.22).
Doppler demonstrates internal tumor vascularity in large tumors but often not in small ones. Spectral Doppler shows no specific findings.
AML is difficult to differentiate from RCC when the renal tumors are small (<3 cm) and echogenic (Fig. 3.21) [38]. Signs that favor RCC over AML include the presence of intratumoral cystic spaces, a peripheral hypoechoic rim, or intratumoral calcification [39,40]. These findings are all rare in AML. Acoustic shadowing is sometimes seen with AML, but not with RCC [39].
AML show significant growth when followed by US over time [41].
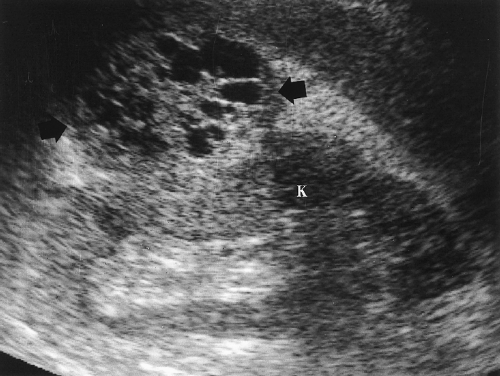 Figure 3.18 Multicystic Renal Cell Carcinoma. A multicystic mass (arrows) with prominent solid components extends exophytically from the kidney (K). Acoustic enhancement is seen deep to the mass. |
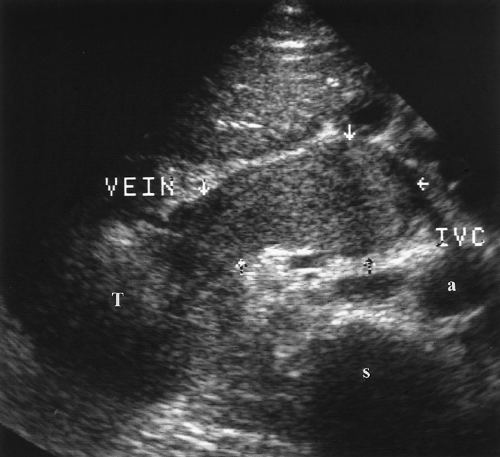 Figure 3.19 Tumor Invasion of Renal Vein and IVC. Transverse image shows tumor (T) extending from the right kidney and expanding into the renal vein (arrows) and inferior vena cava (IVC). a, aorta; s, spine. |
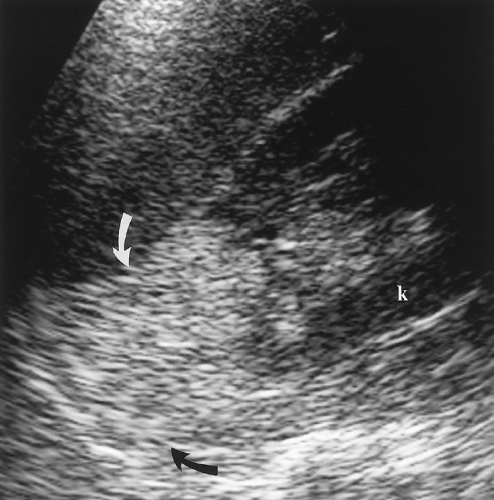 Figure 3.20 Angiomyolipoma. This predominantly fatty tumor (arrows) extends from the upper pole of the kidney (k) where it becomes indistinguishable from the perirenal fat. |
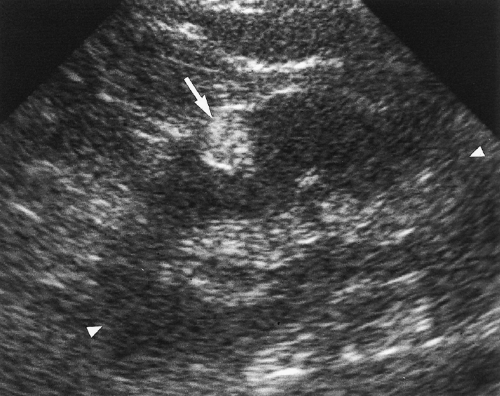 Figure 3.21 Small Angiomyolipoma. This tumor was shown by CT to consist almost entirely of fat. US shows a small echogenic mass (arrow). Note the similarity to the echogenic renal cell carcinoma shown in Figure 3.16. Arrowheads mark the upper and lower poles of the kidney. |
Transitional Cell Carcinoma
Transitional cell carcinoma (TCC) arises from the transitional epithelium that lines the renal collecting system, ureter, and bladder [42]. TCC of the renal pelvis and ureter is much less common than TCC of the bladder. TCC may be papillary (85%) with a frondlike growth pattern or infiltrating with plaque-like lesions, wall thickening, and stricture.
TCC appears as a central hypoechoic or isoechoic mass that replaces the echogenic renal sinus fat [42].
Obstruction by the tumor results in focal calyceal or renal pelvis dilatation.
Infiltrating tumors cause focal thickening of the wall of the collecting system.Related posts:

Stay updated, free articles. Join our Telegram channel

Full access? Get Clinical Tree