(T) Primary Tumor | Adapted from 7th edition AJCC Staging Forms. | |
TNM | Definitions | |
TX | Primary tumor cannot be assessed | |
T0 | No evidence of primary tumor | |
T1 | Tumor ≤ 7 cm in greatest dimension, limited to the kidney | |
T1a | Tumor ≤ 4 cm in greatest dimension, limited to the kidney | |
T1b | Tumor > 4 cm but ≤ 7 cm in greatest dimension, limited to the kidney | |
T2 | Tumor > 7 cm in greatest dimension, limited to the kidney | |
T2a | Tumor > 7 cm but ≤ 10 cm in greatest dimension, limited to the kidney | |
T2b | Tumor > 10 cm, limited to the kidney | |
T3 | Tumor extends into major veins or perinephric tissues but not into the ipsilateral adrenal gland and not beyond Gerota fascia | |
T3a | Tumor grossly extends into the renal vein or its segmental (muscle containing) branches, or tumor invades perirenal &/or renal sinus fat but not beyond Gerota fascia | |
T3b | Tumor grossly extends into the vena cava below the diaphragm | |
T3c | Tumor grossly extends into the vena cava above the diaphragm or invades the wall of the vena cava | |
T4 | Tumor invades beyond Gerota fascia (including contiguous extension into the ipsilateral adrenal gland) | |
(N) Regional Lymph Nodes | ||
NX | Regional lymph nodes cannot be assessed | |
N0 | No regional lymph node metastasis | |
N1 | Metastasis in regional lymph node(s) | |
(M) Distant Metastasis | ||
M0 | No distant metastasis | |
M1 | Distant metastasis | |
AJCC Stages/Prognostic Groups | Adapted from 7th edition AJCC Staging Forms. | ||
Stage | T | N | M |
I | T1 | N0 | M0 |
II | T2 | N0 | M0 |
III | T1 or T2 | N1 | M0 |
T3 | N0 or N1 | M0 | |
IV | T4 | Any N | M0 |
Any T | Any N | M1 | |
Comparison of Robson and TNM Staging | ||
Robson Stage | Definitions | TNM |
I | Tumor ≤ 2.5 cm and confined to kidney | T1 |
Tumor > 2.5 cm and confined to kidney | T1-T2 | |
II | Tumor extends into perinephric fat or adrenal | T3a if involves perinephric fat, T4 if involves ipsilateral adrenal |
IIIA | Tumor invades renal vein | T3a |
Tumor extends into inferior vena cava | T3b below the diaphragm | |
IIIB | Lymph node involvement | N0-N1, M0 |
IIIC | Involvement of local vasculature and lymph nodes | T3a-c, N0-N1 |
IVA | Involvement of adjacent organs (except ipsilateral adrenal) | T4 |
IVB | Distant metastases | M1 |
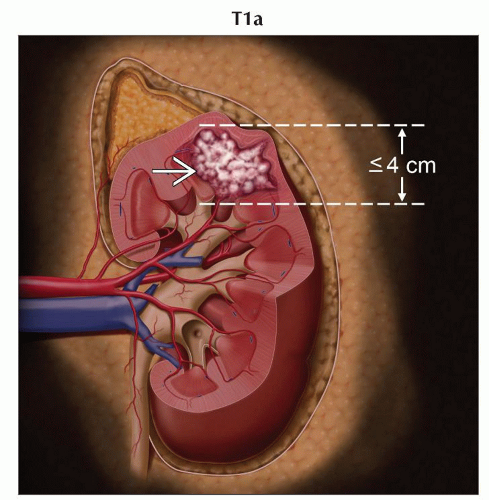 Coronal graphic shows a typical T1a lesion  , defined as less than or equal to 4 cm and confined to the kidney. , defined as less than or equal to 4 cm and confined to the kidney. |
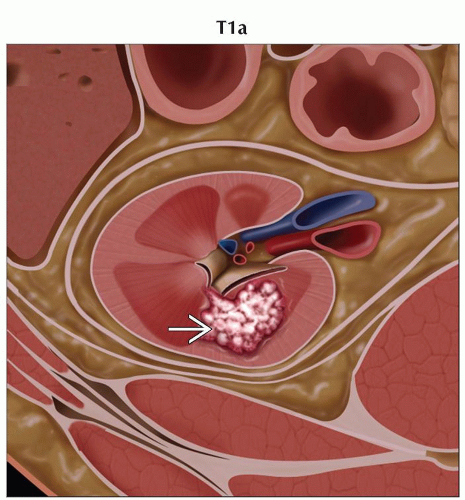 Axial graphic shows a T1a renal cell carcinoma  , defined as less than or equal to 4 cm and confined to the kidney. Lesions may be exophytic or more centrally located, as is the T1a depicted here. , defined as less than or equal to 4 cm and confined to the kidney. Lesions may be exophytic or more centrally located, as is the T1a depicted here. |
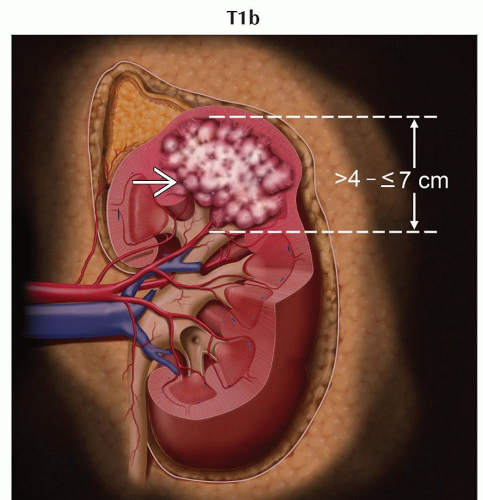 Coronal graphic shows a typical T1b lesion  , defined as larger than 4 cm but less than or equal to 7 cm and confined to the kidney. , defined as larger than 4 cm but less than or equal to 7 cm and confined to the kidney. |
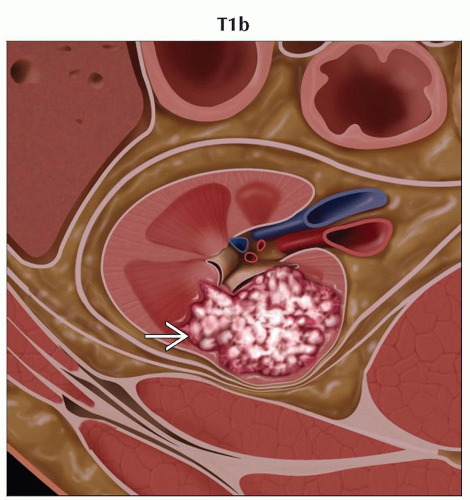 Axial graphic shows a T1b renal cell carcinoma  , defined as larger than 4 cm but less than or equal to 7 cm and confined to the kidney. These lesions may be exophytic but will still be categorized as T1 as long as there is no extension outside of the kidney. , defined as larger than 4 cm but less than or equal to 7 cm and confined to the kidney. These lesions may be exophytic but will still be categorized as T1 as long as there is no extension outside of the kidney. |
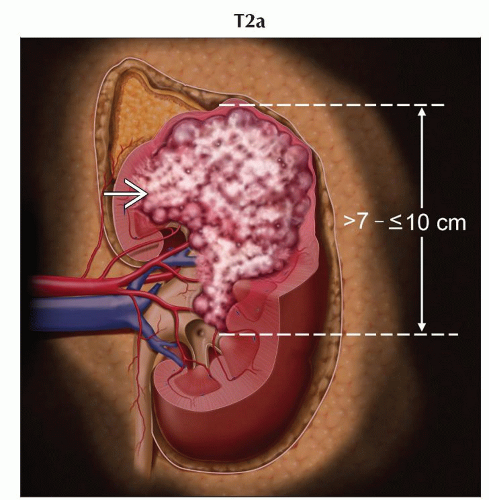 Coronal graphic shows a T2a renal cell carcinoma  , defined as larger than 7 cm but less than or equal to 10 cm and confined to the kidney. These lesions may also be described as exophytic but do not invade outside of the kidney. , defined as larger than 7 cm but less than or equal to 10 cm and confined to the kidney. These lesions may also be described as exophytic but do not invade outside of the kidney. |
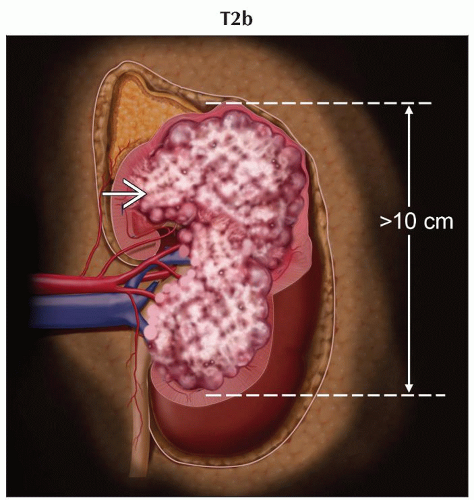 Coronal graphic shows a typical T2b renal cell carcinoma  , defined as larger than 10 cm but confined to the kidney. , defined as larger than 10 cm but confined to the kidney. |
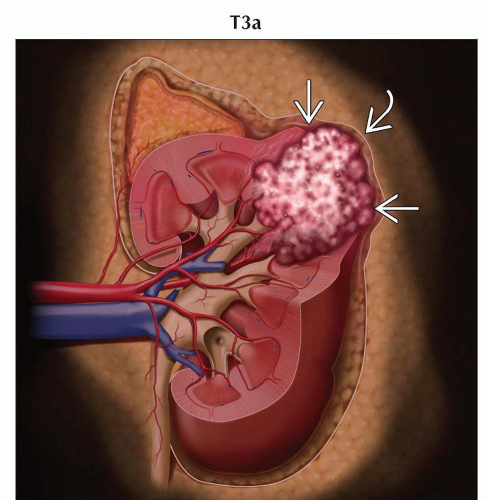 Coronal graphic shows a T3a renal cell carcinoma with tumor extension  into the perirenal fat but not beyond the confines of Gerota fascia into the perirenal fat but not beyond the confines of Gerota fascia  . . |
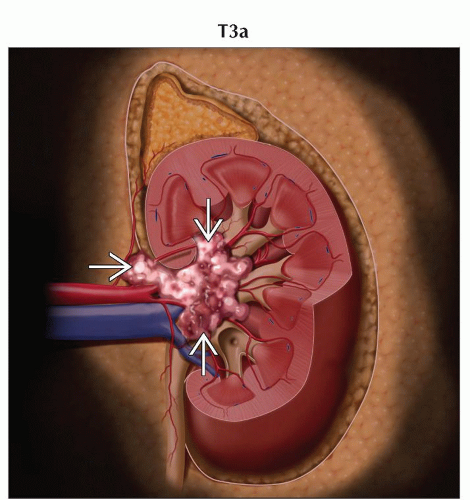 Coronal graphic shows another example of a T3a lesion with extension into the perirenal or renal sinus fat  . Again, the tumor is limited by the confines of Gerota fascia. . Again, the tumor is limited by the confines of Gerota fascia. |
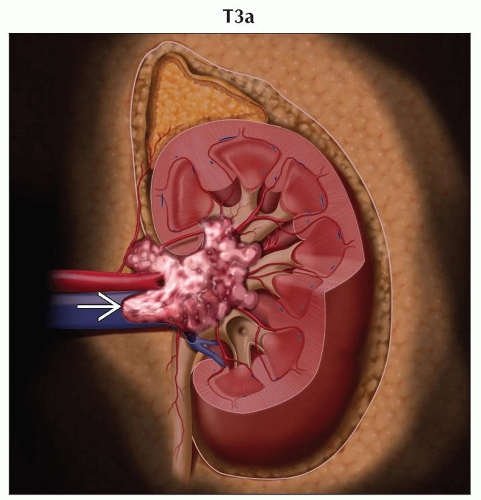 Coronal graphic shows a T3a renal cell carcinoma with extension of tumor into the renal vein  . Extension beyond the renal vein into the inferior vena cava would be defined as T3b lesion. . Extension beyond the renal vein into the inferior vena cava would be defined as T3b lesion. |
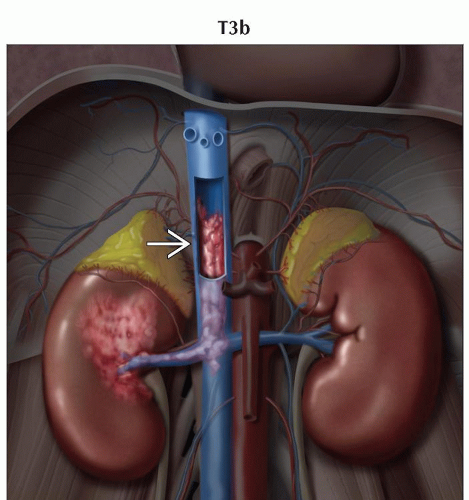 Coronal graphic shows a T3b renal cell carcinoma with extension of tumor not only into the renal vein but also into the inferior vena cava  . T3b lesions do not extend above the diaphragm. . T3b lesions do not extend above the diaphragm. |
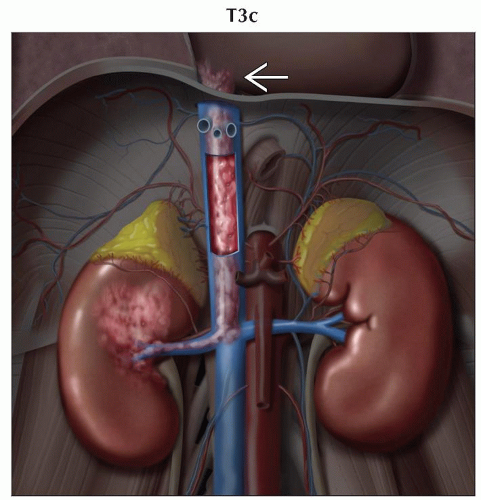 Coronal graphic shows a T3c renal cell carcinoma with involvement of tumor in the renal vein and inferior vena cava, as well as extension of tumor within the inferior vena cava above the diaphragm  . . |
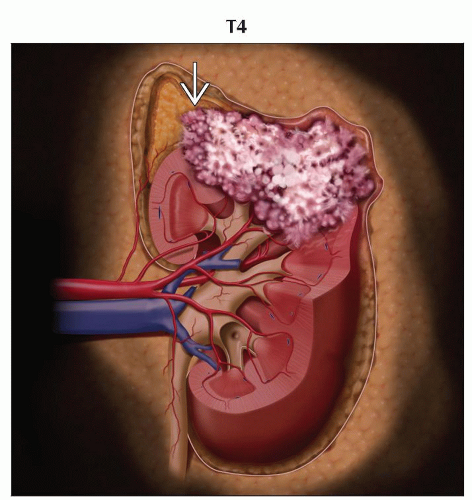 Coronal graphic shows a T4 renal cell carcinoma with extension into the ipsilateral adrenal gland  . . |
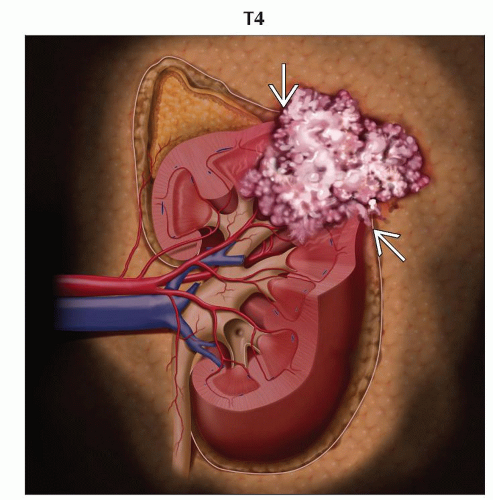 Coronal graphic shows another example of a T4 lesion with invasion into not only the perirenal fat but also with extension beyond the Gerota fascia  . . |
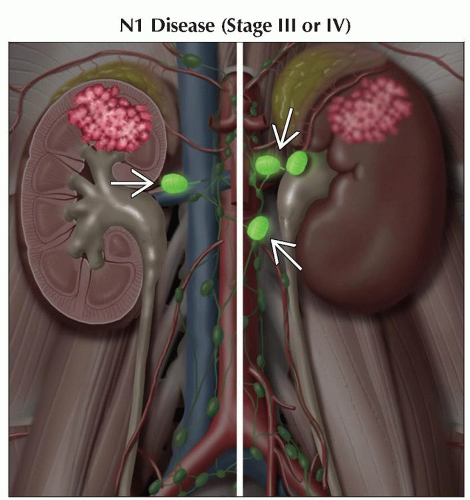 Coronal graphic shows retroperitoneal adenopathy on both sides of midline  . N0 disease is classified as no regional lymph node metastasis, while N1 disease is classified as metastatic disease in regional lymph nodes. . N0 disease is classified as no regional lymph node metastasis, while N1 disease is classified as metastatic disease in regional lymph nodes. |
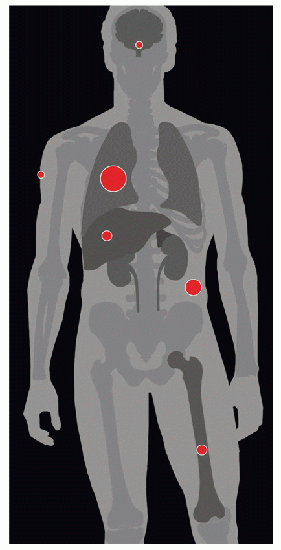
| METASTASES, ORGAN FREQUENCY | |
Lungs | 75% | |
Soft tissue | 35% | |
Bone | 20% | |
Liver | 20% | |
Adrenal gland | 19% | |
Cutaneous tissues | 8% | |
CNS | 8% | |
25-40% of patients present with metastatic disease. | ||
Represents 2.6% of all cancers
Only 2-4% occur in inherited syndromes
Renal cell carcinoma (RCC) is most common renal cancer (85%)
2% bilateral involvement
4 major histopathologic subtypes of renal cell carcinoma
Clear cell carcinoma
Papillary carcinoma
Collecting duct carcinoma
Chromophobe renal carcinoma
Hematogenous, lymphatic, &/or direct invasion
25% may be multifocal in the same kidney
Found incidentally at autopsy, in some series in up to 25% of cases
25-40% present with metastatic disease
Lung (75%)
Soft tissue (35%)
Bone (20%)
Liver (20%)
Cutaneous tissues (8%)
CNS (8%)
Comments
Renal cell carcinoma arises from renal tubular epithelium
Genetics
Hereditary papillary RCC
Multiple
Bilateral
Papillary renal tumors
Autosomal dominant
C-met oncogene on chromosome 7
Hereditary leiomyoma and renal cell cancer syndrome
Cutaneous leiomyomas
Uterine fibroids
Renal cell cancer
Suspected mutation of fumarate hydratase gene
von Hippel-Lindau
RCC
Retinal angioma
Hemangioblastomas
Pheochromocytomas and others
Mutation of VHL gene on chromosome 3p25
RCC develops in approximately 40% of patients with von Hippel-Lindau
Major cause of mortality
Birt-Hogg-Dubé syndrome
Fibrofolliculomas on head and neck
Chromophobic RCC or onocytoma
Mutation of BDH gene on chromosome 17p
Etiology
Genetic and environmental causes
Genetic
Tuberous sclerosis
von Hippel-Lindau
Birt-Hogg-Dubé syndrome
Hereditary papillary RCC
Environmental
Cigarette smoking: Dose dependent
Obesity
Hypertension
Acquired cystic disease from chronic dialysis
Chronic exposure to phenacetin
Benzene exposure
Cadmium exposure
Asbestos exposure
Other risk factors
Increasing age
Male sex
Epidemiology & cancer incidence
Estimated 2008 incidence: 54,000 cases in USA
M:F = 2:1
Highest incidence in 6th to 8th decade
Associated diseases, abnormalities
Multiple paraneoplastic disorders associated with RCC usually caused by tumor release of various cytokines
Hypercalcemia
Erythrocytosis
Polyneuropathy
Amyloidosis
Hypertension
Dermatomyositis
Syndromes may resolve after successful treatment of tumor
Varies from solid to cystic mass
Yellow areas are due to lipid-rich tumor cells
May have gray or black areas of necrosis or hemorrhage
H&E
Clear cell carcinoma
Have clear or granular cytoplasm in round cells
Tumors may have solid, trabecular, or tubular pattern
Papillary carcinoma
Tumor cells are cuboidal or low columnar
Tumor pattern is papillary
Chromophobe RCC
Tumor cell morphology varies, but cells are lightly eosinophilic stained
Tumor pattern is solid sheets
T staging accuracy is around 80% with noted difficulty in imaging some retroperitoneal and perinephric areas
General T staging imaging characteristics
T1: Tumor ≤ 7 cm in greatest dimension, limited to kidney
No evidence of perinephric fat or renal fascial involvement
Exophytic tumors may not be reliably classified into T1a, T1b, or T2
Solid enhancing lesion
T2: Tumor > 7 cm in greatest dimension, limited to kidney
Imaging may be useful for distinguishing between T2a and T2b lesions
T3: Tumor extends into major veins or perinephric tissues but not into ipsilateral adrenal gland and not beyond Gerota fascia
Ultrasound and MR very useful to demonstrate venous thrombus and to evaluate possible tumor thrombus
In general, thrombi that contain enhancing vessels are tumor
Can be used to identify thrombus in renal veins or inferior vena cava (IVC) with accuracy of 87%
T4: Tumor invades beyond Gerota fascia or invades IVC above diaphragm
Chest CT is recommended for large or aggressive primary tumors
Brain MR and bone scans are often performed in patients with suggestive signs or symptoms
PET/CT may be useful for identifying possible distant metastases in patients with large primary lesions
Debated whether to use for primary detection of metastases or only to verify equivocal CT findings
Ultrasound
Primary method for differentiating a cyst from a solid lesion
Primary tumor may be variably echogenic relative to background renal cortex
Isoechoic
May be missed on ultrasound, as tumor may be indistinguishable from background renal parenchyma
Look for border contour deformity
Hypoechoic
Differentiated from a cyst by lack of through transmission
Hyperechoic
Tend to be smaller
May look similar to angiomyolipomas
Large lesions often heterogeneous in echotexture
CT
NECT and parenchymal phase CECT are necessary for all patients unless contraindicated
NECT
Variable appearance
Small lesions may be homogeneous in attenuation
Larger lesions often show central necrosis
May have calcifications
Almost never contain macroscopic fat
May also be primarily cystic
Low attenuation
Papillary RCCs
Moderate attenuation
May be chromophobe RCC or angiomyolipoma (soft tissue component of mass, lipomatous areas will be low density)
High attenuation
Clear cell RCC lesions often have mixed pattern
High-attenuation regions represent soft tissue areas, while low-attenuation regions are necrotic or cystic
Oncocytomas may have a similar appearance on CT
Pseudocapsule may be seen as high-density ring surrounding tumor
CECT
Renal mass protocol includes
Thin slice 1.25-2.5 mm
Noncontrast and contrast-enhanced acquisitions
Arterial phase with 20 second delay helpful for evaluating arterial vessels
Nephrographic phase with 60-70 second delay best for evaluating parenchyma
Delayed phase with 5-10 minutes delay best for evaluating collecting system
Coronal reformatted images also helpful for better defining relationship of tumor to other structures
Enhancement pattern during nephrographic phase is most useful for determining type of tumor
Gold standard for detection and staging is CT
RCCs have variable enhancement patterns
Some will enhance briskly
Papillary RCCs may have very little enhancement (can be mistaken for a hyperdense cyst with pseudoenhancement)
Solid enhancing mass in the kidney is RCC until proven otherwise
MR
In general, similar findings to CT
Variable signal characteristics and enhancement pattern
Typically iso- to hypointense compared to normal renal cortex on T1-weighted images
Typically hyperintense on T2-weighted images
Cystic RCCs will generally have enhancing septa or mural nodularity
PET/CT
Similar findings on CT portion of exam as those discussed above
RCCs have variable FDG avidity
More helpful when intensely FDG avid
Solid mass without FDG activity can still be RCC
Not generally used to differentiate benign from malignant renal masses
Image-guided biopsies
Not routinely done
Can be performed for problem solving
e.g., in a patient with a different primary malignancy for differentiating metastasis from primary renal malignancy
Nodal
Ultrasound
Not used for nodal or metastatic evaluation
Can be used for problem solving with lesions seen in other organs, e.g., liver
Can be used to evaluate renal vessels and IVC for patency
CT with contrast likely better to look for vascular invasion
CT
Gold standard for detection of nodes and for evaluation of vascular structures
Nodes may hyperenhance
Smaller nodes may appear normal
Larger nodal metastases may be heterogeneous or have central necrosis
Best modality for looking at invasion of perinephric fat and other local structures
MR
Typically reserved for patients with renal insufficiency or contraindications for CT contrast
Particularly useful for determining invasion and extent of involvement into IVC
PET/CT
For RCC metastases using FDG PET
Sensitivity (63%), specificity (100%), PPV (100%)
Higher than CT alone
For identification and characterization of primary RCC tumors
Sensitivity (47%), specificity (80%), accuracy (51%)
Lower than CT alone
False-negatives are due to urinary excretion of tracer in some tumors
Lesions ≤ 1 cm have far lower sensitivity due to scanner limitations
CTA or MRA
Can be helpful in establishing tumor relation to vascular supplies
Also potentially useful for nephron sparing or laparoscopic procedures
Metastatic disease
Metastatic location frequencies
Lung (75%)
Soft tissue (35%)
Bone (20%)
Liver (20%)
Adrenal glands (19%)
Cutaneous tissues (8%)
CNS (8%)
CT
Tumor extension or thrombus via renal vein (23%), inferior vena cava (7%)
Usually seen as hypervascular metastases
MR
On T1 post-contrast imaging, RCC usually enhances less than renal tissue
Multiplanar capacity of MR allows ideal assessment of renal vein and IVC
Preferred to evaluate for intracranial metastases
Staging with MR is equal or better to CT
PET/CT
FDG uptake by RCC primary or metastatic lesion is variable
PET and PET/CT are more clinically helpful when positive
Negative exam may be true negative or non-FDG-avid RCC
80-100% specific for bony metastases
Ultrasound
Risk increases without clean surgical margins
Small bowel occupying nephrectomy bed can be mistaken for recurrence
Ultrasound is not acceptable for monitoring nephrectomy bed
CT
Useful to follow patients after treatment
20-30% of patients with apparent localized renal cell carcinoma at time of surgery relapse following radical nephrectomy
Majority are distant metastases
Usually relapse within 3 years
Lung metastases are most common late relapse finding
May appear as hemorrhagic metastases, show lymphatic invasion, or produce consolidation
Bone metastases are less common
Rarely, pancreatic lesions are identified
MR
MR is superior to CT in assessing venous involvement
CT is currently preferred to MR in following patients for disease recurrence after surgery
PET/CT
Nephrectomy bed has highest area of recurrence (20-40%)
Partial nephrectomy patients should have remnant carefully evaluated
Recurrence rates in remnant are 4-6% within 2-4 years, depending on stage
Some recurrence may be from incomplete margins, while others represent multifocal disease
Thoracic involvement should be evaluated by CT
Bone scan and brain MR may be performed with appropriate clinical indications
PET/CT has been shown useful for both local recurrence and metastases
Metastatic frequency by tumor stage
T1 disease (7.1%)
T2 disease (26.5%)
T3 disease (39.4%)
“Classic” triad
Hematuria
Flank pain
Abdominal mass
< 15% of patients present with classic triad
Other signs and symptoms include
Weight loss
Fever
Hypercalcemia
Night sweats
Malaise
Hypertension
Roughly half of cases are identified as incidental finding on imaging
Remainder are suspected based on
Various symptoms of paraneoplastic syndromes
Direct effects of tumor metastasis
Identification of palpable renal mass
5-year survival by stage
T1a N0 M0 (70-90%)
T1b N0 M0 (80-90%)
T2 N0 M0 (70-80%)
Organ confined, T1-T2 N0 M0 (70-90%)
Invasion of perinephric fat, T3a N0 M0 (60-80%)
Venous involvement, T3b-T3c N0 M0 (40-65%)
Adrenal involvement, T4 N0 M0 (0-30%)
Locally advanced, T4 N0 M0 (0-20%)
Lymph involvement, any T, N+, M0 (0-20%)
Systemic metastases, any T, any N, M1 (0-10%)
Major treatment alternatives
Surgery is treatment of choice unless late stage
Alternatives
Radiofrequency ablation
Cryoablation
Ultrasound ablation
Microwave radiotherapy
Currently no recommendation for adjuvant therapy for resection of primary tumor
Major treatment roadblocks
RCC typically have high levels of MDR protein, making chemotherapy difficult
Treatment options by primary tumor stage
T1a: Nephron-sparing surgery preferred, radical nephrectomy in some selected patients
T1b-T2: Radical nephrectomy recommended, laparoscopic preferred
T3-T4: Radical open nephrectomy recommended
Ideally, report should include bidirectional axial dimensions and coronal dimension
Report any obvious or questionable spread outside of kidney into Gerota fascia
Report size and confidence level of all retroperitoneal nodes near level of renal veins
Any nodes > 1 cm should be reported as suspicious
Nodes ≤ 1 cm should be reported as indeterminate
Look for additional features of central necrosis or hyperenhancement
Must report whether there is adrenal involvement, as this may affect whether a radical nephrectomy will be performed
If there is adrenal asymmetry or nodularity, consider further evaluation prior to surgery
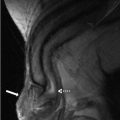
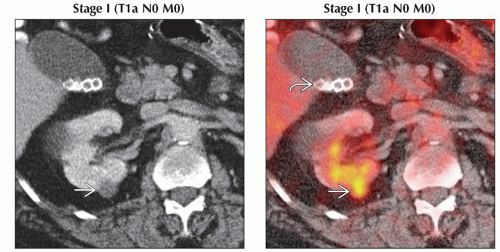 (Left) Axial CECT shows a small (just over 1 cm), low-attenuation, enhancing lesion
 in the posterior mid pole right kidney. Although nonspecific, the enhancement makes this suspicious for a renal cell carcinoma. (Right) Axial PET/CT shows focal FDG within the pathologically confirmed T1a renal cell carcinoma in the posterior mid pole right kidney. Although nonspecific, the enhancement makes this suspicious for a renal cell carcinoma. (Right) Axial PET/CT shows focal FDG within the pathologically confirmed T1a renal cell carcinoma  in the right kidney. Renal cell carcinomas have variable FDG uptake, but intensely FDG-avid lesions should be viewed as very suspicious. Note the gallstones in the right kidney. Renal cell carcinomas have variable FDG uptake, but intensely FDG-avid lesions should be viewed as very suspicious. Note the gallstones  . .Related posts:Stay updated, free articles. Join our Telegram channel
Full access? Get Clinical Tree
 Get Clinical Tree app for offline access

|