Fig. 1.1
A dedicated imaging protocol is needed for optimized evaluation of the renal mass by CT. At our institution, a CT scan dedicated for evaluation of a renal mass typically consists of three imaging series performed during breath-hold: precontrast, corticomedullary phase, and late nephrographic/early excretory phase. (a) Precontrast images are essential for evaluation of the presence of calcifications and/or hemorrhagic components. They also provide a baseline density measurement for evaluating the presence, degree, and pattern of enhancement in cystic or solid renal masses. (b) Corticomedullary images (typical scan delay 25–30 s after injection) are superior in lesion characterization and anatomic assessment. (c) The nephrographic (approximately 90 s after injection) phase can facilitate the detection of renal masses, especially those of smaller size, due to the homogeneous nephrogram on these images. (d) In addition, excretory phase images (these can typically be achieved with a scan delay of 3 min) are helpful for delineation of the renal collecting system. High accuracy (sensitivity up to 100 %; specificity up to 95 %) has been reported in the detection of renal masses when proper technique is applied
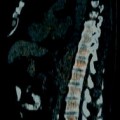
Fig. 1.2
The advantages of MR imaging include its intrinsic high soft-tissue contrast, direct multiplanar imaging capabilities, and lack of radiation exposure. MR imaging of renal masses commonly includes the following breath-hold sequences: (1) axial T1-weighted image (T1WI) in (a) and out of phase (b) gradient echo sequence, which is helpful in identification of both macroscopic and microscopic fat in a renal tumor; (2) T2-weighted half-Fourier single-shot fast spin-echo sequence in axial and/or coronal planes (c), which is useful for evaluating the overall anatomy, renal collecting system, and the complexity of a cystic renal lesion; and (3) a dynamic contrast-enhanced T1-weighted fat-suppressed sequence. For the dynamic contrast-enhanced images, 3D fast spoiled gradient echo sequences are typically performed before (d) and after contrast administration during the arterial, corticomedullary (e), nephrographic (f), and excretory phases for evaluation of the presence and pattern of enhancement in a renal mass. Multiplanar reconstruction may be performed if necessary to better delineate the spatial relationship of the renal mass to adjacent anatomic structures. If necessary, a dedicated magnetic resonance angiography (MRA) sequence during the arterial phase may be performed for better visualization of accessory renal vessels and facilitation of surgical planning. Coronal images may also be obtained during the excretory phase with administration of diuretics, from which maximum intensity projection (MIP) images can then be obtained to produce intravenous pyelogram (IVP)–like images
Pathology
Fig. 1.3
Simple renal cyst. One of the most basic principles of cross-sectional imaging in the evaluation of a renal mass is to determine whether a renal lesion is cystic or solid, and if cystic, whether it represents a benign cystic lesion (nonsurgical lesion) or a potentially malignant one (surgical lesion). (a) This contrast-enhanced CT demonstrates a fluid attenuation lesion with a thin imperceptible wall (arrow) arising from the right kidney consistent with a simple cyst. A simple cyst is defined as a homogenous density lesion measuring between −20 and 20 HU (on noncontrast and contrast-enhanced studies) and containing a thin imperceptible wall without septations or calcifications. A simple cyst should have a sharp interface with the adjacent renal parenchyma [2]. (b) This coronal T2WI demonstrates a very high T2 signal lesion with a thin, imperceptible wall (long arrow), arising from the upper pole of the right kidney, consistent with a cyst. Incidentally noted is partially imaged hydronephrosis (short arrow). On MRI, the signal intensity of a simple cyst is equivalent to fluid on all sequences (very high T2 signal, low T1 signal without enhancement) is uniform in signal and lacks septations or wall thickening
Fig. 1.4
(a) This contrast-enhanced CT of the left kidney in a patient with adult polycystic kidney disease, demonstrate numerous simple cysts, and one additional lesion posteriorly (arrow), which is clearly higher than fluid in attenuation, measuring 65 HU (measurement not shown). Based on this sequence alone, one should consider the possibility that this lesion represents a solid enhancing mass. (b) However, noncontrast images were also performed in this case, demonstrating that the lesion (arrow) is clearly higher in attenuation than the adjacent solid renal parenchyma and actually measured 62 HU (not shown). Because the attenuation difference between the pre- and postcontrast images is less than 10 HU, this is consistent with a hyperdense cyst rather than an enhancing neoplasm. A cyst that contains sufficient hemorrhagic or proteinaceous content will measure more than 20 HU on both noncontrast and contrast-enhanced CT images, and thus cannot be called a simple cyst. If both pre- and postcontrast images are available and the attenuation difference of the lesion on these two sequences is less than 10 HU (an attenuation difference of at least 10 HU is required before a lesion is considered “enhancing”), then the lesion is consistent with a hyperdense cyst. These T1-weighted precontrast (c) and nephrographic-phase (d) MR images both demonstrate a high signal lesion arising from the left kidney (arrows). (e) This subtraction image (precontrast image c subtracted from postcontrast image d) shows that the lesion (arrow) is now dark, therefore not enhancing, which confirms the diagnosis of a hemorrhagic or proteinaceous cyst. On both CT and MRI, these minimally complex cysts demonstrate lack of enhancement; the presence of enhancement is the hallmark of a solid lesion. Note the small focus of apparent enhancement in (e) (arrowhead), actually representing misregistration artifact and not enhancement (arrow on remainder of cyst which subtracts out indicating lack of enhancement). Protein and methemoglobin, the latter of which is present in hemorrhagic cysts (methemoglobin forms from oxidized hemoglobin and is paramagnetic), cause T1 shortening, resulting in high signal intensity on T1WI [3]. (f) In the same patient, this T2WI demonstrates that the hemorrhagic cyst is low in signal intensity (arrow). Hemorrhagic cysts can have high- or low-signal intensity on T2WI depending on the age and concentration of various blood products
Fig. 1.5
Renal cystic lesions: septations, calcification, and mural nodules. (a) This contrast-enhanced CT demonstrates a large right upper pole renal cyst, which contains a thin, approximately 1 mm enhancing septation (arrow). This lesion remained stable for at least 9 years. (b, c) Pre- and postcontrast CT images, respectively, of a complex right lower pole renal cyst at the same level. (b) Thick calcifications are seen in the wall of this cyst (arrows), but there is no evidence of any solid enhancing mural nodule. This lesion subsequently remained stable for at least 8 years. Incidentally seen on the image is hydronephrosis due to a long-standing ureteropelvic junction obstruction (long arrow in c). Radiologically benign complex cysts can contain up to a few septations measuring 1 mm or less in thickness and/or mural calcifications. Thin septations are better seen on MRI and ultrasound than on CT, whereas calcifications are best evaluated on noncontrast CT. However, the presence of thickened enhancing septations or an enhancing solid nodule indicates a potentially malignant lesion that is generally managed surgically. In the early days of CT, the presence of thick and irregular calcifications in a cyst was indicative of a surgical lesion because such lesions occasionally harbor malignancy [2, 4]. However, with improved CT imaging techniques, it has subsequently been shown that the presence of a calcification alone, even if thick or irregular, is not indicative of malignancy in the absence of a thickened or nodular enhancing septation or cyst wall [5]. Benign calcifications are frequently caused by old hemorrhage or infection within a cyst [6]. Such lesions are currently classified as 2F lesions in the Bosniak Renal Cyst Classification System [6] and require follow-up imaging; if enhancing soft tissue becomes evident on follow-up CT, then the lesion becomes a potential surgical lesion (Bosniak III). Follow-up imaging (generally 3–6 month at first and then annually for several years [7]) should be performed on all complex cysts that fall into the “2F” category, which includes cystic renal lesions with a few thin septations, a thickened septation without nodularity, thick and nodular calcifications without associated enhancing soft tissue, and hyperdense cysts larger than 3 cm [8]. Due to its superior contrast resolution, MRI can be more sensitive than CT in detecting small amounts of enhancing soft tissue, especially when subtraction techniques are utilized (see Fig. 1.4e), and particularly in calcified cystic lesions (calcification is much less apparent on MR, thus, potentially “unmasking” underlying enhancement that can be otherwise be obscured on CT) [7]
Fig. 1.6
Multiloculated cystic masses. (a) This contrast-enhanced CT scan in a middle-aged woman demonstrates a 16 cm cystic mass with multiple thin enhancing septations (arrows). Although the septations are relatively thin and without solid nodules, the multiplicity of the septations prompted surgical resection. At pathology, the mass proved to be a cystic nephroma (also known as multilocular cystic nephroma), which is a multiloculated cystic mass with numerous fibrous septae, typically seen in middle-aged women. The vast majority of these lesions are benign (a radiographically indistinguishable lesion known as cystic nephroblastoma is generally seen in boys up to 2 years old) [9]. (b) This contrast-enhanced CT demonstrates a large cystic mass with a thick enhancing wall and multiple enhancing mural nodules (arrows) (noncontrast images not shown), consistent with a cystic renal neoplasm. At pathology, this lesion proved to be a clear cell carcinoma with prominent cystic changes. Cystic nephroma and RCC are the two most common causes of multilocular cysts in adults. These lesions cannot be reliably distinguished from each other, but RCC, unlike cystic nephroma, can contain hemorrhagic components, have relatively large solid components, and can demonstrate additional signs of malignancy such as renal vein invasion [7]. (c) A CT scan of this multiloculated cystic right renal mass demonstrates multiple thin enhancing septations with areas of mural thickening (long arrow) and several enhancing nodules along the septations (one shown; short arrow). This lesion was subsequently resected and proved to be a cystic renal cell carcinoma
Fig. 1.7
This contrast-enhanced CT demonstrates a left renal cystic mass with a thickened, nodular wall (arrows), suspicious for a cystic renal neoplasm. However, at pathology, this lesion turned out to be a chronically inflamed cyst, which was not suspected preoperatively because the patient did not present with signs of infection. Mural thickening with enhancement due to granulation can be seen in infected or hemorrhagic cysts, abscesses, and organizing hematomas, and thus, these lesions are usually difficult to distinguish from cystic RCC radiologically. Although clinical symptoms can occasionally suggest a benign etiology, such lesions are usually surgically excised for diagnostic purposes [7]. If a renal abscess is suspected preoperatively, the lesion should be biopsied before attempting resection and then drained if pus is found [6]
Another important concept in the evaluation of potential renal cystic lesions on CT is the spurious elevation of Hounsfield unit measurements due to two distinct entities: volume averaging and pseudoenhancement. Volume averaging is encountered with lesions that are nearly as small or smaller than the thickness of the imaging slice, such that the resultant attenuation measurement will lie part way between that of the lesion in question and that of the surrounding tissue. Pseudoenhancement, on the other hand, is related to the beam-hardening artifact caused by the very high density of contrast within enhancing renal parenchyma. CT scanners use an algorithm that compensates for these beam-hardening effects, causing an apparent increase in attenuation that can range from 1 to 33 HU greater than the measurement obtained on the precontrast images, leading one to the erroneous conclusion that the lesion is enhancing when in reality it is not—hence, the term “pseudoenhancement” [10]. Pseudoenhancement is seen with both simple cysts (<20Hu) and hyperdense cysts (>20Hu), and is more pronounced with smaller lesions, with intraparenchymal versus exophytic lesions, with more intensely enhancing surrounding renal parenchyma, and with a larger number of detectors for multidetector CT [11, 12].
Get Clinical Tree app for offline access
Fig. 1.8
Ultrasound evaluation of cystic renal lesions. (a) This contrast-enhanced CT demonstrates a right renal cyst that contains a very thin, enhancing septation (arrow). (b) An ultrasound of the right kidney demonstrates the same lesion seen in A. Note that the same septation (arrow) is much easier to appreciate on ultrasound than CT. (c) This ultrasound of the right kidney demonstrates a multilocular cystic mass with thickened septations and at least one small solid nodule (arrow). This lesion proved to be a cystic RCC at histology. Ultrasound is commonly used to distinguish cystic from solid renal lesions, to further assess complex cysts detected on other imaging tests, and to follow-up known complex cystic lesions. Compared with CT, ultrasound is more cost-effective, does not expose the patient to ionizing radiation, and does not require intravenous contrast. On ultrasound, simple renal cysts are spherical or ovoid, anechoic structures; contain a smooth, thin, sharp back wall; and demonstrate increased through transmission [7]. If a cyst is hemorrhagic or proteinaceous, low-level echoes or layered echoes can be seen within the cyst [7]. Septations within cysts are echogenic and can create reverberation artifacts within the cyst; thus, septations are much more obvious on ultrasound than on CT [7]. Calcification within a cyst wall or septation appears as an echogenic focus that causes posterior acoustic shadowing. Due to shadowing and reverberation artifact, calcifications in renal cysts are better seen on noncontrast CT than ultrasound. Solid components in a cystic renal neoplasm are typically echogenic and fail to show posterior acoustic enhancement. Even small nodules within a cyst can be quite conspicuous on ultrasound due to the acoustic window of the cyst fluid [7]. Doppler imaging frequently demonstrates flow within these solid components [7]
Fig. 1.9
Clear cell carcinoma: CT. (a) This contrast-enhanced CT scan demonstrates a large, hypervascular left renal mass with central areas (arrow) of cystic change or necrosis. Note that the hypervascular peripheral areas (arrow) enhance to nearly the same degree as adjacent renal cortex (short arrow). Clear cell carcinoma is the most vascular of the malignant renal cortical neoplasms, demonstrating the greatest degree of enhancement after contrast administration, usually similar to, or slightly less than that of adjacent renal cortex [13–15]. In addition, clear cell carcinomas usually contain prominent areas of cystic change and/or necrosis, manifesting as areas of low attenuation on CT. In a study by Zhang et al. [15], a mixed pattern of hypervascularity with prominent areas of cystic change/necrosis, was most predictive of clear cell carcinoma. Peritumoral vascularity, or the presence of prominent, often irregular collateral feeding arteries and draining veins around the affected kidney confined within Gerotas fascia, are more often seen with clear cell carcinomas than with other types of renal tumors, and are more common with larger tumors. These collateral feeding arteries and draining veins are more likely to be seen with larger tumors [16]. In this example, note that the small vascular structures surrounding the left kidney (arrows) are absent on the right side. (b) In a different patient, this right lower pole renal mass, also a clear cell carcinoma, demonstrates extensive cystic change, although multiple small areas within the tumor (arrows) still enhance similar to adjacent renal cortex (arrowhead), indicating hypervascular nature of this tumor
Fig. 1.10
Clear cell carcinoma: MRI. (a) This postcontrast nephrographic phase image of a clear cell carcinoma demonstrates a heterogeneously hypervascular mass invading into the renal sinus (top arrow). This is a classic appearance for clear cell carcinoma on postcontrast MR images, as in CT, containing a mixed pattern of hypervascular (lower arrow) and hypovascular, necrotic or cystic areas (arrowhead) [15]. (b) Some clear cell carcinomas contain small amounts of intracellular lipid, which are variably hyperintense on T1 in-phase images (arrows). (c) These same areas demonstrate signal loss on opposed-phase images (arrows), indicating the presence of intracellular lipid [17, 18]. The presence of microscopic fat in a renal mass does not necessarily indicate an angiomyolipoma, which usually contains gross fat (see Figs. 1.16, 1.17, 1.18, 1.21, 1.22, and 1.23) [18]. (d) This T2WI of the same lesion demonstrates that the solid viable portions of the tumor are mildly T2 hyperintense (long arrow) whereas the cystic components are markedly T2 hyperintense (short arrow). Clear cell carcinoma is typically isointense to normal renal parenchyma on T1WI and so- to mildly hyperintense on T2WI. Heterogenous areas of central necrosis, which are commonly seen in clear cell carcinoma, demonstrate greater T2 signal hyperintensity and T1 signal hypointensity than the adjacent solid areas of tumor; these central necrotic/cystic areas demonstrate no enhancement in contrast to the rest of the tumor [19]. Clear cell carcinoma can contain intratumoral hemorrhage that manifests as high T1 and T2 signal in the subacute to chronic stage and low T1 and T2 signal in the longstanding chronic phase due to the predominance of hemosiderin [19, 20]
Fig. 1.11
Clear cell carcinoma: ultrasound. (a) This contrast-enhanced CT demonstrates a 7 cm heterogeneously hypervascular right interpolar renal mass consistent with clear cell carcinoma. Note the prominent peritumoral vascularity (arrows). (b) A longitudinal ultrasound on the same patient demonstrates that the mass (arrow) is solid and slightly hyperechoic relative to adjacent renal parenchyma. The mass involves the renal sinus fat. (c) Power Doppler imaging demonstrates marked vascularity, especially along the periphery of the mass (arrow), consistent with a renal cortical neoplasm. The ultrasound findings correlate well with the findings on CT (mass with prominent peritumoral vascularity with some areas of central necrosis). Renal carcinomas, including clear cell, are variable in their appearance on ultrasound, and can be hypo-, iso-, or hyperechoic relative to renal parenchyma [21]. However, prominent vascularity on Doppler imaging can help suggest the diagnosis of clear cell carcinoma. In a study by Raj et al. [22] vascularity was more likely to be associated with clear cell carcinoma than any other subtype of renal cortical neoplasm, although there was overlap with other subtypes
Fig. 1.12
Papillary carcinoma: CT. (a) This contrast-enhanced CT scan demonstrates a very homogenous right renal mass, which enhances much less than the adjacent renal parenchyma; these imaging features are most consistent with papillary subtype of renal carcinoma. Renal papillary carcinomas are usually low-grade malignant neoplasms with a favorable prognosis. These tumors are relatively hypovascular compared to renal parenchyma on CT, are usually homogenous in attenuation when they are small (<3 cm) and frequently demonstrate calcifications [15, 23]. They are more likely to be multiple and bilateral than renal neoplasms in general and can be hereditary [23]. (b) Noncontrast CT image from a different patient with papillary renal carcinoma demonstrates a large right renal mass with solid tissue in the periphery (asterisk) and a central lower attenuation area consistent with cystic change (measuring <20 HU). (c) After IV contrast administration, the tumor demonstrates mild enhancement in the solid peripheral region, whereas the central region remains fluid in attenuation. This is a typical imaging appearance for a large papillary carcinoma. Although homogenous when small, papillary carcinoma may demonstrate heterogeneity due to hemorrhage and necrosis when greater than 3 cm [21, 23, 24]. Some papillary carcinomas can manifest as cystic masses with mural nodules or peripheral enhancement as seen in (b and c). These tumors can be inherently cystic or can become this way due to cystic degeneration and necrosis [21]. Cystic degeneration is almost as common in papillary RCC as it is in clear cell RCC [25]. However, these entities can usually be distinguished by analyzing the solid component, which is much more vascular with clear cell carcinoma [15, 21]. In addition, the cystic component in papillary RCC is usually unilocular whereas in clear cell RCC it is usually multilocular [21]. It should be noted that papillary carcinomas are further classified into type 1 and type 2 subtypes; the former are more common and quite indolent in behavior whereas the latter can be quite aggressive and have a poorer prognosis [26, 27]. The imaging features of both tumors show substantial overlap, including similar degrees of enhancement (both being hypovascular); however, type 2 tumors are more likely to have indistinct margins, infiltrative growth pattern, heterogenous attenuation, and an advanced stage at diagnosis (including renal vein invasion), all of which reflect the more aggressive nature of this tumor [27]
Fig. 1.13
Papillary carcinoma: MRI. (a) This contrast-enhanced CT demonstrates a papillary carcinoma with typical imaging feature for a small papillary tumor: homogenous and relatively hypovascular. (b) This T1WI with fat saturation in the corticomedullary postcontrast phase demonstrates the same feature seen on the CT image: homogeneity and hypovascularity. Just as in CT, one must compare the precontrast and postcontrast images to determine if the lesion actually enhances, in order to distinguish it from a complex cyst. Although absolute numbers cannot be used to quantify enhancement as with CT (>20 HU), subtraction images can be utilized to subjectively determine the presence or absence of enhancement (pre- and postcontrast images must have identical calibration) [21]. (c) This coronal single-shot fast spin-echo (SSFSE) image demonstrates a left upper pole renal mass that contains areas of both T2 hyperintensity and T2 hypointensity. Note the low T2 signal pseudocapsule (arrow), a feature which is frequently seen in papillary RCC [21, 28]. (d) Nephrographic phase imaging in a different patient with papillary carcinoma demonstrates a mildly enhancing but unusually aggressive papillary carcinoma with retroperitoneal adenopathy (arrow). (e) SSFSE sequence in the same patient demonstrates a very low T2 signal mass (long arrow) compared to adjacent renal parenchyma (short arrow). The retroperitoneal adenopathy is also low in T2 signal (arrowhead). Papillary RCC is typically low signal on T1 and T2WI, mostly due to the presence of hemosiderin. Other contributing factors include the presence of a fibrous stalk in the papillary architecture and, to a lesser degree, the presence of calcium [28–32]. (f) This contrast-enhanced CT of a large papillary RCC demonstrates a mass with cystic change and mildly enhancing peripheral soft tissue, typical of this tumor type. (g) T1WI of the same mass shows that the central cystic portion of this tumor is very high in signal consistent with hemorrhagic necrosis. (h) SSFSE sequence of same lesion demonstrates that the central cystic portion is high in T2 signal whereas the solid portion is low in T2 signal. Note the small cyst in the adjacent renal parenchyma (arrow)
Fig. 1.14
Papillary carcinoma: ultrasound. (a) A renal ultrasound on the same patient in Fig. 1.12a demonstrates a mildly hyperechoic, homogenous, exophytic renal mass, which does not involve the renal sinus fat. Currently, there is no technique that has been shown to be accurate in differentiating different subtypes of RCC on ultrasound. In addition, CT and MRI have largely replaced US as the preferred techniques for diagnosing and staging renal cancer [21]. However, ultrasound still has a valuable adjunct role in its ability to distinguish cystic from solid masses, especially for those lesions, particularly papillary carcinoma, which demonstrate only borderline enhancement at CT [21]. On CT hypovascular lesions, especially small ones, can demonstrate very small increases in attenuation from pre- to postcontrast images, which can difficult to distinguish from pseudoenhancement and/or volume averaging (see discussion following Fig. 1.7). In such cases, ultrasound can be more reliable in distinguishing solid from cystic lesions. (b) Power Doppler imaging shows a hypovascular lesion (arrow). In a study by Raj et al. [22], papillary carcinomas were the least likely of all the RCC subtypes to show vascularity. Thus, the demonstration of a hypovascular mass on Doppler ultrasound can further support the diagnosis of papillary carcinoma but with low specificity
Fig. 1.15
Chromophobe carcinoma: CT. (a, b) These contrast-enhanced axial (a) and (b) coronal CT images in the nephrographic phase demonstrate a homogenous, moderately vascular mass arising from the lower pole of the left kidney. Pathology demonstrated a chromophobe carcinoma. Chromophobe carcinoma is generally less vascular than clear cell carcinoma and oncocytoma but more vascular than papillary carcinoma [15]. These tumors tend to be uniform in attenuation, lacking the high degree of necrosis and cystic change characteristic of clear cell carcinoma. Even when large, chromophobe carcinomas tend to lack cystic changes, unlike papillary carcinomas, which are often heterogenous when greater than 3 cm [14]
Fig. 1.16
Chromophobe carcinoma: MRI. (a) This contrast-enhanced MR image in the nephrographic phase demonstrates a left lower pole renal chromophobe carcinoma, which is relatively homogenous in signal, except for a central scar (arrow), which is relatively hypovascular in this phase. Just as on CT, chromophobe carcinomas demonstrate an intermediate degree of enhancement in both the corticomedullary and nephrographic phases, greater than that seen with papillary carcinoma but less than that of clear cell carcinoma [33]. Cochand-Priollet et al. [34] observed that a central fibrous scar is present 23 % of cases of chromophobe carcinoma at histologic analysis (the same study also showed the presence of a central scar in 45 % of oncocytomas, highlighting their similar morphologic, histologic, immunohistochemical, and ultrastructural features) [34, 35]. (b) In this excretory phase image at the same location, the central scar is now hypervascularity (arrow) relative to the rest of the tumor, which demonstrates washout from the nephrographic phase. Kim et al. [36] described a phenomenon seen in renal oncocytomas called segmental enhancement inversion in which the peripheral portion of the lesion is hypervascular on corticomedullary phase images with a relatively hypovascular central lesion, while the pattern reverses in the early excretory phase. Rosenkrantz et al. [35] observed this phenomenon in chromophobe carcinomas and with equal frequency to oncocytomas. (c) This is a different chromophobe carcinoma on postcontrast MRI demonstrating moderate vascularity and a large central hypovascular scar (arrow). (d) The same lesion on this SSFSE image is intermediate in signal with a hyperintense central scar (arrow)
Fig. 1.17
Chromophobe carcinoma: US. (a, b) Coronal and axial images from a contrast-enhanced CT show a large, relatively homogenous, moderately vascular mass in the lower pole of the left kidney consistent with a chromophobe RCC. The mass contains a few punctate calcifications and only small foci of cystic change (arrows). Also note metastatic retroperitoneal adenopathy (asterisk in b). (c) Ultrasound of the same lesion shows a homogenous, relatively hyperechoic, solid mass (arrow). (d) Prominent vascularity is seen within the mass on Doppler imaging. Although the sonographic imaging features in this case are not specific for chromophobe carcinoma, the homogenous appearance and moderate vascularity correlate well with the imaging features on CT
Fig. 1.18
Oncocytoma: CT. (a) This coronal reconstructed image in the late corticomedullary or early nephrographic phase demonstrates a hypervascular mass, with attenuation only slightly lower than that of adjacent renal cortex, which proved to be an oncocytoma after surgical resection. Note that there are small areas of low attenuation (arrows), but otherwise, the tumor is relatively homogenous. Renal oncocytomas are hypervascular tumors that demonstrate a similar degree of enhancement as clear cell carcinomas, which is similar to or slightly less than that of adjacent renal cortex on nephrographic phase images [15]. In general, oncocytomas tend to be more homogenous in attenuation than clear cell carcinomas, which typically demonstrate prominent cystic change and necrosis as previously discussed. In some oncocytomas, a well-defined central stellate scar can be identified in an otherwise homogenous mass [37, 38]. One study by Kim et al. [36] demonstrated the presence of segmental enhancement inversion in small oncocytomas on biphasic CT, in which areas of higher attenuation in the tumor on the corticomedullary phase became lower in attenuation than adjacent areas on the nephrographic phase. In another study by McGahan et al. [39], on biphasic CT, the most common feature of oncocytoma was a mass, which was slightly heterogenous on corticomedullary phase that became homogenous on the nephrographic phase. However, there is significant overlap in the imaging appearances of oncocytomas and clear cell carcinomas, and, thus, they cannot be reliably distinguished on cross-sectional imaging [37, 38]. (b, c) These axial CT images in the corticomedullary phase demonstrate multiple bilateral renal oncocytomas. (b) The left renal mass is almost completely homogenous and isoattenuating to the renal cortex, with only small foci of low attenuation. (c) This image at a different level demonstrates a large, uniformly hypervascular oncocytoma on the left (asterisk) and a smaller yet more heterogenous hypervascular mass on the right, also an oncocytoma (arrow). Note the prominent vessels surrounding the mass on the left. Prominent peritumoral vascularity is often seen with vascular renal neoplasms, especially when these tumors are large [16]
Fig. 1.19
Oncocytoma: MRI. (a) A left lower pole renal oncocytoma on this SSFSE coronal sequence demonstrates a predominantly high T2 signal mass (arrow). Although the mass is higher in signal than renal parenchyma, it is clearly lower in signal than the multiple renal cysts also shown in this image. (b) On corticomedullary phase imaging, this same mass is hypervascular although quite heterogenous (arrow). (c) On the nephrographic phase image, this oncocytoma has become almost completely homogenous (arrow). On MRI, like CT, oncocytomas are hypervascular masses, demonstrating a similar degree of enhancement as clear cell carcinoma. Oncocytomas are generally spherical, well-circumscribed, relatively homogenously enhancing lesions, often becoming more homogenous in the nephrographic phase versus the corticomedullary phase. Occasionally, the central scar may show delayed enhancement [19]. Approximately two thirds of oncocytomas are hypointense to renal parenchyma on T1WI and hyperintense on T2WI [19, 40]. Subacute hemorrhage (high T1 signal), hemosiderin (low T1 and T2 signal), and microscopic lipid (signal loss on opposed phase images) are very rarely seen in oncocytoma, and when seen in a hypervascular renal mass, should favor the diagnosis of clear cell carcinoma over oncocytoma [34, 35]
Fig. 1.20
Oncocytoma: ultrasound. (a, b) Ultrasound of an oncocytoma demonstrates a homogenous mildly hyperechoic mass (arrows) with significant vascularity on color Doppler imaging. Although the imaging features are nonspecific for oncocytoma, these tumors are more likely to demonstrate vascularity on Doppler imaging than all other renal cortical tumors except clear cell carcinoma [22]. In addition, the homogenous appearance and prominent vascularity correlate well with the features of oncocytoma typically seen on CT and MR
Fig. 1.21
Angiomyolipoma: CT. (a) This coronal image from a contrast-enhanced CT demonstrates a small lesion (arrow) in the upper pole of the right kidney. This lesion, which measures −75 HU, appears similar in attenuation to adjacent retroperitoneal fat, and is, thus, diagnostic of a renal angiomyolipoma (AML). AML is a type of renal hamartoma that, as the name implies, contains variable amounts of blood vessels, smooth muscle, and fat [41]. The lesion in this example is predominantly fatty in attenuation, which is a common appearance for small AML. (b) This contrast-enhanced CT demonstrates a 10 cm mass arising from and partially surrounding the right kidney. The mass contains areas of gross fat, along with heterogenous areas of soft tissue and prominent, irregularly shaped blood vessels (arrow), which is consistent with AML. Prominent tumor vascularity is a common feature of AML, as seen in this patient. These tumor vessels are characteristically tortuous, lack normal vessel tapering, and due to an incomplete elastic layer in the wall are predisposed to aneurysm formation (arrow) and hemorrhage after minimal or no trauma [41]. (c, d) Noncontrast and contrast-enhanced CT scans, respectively, demonstrating a small exophytic lesion (arrow in c) arising from the upper pole of the left kidney. The lesion is slightly hyperattenuating to renal parenchyma on the noncontrast images (lesion measures 45 HU compared with 30 HU for renal parenchyma), and no gross fat is detectable in this lesion. Subsequent partial nephrectomy revealed a smooth-muscle predominant AML with minimal fat. Approximately 3–4 % of AMLs contain insufficient fat to be detected on cross-sectional imaging [42


Related posts:

Stay updated, free articles. Join our Telegram channel
Full access? Get Clinical Tree
