Vinay V. Belaval, Onkar B. Auti, Nilay Nimbalkar, Samruddhi Sonawane
Renovascular disease (RVD)
Definition
Renovascular disease refers to conditions affecting renal arteries and, to some extent, renal veins which eventually result in development of secondary hypertension.
Causes
There are various causes of RVD, which are enlisted below:
• Atherosclerotic renal artery stenosis (RAS) – most common cause, accounting for two-thirds of all cases.
• Fibromuscular dysplasia (FMD) – medial fibroplasia is the most common type.
• Vasculitis: Various vasculitis can affect renal arteries, the most common being polyarteritisnodosa (PAN). Other common vasculitis include Takayasu arteritis, systemic lupus erythematosus (SLE)-associated vasculitis and drug-associated vasculitis.
• Posttrauma: Renal artery dissection, thrombosis, segmental renal infarct and subcapsular collections (causing Page kidney) can occur after high-grade trauma, which result in renovascular hypertension. Page kidney refers to hypertension developing in renal subcapsular collections causing compression of renal parenchyma and subsequent activation of rennin–angiotensin system.
• Aortic pathologies like thrombus and dissection extending into renal arteries – can cause RAS and RVD.
• Perirenal fibrous band causing chronic extrinsic compression of the kidney (similar mechanism to Page kidney).
• Renal vein pathologies like renal vein stenosis, renal vein thrombosis and posttraumatic renal vein injuries.
Risk factors
These are the conditions which increase the risk of RAS and secondary hypertension. These include:
• Older age
• Smoking
• Dyslipidemia
• Diabetes mellitus
• Smoking
• Substance abuse
• Systemic hypertension – Preexisting hypertension accelerates the atherosclerotic disease process and hence further contributing to RAS.
Imaging modalities and techniques
Imaging modalities like ultrasound (USG) with renal artery Doppler, CT angiography (CTA) and MR angiography (MRA) play crucial role in diagnosis of renovascular disorders like RAS and other renal vascular pathologies. These imaging modalities will be discussed under protocol (technique), advantages and disadvantages.
USG with renal doppler
USG abdomen: It should be done to document renal size (length, width and parenchymal thickness), renal parenchymal scars and perirenal collections and to look for any suprarenal, paraaortic or perivesical mass lesions (to exclude adrenal or extra-adrenal pheochromocytoma).
Renal artery Doppler: Colour Doppler and spectral Doppler evaluation of abdominal aorta, bilateral main renal arteries (proximal, mid and distal segments) and intraparenchymal renal arteries (in upper, mid and lower poles of kidney) should be done.
Various approaches are available for imaging of renal arteries, including anterior approach (a supero-inferior sweep is made using curvilinear probe with patient in supine position to identify number and origin of main renal arteries), oblique approach (renal artery assessment in semi-decubitus position) and coronal approach (patient lying in true lateral decubitus; good for assessment of main renal artery).
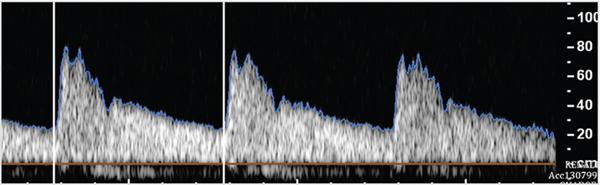
Renal artery Doppler parameters to be measured are peak systolic velocity (PSV), end diastolic velocity (EDV), resistive index (RI), acceleration time (AT), acceleration index (AI) and prerenal abdominal aorta PSV. RI is the ratio of difference between PSV and EDV, divided by PSV {RI = (PSV − EDV)/PSV}. Normal renal arteries show low-resistance waveform with continuous forward flow in diastole (Fig. 10.18.1.1). AT is the time taken from start of systole to peak systole. Renal arteries have rapid systolic peaks. AI is the slope of systolic upstroke.
Normal values of renal artery Doppler parameters include:
• PSV in main renal artery: 60–100 cm/sec
• RI: 0.60–0.70
• AT: <70 ms or <0.07 s
• AI: >300 cm/s2
• Ratio of main renal artery PSV to prerenal abdominal aortic PSV <3.5.
Renal vein Doppler: Grey scale and colour Doppler evaluation of both renal veins are necessary in evaluating suspected renovascular disease. Right renal vein has short course. Left renal vein has longer course with variable preaortic, retroaortic or circumaortic course. Both renal veins show continuous flow and show phasic variations with breathing. Preaortic segment of left renal vein usually shows smaller caliber and turbulent flow due to aortic pulsations.
Contrast-enhanced USG (CEUS): CEUS is done using USG contrast agents and can be used for evaluation of vascular and renal parenchymal pathologies. CEUS with use of harmonic imaging improves the performance of routine renal Doppler by enhancing the visibility of renal arteries, thus helping to rule out RAS. It can also be used to diagnose renal artery occlusion and renal vein thrombosis. CEUS helps in diagnosing small focal renal infarcts (avascular, wedge-shaped areas in parenchyma). Quantitative analysis of contrast kinetics can be done using time–intensity curves with parameters like time to peak and rising time using inbuilt software. CEUS can even be performed in patients with acute or chronic renal failure, as kidneys do not excrete USG contrast agents.
Advantages of USG with renal Doppler: It is the most widely available and affordable imaging modality for RVD. Hence, it is the first-line imaging investigation in suspected RVD. No risk of radiation is another advantage. CEUS can be used even in acute or chronic renal failure as USG contrast agents are not excreted by kidneys.
Disadvantages of USG with renal Doppler:
• Excessive bowel gas (obscuring the vessel details)
• Obesity
• Anatomical variants (like high origin or multiple accessory arteries) are difficult to identify in all patients.
• Extensive atherosclerotic calcifications can preclude adequate luminal and Doppler assessment.
• Operator-dependent: The sensitivity of Doppler depends on the experience of the operator.
• Patients with breathing difficulty – These patients will not be able to hold their breath long enough for Doppler assessment.
Fig. 10.18.1.1Normal renal artery waveform showing low-resistance waveform with sharp peak in systole and continuous diastolic flow.
CT angiography
CTA provides excellent volumetric data of renal vascular tree. CTA is the noninvasive imaging modality for confirmation and grading of RAS.
CTA Protocol: Prior patient preparation is necessary with 4-hour fasting, ascertaining normal renal function (normal serum creatinine) and ensuring full bladder. Water is used as negative oral contrast as positive oral contrast will limit postprocessing capabilities. Plain helical CT abdomen is obtained from domes of diaphragm to groin. Large bore (18 G) intravenous cannula is put for faster rate of contrast administration. Low-osmolar or iso-osmolar iodinated contrast (1.5–2 mL/kg body weight) is injected at a rate of 4–5 mL/s followed by saline chase. Arterial phase is triggered with bolus tracking (smart prep) on arrival with peak of contrast in aorta (,18 s from contrast injection). Venous phase is obtained at,60 s from the time of contrast injection. Delayed urographic phase (10 min after contrast injection) is obtained to assess collecting system.
CTA assessment:
• Plain CT abdomen: Look for renal size (length, width and parenchymal thickness), renal parenchymal scars and perinephric space and for any atherosclerotic changes in juxtarenal aorta and renal arteries. Dense atherosclerotic calcifications can limit adequate luminal assessment. Look for integrity of renal artery stents (fracture or migration).
• Arterial phase (CTA) – nephrogram phase:
• Look for symmetry and degree of renal cortical enhancement.
• Look for atherosclerotic changes in abdominal aorta and renal arteries.
• Look for accessory renal or anomalous high origin of renal arteries.
• Assess percentage and length of stenosis and its location. Look for poststenotic dilatation.
• Rule out changes of FMD: ‘string of pearls’ appearance in mid and distal renal artery in medial type of fibroplasia (most common type) and long segment narrowing in intimal-type of fibroplasia.
• Look for changes of vasculitis like wall thickening, focal or diffuse narrowing and aneurysms.
• Endovascular stents: Stents placed for RAS should be assessed for their integrity (stent fracture or migration) and patency. In-stent thrombosis in acute postoperative period and in-stent restenosis (due to neointimal hyperplasia) in the chronic setting are well-known complications. Stent assessment should be done in both soft and high kernel (bone algorithm) window reconstructions.
• Venous phase:
• Symmetry and degree of renal parenchymal enhancement has to be assessed.
• Assess number and patency of renal veins.
• Look for any retroaortic or circumaortic course of left renal vein. Normally left renal vein has preaortic course.
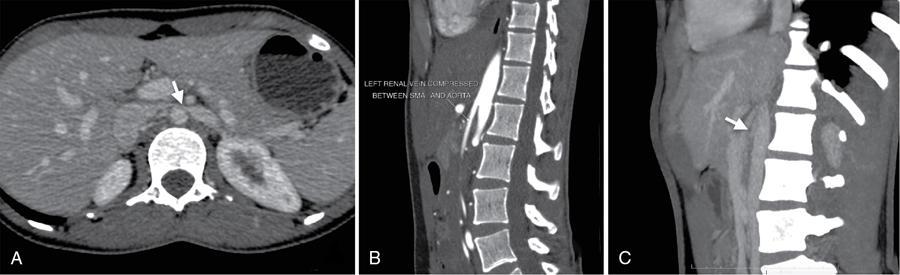
• Look for features of ‘Nutcracker syndrome’ (Fig. 10.18.1.2) – it is characterized by compression of left renal vein between aorta and proximal superior mesenteric artery resulting dilated prestenotic segment and left ovarian/left parauterine veins.
• Vasculitis-related enhancement of aortic or renal arterial wall thickening is best seen in venous phase. Enhancement indicates active phase of vasculitis.
• Delayed urographic phase: Symmetry and degree of contrast excretion into bilateral collecting systems, ureters and urinary bladder should be assessed.
Advantages of CTA: Excellent spatial resolution, thin isotropic volumetric data and various postprocessing tools are advantages of CTA over other modalities. Postprocessing tools like maximum intensity projecting (MIP) and curved multiplanar reconstruction are useful in renal vascular assessment. CTA scores over MRA in stent evaluation and postvascular reconstructive surgery.
Disadvantages of CTA: Iodinated contrast cannot be used in patients with altered renal function. Radiation exposure is a known risk with CT.
Noncontrast and contrast-enhanced MRA provide great details of renal vasculature, mainly the main renal vessels. Intrarenal arteries are relatively less well imaged on MRA than CTA.
MRA Protocol:
1. 3-Plane gradient echo localizers.
2. Axial and coronal T2-weighted images of abdomen – to assess renal morphology.
3. Noncontrast MRA uses time of flight (TOF) or phase contrast (PC) sequences to visualized renal arteries. These sequences are flow-sensitive. Patients with sluggish flow in renal arteries are not well imaged by these sequences. In these sequences, flowing blood appears bright and stationary tissues appear dark.
4. Contrast-enhanced MRA uses gadolinium (Gd)-based contrast media (0.1–0.2 mmol/kg body weight) using 3-D T1-weighted images. Bolus tracking can be done by giving a test bolus (to determine contrast travel time) or by using time-resolved imaging (TRICKS – time-resolved imaging of contrast kinetics). This is followed by multiple coronal 3-D dynamic acquisitions in arterial and venous phases. Delayed urographic phase is done at 8–10 minutes.
Patients with sluggish flow or small caliber vessels are less suitable for evaluation by noncontrast MRA as it is flow-sensitive technique. In these cases, contrast-enhanced MRA is helpful.
MRA assessment: Assessment of renal vasculature and renal parenchyma is similar to CTA.
Advantages of MRA: It is useful in patients with renal dysfunction. No risk of radiation exposure. Hence, it is the ideal modality for imaging in young hypertensive patients.
Disadvantages of MRA:
• Remote risk of nephrogenic systemic fibrosis (NSF) in patients with low glomerular filtration rate.
• Not ideal in renal artery stent evaluation due to blooming artefacts.
• Limited evaluation of intrarenal portions of renal arteries on noncontrast MRA.
Pathologies
Renal artery stenosis
RAS refers to focal or diffuse narrowing of the renal artery, from various causes. Renovascular hypertension is defined as systemic hypertension developing secondary to renal arterial narrowing or occlusive pathology. It is commonly seen in younger women (often due to FMD) and older men (due to atherosclerotic RAS).
Hemodynamically significant RAS activates renin–angiotensin mechanism, which in turn leads to constriction of efferent arterioles and subsequent hypertension. Early diagnosis and treatment of RAS can help in controlling the hypertension.
Causes of RAS
• Atherosclerosis: Atherosclerosis is the most common cause of RAS accounting for two-thirds of all cases. It is typically seen in older age and affects proximal 2 cm of the main renal artery. Bilateral RAS is seen in 30% of patients.
• FMD: FMD is the second most common cause of RAS. It is typically seen in younger population with female sex predilection and affects mid and distal portion of renal artery. Bilateral FMD is seen in two-thirds of patients.
• Vasculitis: Large vessel vasculitis (Takayasu arteritis) and medium vessel vasculitis (PAN) can cause RAS with progressive narrowing of renal arteries.
• Neurofibromatosis-1 (NF-1): NF-1 involvement of renal arteries can range from RAS, aneurysms or occlusion. NF-1 associated stenosis is seen in relatively younger population (<50 years) with sparing of origin and involves long segment of the artery, extending into segmental and intrarenal branches. Bilaterality is seen in 32% of patients.
• Posttraumatic sequalae: Traumatic involvement of renal arteries varies from laceration, dissection, thrombosis and pseudoaneurysm. RAS can develop in the sequalae to trauma.
• Other rare causes: Renal artery entrapment by crus of diaphragm or psoas muscle can be seen in case of anomalous high origin of renal arteries.
Imaging appearances
USG: USG of abdomen with Doppler evaluation of renal arteries and abdominal aorta is the first line of investigation in patients suspected with RAS (Table 10.18.1.1).
• USG of abdomen: Look for renal size (length, width and parenchymal thickness), renal cortical scars (indirect evidence of old renal ischaemia or infection) and mass lesions in suprarenal, paraaortic and perivesical regions (pheochromocytoma or paragangliomas). Reduced renal size with parenchymal thinning is seen in chronic kidney disease, with RAS being one of the common causes for end-stage renal disease.
• Doppler evaluation of abdominal aorta and renal arteries: Abdominal aorta is assessed for its size, any atherosclerotic changes and PSV in its prerenal segment. Doppler assessment of bilateral main renal arteries is done at its origin, proximal and distal segments. Doppler assessment of intrarenal branches should also be done. Colour and spectral Doppler assessment of RAS is shown in Fig. 10.18.1.3.
There are various direct and indirect Doppler signs in RAS as described below:
Direct signs at the site of stenosis:
• Renal artery PSV: >180 cm/s
• Renal artery PSV to abdominal aorta PSV ratio: >3.5
• Colour aliasing at the site of stenosis (indicating turbulence of flow)
• Absent colour and spectral signals in case of complete occlusion
Indirect signs distal to the site of stenosis:
• Pulsusparvus et tardus waveform (low velocity, sluggish flow)
• Increased AT (time to peak systole): >70 ms
• Decreased AI (slope of systolic upstroke): <300 cm/s2
Sensitivity and specificity of Doppler in detecting RAS are 95% and 90% using renal artery PSV of >180 cm/s as criteria. Therefore, renal artery Doppler serves as screening modality in evaluation of newly diagnosed hypertension to rule out RAS. Recommended reporting format of renal Doppler assessment is provided in Appendix I.
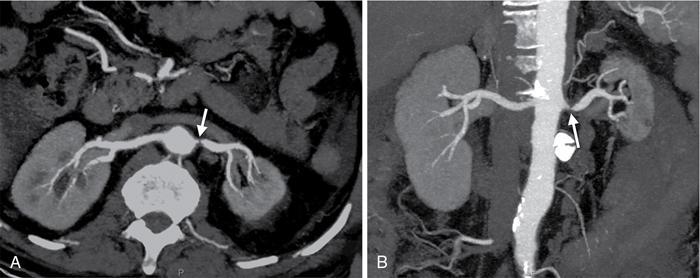
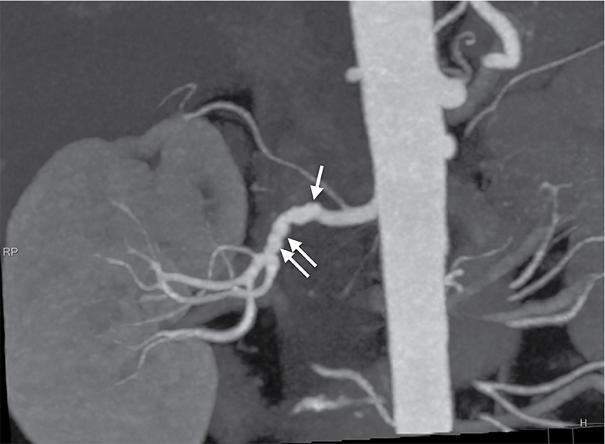
CTA: It provides excellent spatial resolution of the abdominal aorta and entire renal arterial tree. RAS due to atherosclerosis is identified by presence of soft, calcific or mixed plaques in either eccentric or concentric distribution in proximal 2 cm with renal artery diameter reduction (Fig. 10.18.1.4A and B). RAS due to medial type of FMD appears as ‘string of beads’ pattern in mid and distal main renal artery with alternate areas of narrowing and dilatation (Fig. 10.18.1.5). CT signs of haemodynamically significant stenosis include poststenotic dilatation, renal parenchymal atrophy and reduced cortical enhancement. Sensitivity and specificity of CTA in diagnosing RAS is 96% and 99%, respectively.
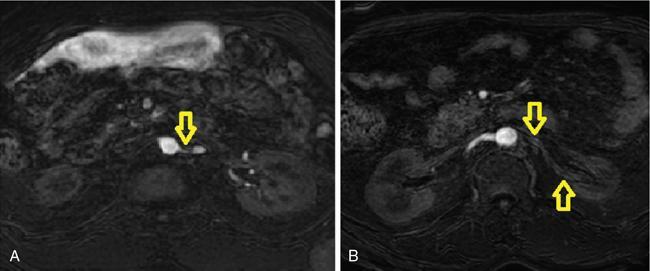
MRA: It is useful in patients with contraindications for intravenous iodinated contrast and in patients with elevated serum creatinine. MRA findings in RAS are similar to those in CTA. Noncontrast MRA can detect RAS in main renal arteries with limited evaluation of segmental and intrarenal branches (Fig. 10.18.1.6A and B). Contrast-enhanced MRA helps in better delineation of entire renal arterial tree. Sensitivity and specificity of noncontrast and contrast-enhanced MRA are 94% and 85% and 97% and 93%, respectively.
TREATMENT:
• Endoluminal stent placement is superior to balloon angioplasty in atherosclerosis-related RAS.
• Percutaneous angioplasty in preferred in FMD.
• Surgical bypass is preferred in complicated RAS, not amenable for above treatments.
Fig. 10.18.1.4CT renal angiography images in maximum intensity projection (MIP) reconstructions in (A) axial and (B) coronal planes showing critical stenosis (arrows) of left renal artery at origin.
Fig. 10.18.1.5MIP images of right renal artery in a case of fibromuscular dysplasia (FMD) showing ‘string of beads appearance’ as alternating areas of narrowing and dilatations (arrows).
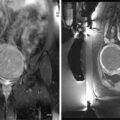
Fig. 10.18.1.6Noncontrast MR angiography showing severe stenosis of ostioproximal left renal artery [arrow in (A)] and another patient showing loss of signal in left renal artery [arrows in (B)], suggesting total occlusion. (Source: Courtesy of Dr. Sreenath Sethumadhavan.)
Renal artery thrombosis
Acute renal artery thrombosis is a medical emergency, often presenting with acute flank pain and haematuria. Serum lactate dehydrogenase is the most sensitive serological marker for renal infarction.
Causes
• Spontaneous thrombosis: in various hypercoagulable states.
• Atherosclerotic plaque rupture.
• Extension of aortic thrombus.
• Embolus from underlying heart conditions like valvular heart disease and ischaemic dilated cardiomyopathy.
• Renal artery dissection with thrombosis of false lumen.
• Sepsis.
• Substance abuse like cocaine.
Imaging appearances
USG: USG is less sensitive as compared to CT and MRA. USG findings include:
• Absent colour flow signals in case of complete thrombotic occlusion.
• Turbulent flow (colour aliasing) in case of partially occluding thrombus with increased velocity flow at the site of narrowing by thrombus and low velocity flow distally.
• Focal renal parenchymal infarcts are seen as hypoechoic areas with absent colour flow.
• CEUS can show absent opacification of vessel with avascular, wedge-shaped parenchymal segmental infarcts.
CTA: CTA helps in delineating the location and extent of thrombus, and also helps in identifying the underlying etiology. CT findings include:
• Filling defect in renal artery causing partial or complete occlusion.
• Identifies underlying atherosclerotic disease and vulnerable atherosclerotic plaques as rupture of vulnerable plaques is the initial event in most of the fresh thrombus formation.
• Focal infarcts are seen as wedge-shaped nonenhancing areas in the renal parenchyma (Fig. 10.18.1.7).
• Global nonenhancement of the kidney can be seen in completely occluding thrombus.
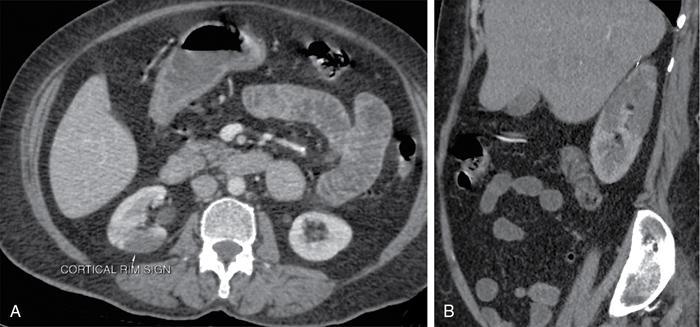
• ‘Cortical rim sign’ (Fig. 10.18.1.7) refers to thin rim of preserved subcortical enhancement in patients with renal infarcts due to renal capsular perforating vessels.
MRA: MR findings are similar to CT with renal infarcts appearing as wedge-shaped areas of T2 hyperintense signals.
TREATMENT: Thrombolysis or thrombectomy can be done in acute thrombosis. Stent placement can be done if there is underlying vulnerable atherosclerotic plaque or dissection.
Fig. 10.18.1.7Renal infarct with cortical rim sign on CT.
Renal vein thrombosis
Acute renal vein thrombosis can be due to bland or tumour thrombus. Patients present with haematuria and back pain. Left renal vein is more commonly involved than right.
Bland renal vein thrombosis
CAUSES:
• Spontaneous thrombosis: in various hypercoagulable states
• Glomerulonephritis
• Extension of thrombus from IVC or gonadal veins
• Trauma
• Collagen vascular diseases
• Sepsis
Imaging appearances
USG: USG findings include:
• Enlarged kidney with loss of cortico-medullary differentiation.
• Absent colour flow in renal vein with reversed diastolic flow in main renal artery.
• Hypoechoic to echogenic filling defect in renal vein causing luminal expansion.
CTA: CTA helps in delineating the location and extent of thrombus. Superior extent of thrombus into IVC should always be assessed. CT findings include:
• Nonenhancing filling defect in renal vein with luminal expansion in acute thrombosis (Fig. 10.18.1.8A and B).
• Bulky kidney with perinephric and renal sinus oedema, representing venous congestion.
• Delayed parenchymal enhancement.
• Multiple venous collaterals are seen, in case of chronic thrombosis.
MRA: Absence of normal T2 flow void in an expanded renal vein should raise the suspicion of acute renal vein thrombosis. Noncontrast MRA will show absent flow in the occluded vein. Contrast MRA is superior, with accurate identification of extent of thrombus.
TREATMENT: Thrombolysis and anticoagulant therapy can be done in acute thrombosis. IVC filter can be placed in patients with recurrent thrombosis, to prevent cranial migration of the thrombus.
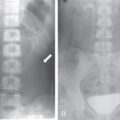
Fig. 10.18.1.8(A) A case of left renal vein thrombosis as hypodense filling defect (arrows) in left renal vein causing total occlusion. (B) Another case of left renal vein thrombosis (block arrow) is also shown. Also note thrombosis of segmental renal vein (arrowhead).
Tumour thrombosis of renal vein
It refers to extension of various neoplasms into renal vein.
CAUSES:
• Renal cell carcinoma: is the most common neoplasm with tumour thrombus in renal vein.
• Other rare tumours: Leiomyosarcoma of IVC, adrenal cortical carcinoma, Wilm’s tumour, renal angiomyolipoma and renal oncocytoma.
• Primary leiomyosarcoma of renal vein
Imaging appearances
USG: USG findings include:
• Heterogeneous filling defect in renal vein in continuity with the renal neoplasm causing luminal expansion and showing variable amount of internal vascularity.
• Associated renal mass can be identified.
CTA: CTA helps in identifying the primary renal neoplasm and the extent of thrombus. CT findings include:
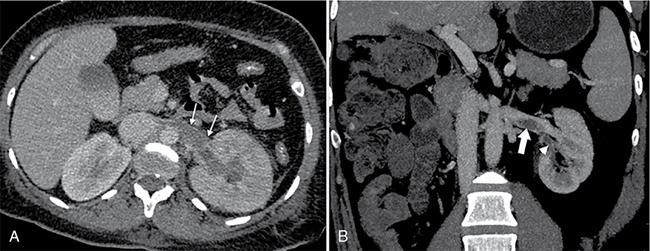
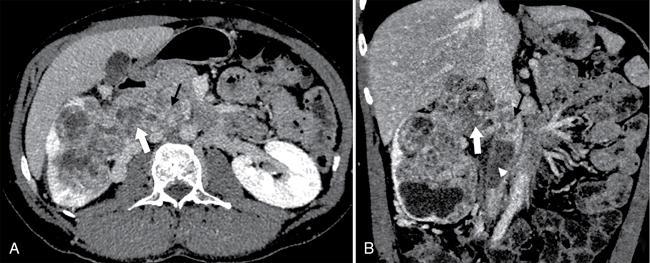
• Heterogeneously enhancing filling defect in renal vein with luminal expansion and having continuity with the renal mass (Fig. 10.18.1.9).
• Heterogeneously enhancing renal mass.
• Multiple venous collaterals are seen, in case of subacute to chronic tumour thrombosis.
Renal vein leiomyosarcoma will appear as heterogeneously enhancing filling defect in the renal vein with or without renal parenchymal involvement. The intravascular component of the tumour is larger as compared to intrarenal component, which helps in differentiating it from primary renal cell carcinoma with tumour thrombus in renal vein.
MRA: Contrast-enhanced MRA will show heterogeneously enhancing tumour thrombus in renal vein and the primary renal neoplasm.
TREATMENT: Partial or total nephrectomy with tumour thrombectomy is the preferred treatment.
Fig. 10.18.1.9(A) Axial and (B) coronal CT images of right kidney showing heterogeneously enhancing mass lesion infiltrating renal vein (arrows) and extending into the IVC, suggesting tumour thrombosis. Also note nonenhancing thrombus in the IVC (arrowhead).
Renal artery aneurysms (RAAs)
RAAs can be true aneurysms or pseudoaneurysms. True aneurysms are due to weakening of vessel wall with subsequent wall protrusion and aneurysm formation. Pseudoaneurysms are due to direct or indirect vessel wall injury with extravasation of blood, contained by the adventitia or surrounding soft tissue. Most common site of aneurysm is main renal artery bifurcation. Intraparenchymal aneurysms are common with vasculitis.
CAUSES:
• True aneurysms are often seen incidentally and can be associated with underlying hypertension.
• Pseudoaneurysms:
• Penetrating trauma
• Iatrogenic: after attempted stenting
• Vasculitis
• Substance abuse (amphetamine)
• Infectious arteritis (mycotic RAAs)
Only gold members can continue reading. Log In or Register to continue