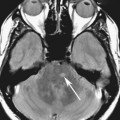
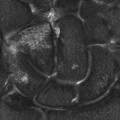
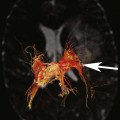
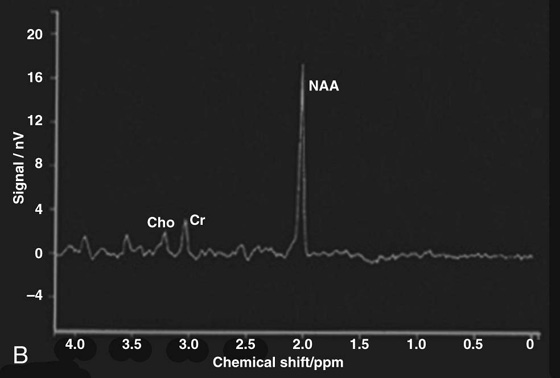
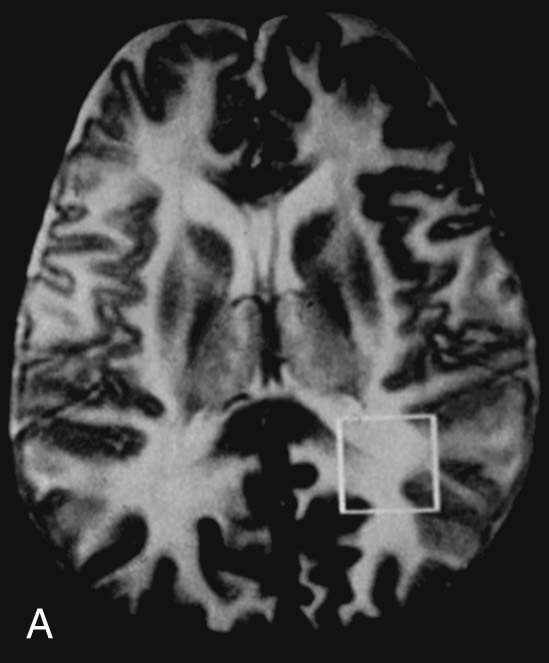
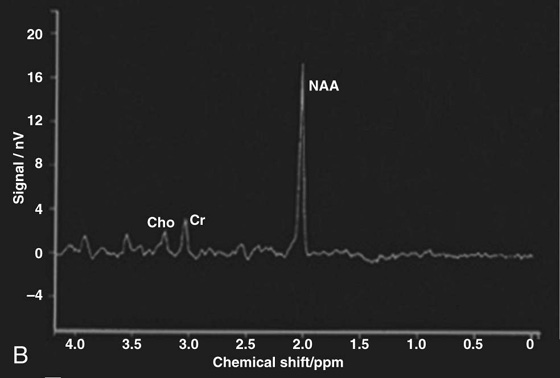
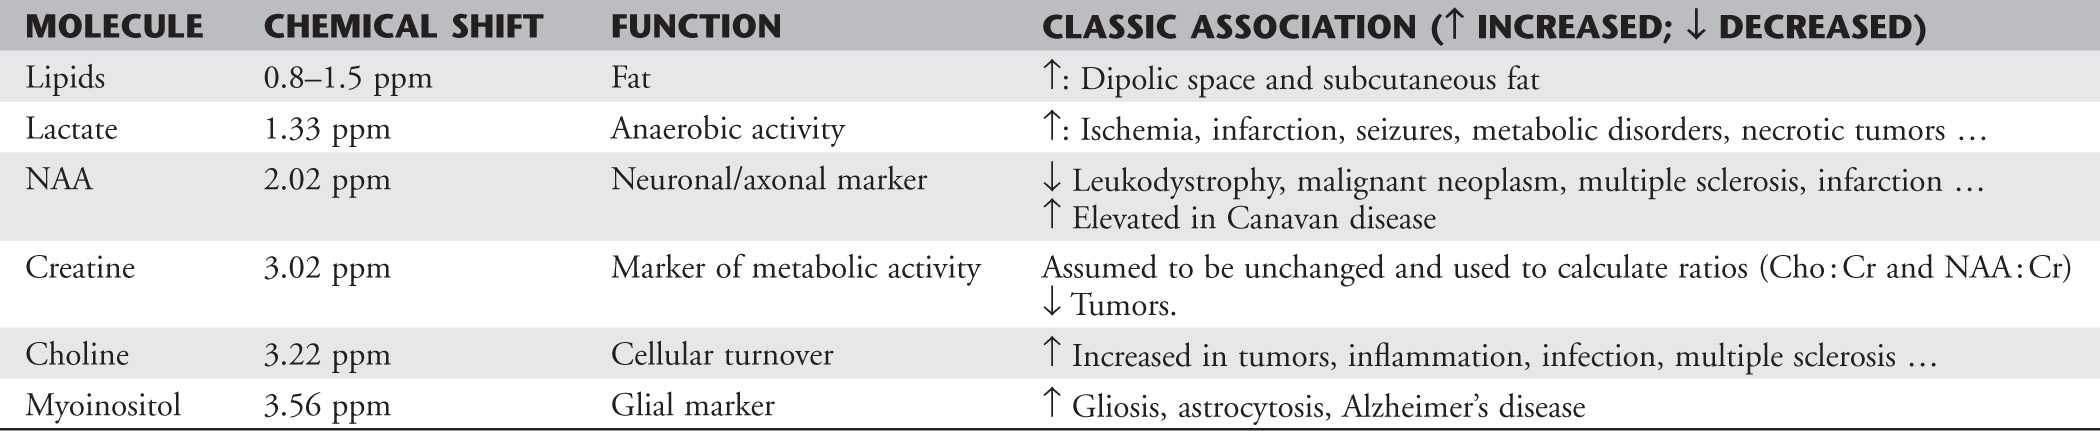
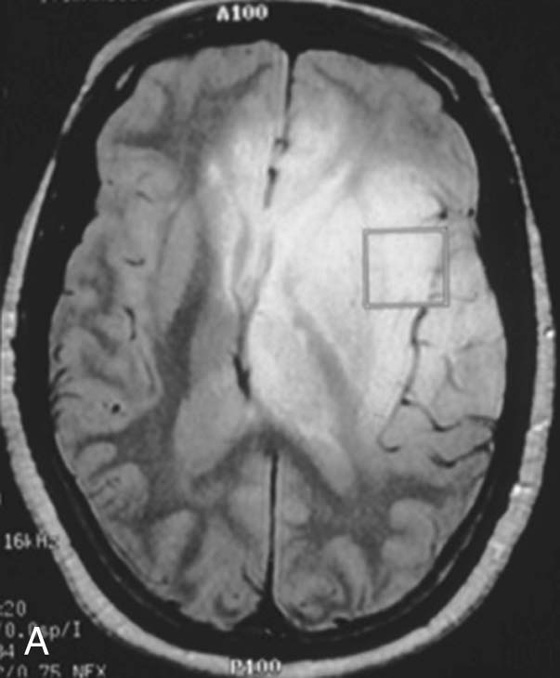
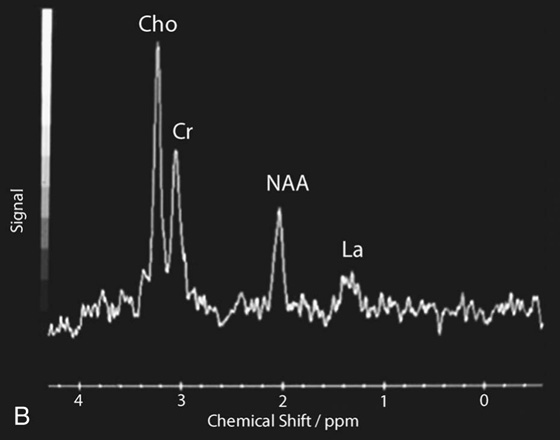
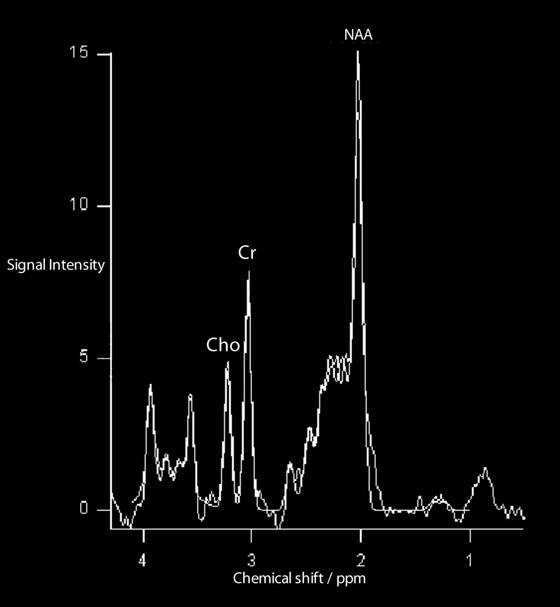
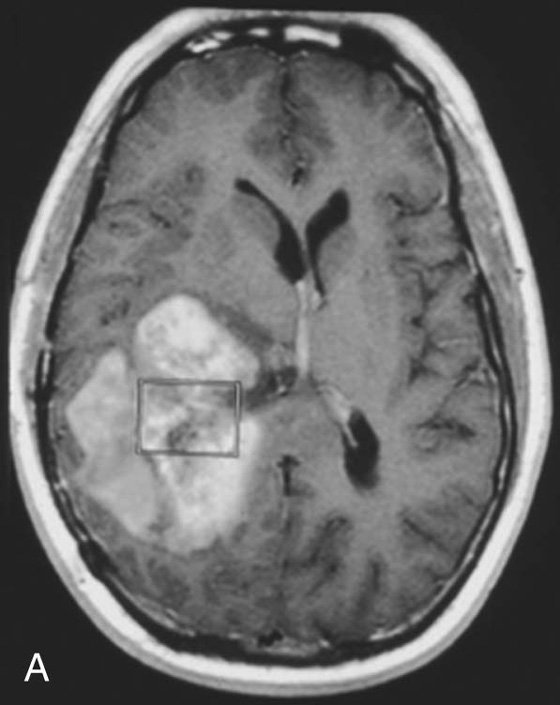
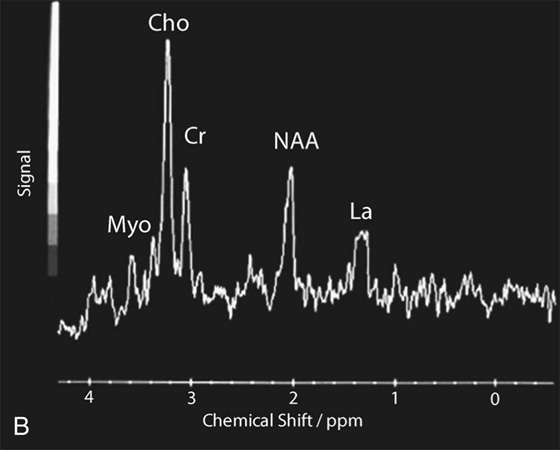
Chapter 16 Wells I. Mangrum, Allen W. Song, and Jeffrey R. Petrella 1. What are differential considerations for the findings in A? 2. What type of graph is represented in B? 3. What is N-acetyl aspartate (NAA)? 4. Would the NAA chemical shift peak of 2.0 ppm change if the magnet field strength was increased to 3 Tesla? 5. What is the diagnosis? FIGURE 1A. Axial T2-weighted magnetic resonance (MR) image. There is diffusely increased T2 signal in the white matter, including the subcortical white matter. The square overlying the left parietal white matter marks the area characterized by spectroscopy. FIGURE 1B. Point-resoved single-voxel spectroscopy (PRESS) waveform (time to echo [TE] = 30 msec). NAA, choline (Cho), and creatine (Cr) peaks are labeled. The NAA peak is markedly elevated with respect to the choline and creatine peaks. 1. There is diffuse white matter T2 prolongation. Broad differential considerations include dysmyelinating conditions (Alexander disease, Canavan disease, metachromatic leukodystrophy), demyelinating conditions (acute disseminated encephalomyelitis or multiple sclerosis), infections (human immunodeficiency virus), and toxicities (chemotherapy or radiation therapy). 2. This is a spectroscopy waveform. The voxel of interest is demarcated by the square shown in the left parietal lobe in Figure 1A. 3. NAA is a molecule associated with neurons and axons. Its function is unknown. It is used as a marker of neurons/axons. 4. No, the chemical shift does not change with field strength. NAA has a chemical shift of 2.0 parts per million (ppm) at 1.5 Tesla and 3 Tesla. Similarly, choline is always 3.2 ppm and lactate is always 1.33 ppm. Shift peaks are useful to memorize as most charts do not come labeled. (I labeled this one for you to be merciful.) 5. The spectroscopy waveform is very characteristic of Canavan disease. The key finding is the marked elevation of the NAA peak. Canavan disease is one of the few conditions that result in an elevation of the NAA level. There is an elevation in NAA because of a deficiency in the myelin synthesis pathway.1 Canavan disease. Canavan disease is an autosomal recessive dysmyelinating disease that is thought to result from a deficiency of aspartoacylase, leading to elevated N-acetyl aspartate (NAA) levels in the brain, serum, and urine. Patients present in the first year of life with macrocephaly and spasticity. Death usually occurs within the first few years of life. Imaging findings include diffuse, symmetrical increased T2 signal in the cerebral subcortical and deep white matter. The elevated NAA peak on spectroscopy is a characteristic finding of Canavan disease.1 Instead of producing an image, magnetic resonance spectroscopy (MRS) creates a waveform on a graph. The waveform represents the chemical environment of protons in the voxel of interest. Knowing the chemical environment can be useful to help make the diagnosis. Spectroscopy identifies the chemicals in a voxel by measuring the effect that these chemicals have on a proton’s precession frequency. A proton in pure free water precesses at a frequency defined by the Larmour equation (at 1.5 Tesla, the precession frequency of a proton in water is ~64 MHz). If that proton is not free in water but instead in a chemically different molecule, such as NAA, then the precession frequency of that proton is slightly altered. This alteration of frequency is measured in units of Hertz and is therefore expressed in parts per million (ppm) with respect to the precession frequency of water (which is measured in MHz). For example, the chemical shift for NAA is 2.02 ppm. This means that a proton in NAA in a 1.5-Tesla magnet has a precession frequency that is shifted from that of water by 128 Hz (64 million × 2 per million = 128). Each molecule has a specific chemical shift: the chemical shift of NAA is 2.02 ppm, lactate is 1.33 ppm, choline is 3.22 ppm, and so forth. By measuring the precession frequency of a proton, and by calculating the chemical shift, one can determine the relative quantity and type of molecules in a given voxel. This molecular environment is represented graphically by the spectroscopy waveform. The x-axis of the waveform represents the chemical shift in ppm. The y-axis measures the relative number of protons with that chemical shift. The area under the curve of each peak represents the relative concentration of the molecule of interest. In order to interpret MRS, one needs to understand the function of the different molecules being measured (Table 1).2,3 NAA is synthesized in the mitochondria of neurons, and its function is unknown. Clinically, NAA serves as a marker for the presence of neurons, including neuronal axons in white matter. Creatine (Cr) is used clinically as a marker for energy metabolism. Low levels of creatine suggest that the area of interest is highly metabolically active. Creatine is also often assumed to be stable and is used for calculating metabolite ratios (e.g., Cho : Cr and NAA : Cr). Choline (Cho) is found in the cell membrane. It serves as a marker for the cellular turnover of a lesion. Choline is elevated both in the setting of increased cellular production, such as in a tumor, and in the setting of cellular breakdown, such as in leukodystrophy and multiple scleorsis. Lactate is a marker for anaerobic metabolism. Normally, lactate levels in the brain are so low that they cannot be measured by spectroscopy. Increased anaerobic metabolism, such as with ischemia or tumor necrosis, results in lactate peaks. Myoinositol is a sugar. It is absent from neurons but present in glial cells. It is used as a marker for glial proliferation or an increase in glial size. Lipids are markers for fat, as is seen in the subcutaneous tissues or in the diploic space of the calvarium. It is important to know a few of the limitations of spectroscopy. First, the chemical levels are often not specific. For example, a novice may see a lactate peak in a lesion and use that information to conclude that the lesion is due to an infarct. While it is true that lactate peaks can be seen in infarcts, there are many other conditions that can cause lactate peaks, including tumors, seizures, metabolic conditions, inflammatory conditions, and so forth.4 Similarly, an increase in the choline level may cause one to conclude that the lesion in question is a tumor. However, increased choline levels are also noted in infarctions, inflammation, and multiple sclerosis.4 One must therefore always interpret the MRS finding in the context of conventional magnetic resonance imaging (MRI) findings. A second limitation to spectroscopy is low signal-to-noise ratio; this is because we are measuring chemicals with extremely low concentrations. To overcome the low signal-to-noise ratio, voxel size needs to be large (i.e., on the order of centimeters), resulting in low spatial resolution. This can at times be a limiting factor clinically, where we are often concerned about lesions smaller than 1 cubic centimeter in size. FIGURE 2A. Axial fluid-attenuated inversion recovery (FLAIR) image of brain. Increased T2 signal is centered in the left frontal lobe but seen to extend into the left basal ganglia and via the corpus callosum into the right frontal lobe and basal ganglia. There is relative preservation of the normal brain architecture. A small amount of mass effect with left-to-right midline shift is noted. The square overlying the left perisylvian region demarcates the single voxel measured in the corresponding spectroscopy waveform. FIGURE 2B. PRESS waveform (TE = 30 msec). Spectroscopy images demonstrate elevation of the Cho : Cr ratio and decrease of the NAA : Cr ratio. A small, poorly defined peak at 1.2 to 1.4 ppm is consistent with a lactate peak. Gliomatosis cerebri; the elevated choline and lactate portend a poor prognosis.5 Gliomatosis cerebri is a diffusely infiltrating neoplasm associated with a poor prognosis that occurs predominantly in middle-aged adults (40s to 50s). MRI usually reveals diffuse and contiguous infiltration of the white matter of at least two lobes that is isointense on T1-weighted images and hyperintense on T2-weighted images. The overlying brain structure is preserved. Frequently, there is bihemispheric extension through the corpus callosum into the basal ganglia.5,6 Gliomatosis cerebri usually has a decrease in the NAA peak on spectroscopy.5 The choline peak can be variable. There is some evidence that elevation of the choline peak is inversely related to patient prognosis.5,7 Elevation of the lactate peak is another concerning finding.5 In order to know whether a peak is abnormally elevated or decreased, one must first know the appearance of a normal spectroscopy waveform. The spectroscopy waveform of the normal human brain is predominantly made up of NAA, creatine, choline, and myoinositol peaks. In the normal brain, a line can usually be drawn connecting the peaks of these four molecules. This line makes a 45° angle with the x-axis, an angle referred to as “Hunter’s angle.” An alteration in the angle or a peak outside the line is a cause for concern (Fig. 1). Hunter’s angle can help interpret the changes in the molecular peaks of a spectroscopy waveform. In Case 2, the choline peak at 3.2 ppm is higher than the creatine peak at 3.0 ppm. Assuming that creatine is unchanged, and recalling that in the normal situation choline is less than creatine (think of Hunter’s angle), we can conclude that choline is elevated in this case. Similarly, we can see that NAA is less than creatine, a reversal of the normal relationship, indicating a decrease in levels of NAA. A lactate peak is always abnormal. Hunter’s angle is a useful visual aid for beginners as they introduce themselves to spectroscopy but, like many rules, it has many exceptions and it should be used with caution. Hunter’s angle generally applies to images obtained of the cortex with a stimulated echo aquisition mode, or STEAM, sequence and a short time to echo (TE). (The STEAM sequence is an alternative to the PRESS sequence and is further discussed in Case 3.) Changing any of these factors, even in the normal brain, can cause a disruption of Hunter’s angle.8 Another factor complicating the understanding of the normal spectrum is that it is not always the same. The normal spectrum changes with age (infant compared to adult). At birth, the NAA levels are low, and the choline and myoinositol are high. By 4 years of age, the spectra have a more adult appearance.3,9 The normal spectrum also differs within specific regions of the brain. Above the level of the ventricles, choline is higher in the frontal than parietal lobes and higher in the white matter than the cortical gray matter. Below the level of the third ventricle, choline levels are elevated in the insular cortex, thalamus, and hypothalamus.3,10 Because the normal spectrum changes with age, regional location within the brain, and imaging technique, it is often difficult to predict what it should look like. For this reason, it is often of utility to obtain a spectrum of the contralateral normal hemisphere for purposes of comparison. Fortunately, metabolites are highly symmetrical between the left and right hemispheres in normal patients.11 FIGURE 3A. Axial T1-weighted postcontrast MR image. A heterogeneously enhancing mass is centered in the right parietal periventricular white matter. There is associated mass effect with mild right-to-left midline shift. The square within the mass in the right parietal lobe marks the area characterized by spectroscopy. FIGURE 3B. PRESS waveform (TE = 30 msec). There is a small but abnormal lactate peak. The NAA levels are decreased and the choline levels are markedly increased. Myoinositol levels are also decreased.
Magnetic Resonance Spectroscopy
CASE 1

ANSWERS
CASE 1
Diagnosis:
Clinical Discussion:
Physics Discussion
CASE 2
Diagnosis:
Clinical Discussion:
Physics Discussion
CASE 3
Related posts:
![]()
Stay updated, free articles. Join our Telegram channel

Full access? Get Clinical Tree


Resonance Spectroscopy