, Abraham Z. Snyder1, Carl D. Hacker2, Timothy J. Mitchell1, Eric C. Leuthardt3 and Joshua S. Shimony1
(1)
Mallinckrodt Institute of Radiology, Washington University School of Medicine, Saint Louis, MO 63141, USA
(2)
Department of Biomedical Engineering, Washington University School of Medicine, Saint Louis, MO 63141, USA
(3)
Department of Neurosurgery, Washington University School of Medicine, Saint Louis, MO 63141, USA
Abstract
Purpose: Task-based fMRI has traditionally been used to locate eloquent regions of the brain that are relevant to specific cognitive tasks. These locations have, in turn, been used successfully to inform surgical planning. Resting-state functional MRI (fMRI) uses alternative methods to find networks, but does not require any task performance by a patient.
Materials and Methods: Resting-state fMRI uses correlations in the blood oxygen level–dependent (BOLD) signal to identify connected regions across the brain that form networks. Several methods of analyzing the data have been applied to calculate resting-state networks. In particular, seed-based correlation mapping and independent component analysis (ICA) are two commonly used techniques.
Results: Several studies using these analysis techniques are described in this chapter. Resting-state data has been used successfully as a presurgical planning tool in tumor patients and epilepsy patients.
Conclusions: Resting-state fMRI has been compared favorably to other methods of determining functional connectivity, including task-based fMRI and electrocortical stimulation. These results demonstrate great promise for the future of resting-state fMRI in presurgical planning.
1 Introduction
1.1 Background
Localization of function within the brain using functional magnetic resonance imaging (fMRI) traditionally has been performed by presenting stimuli or imposing tasks (such as finger tapping or object naming) to elicit neuronal responses (Posner and Raichle 1994; Spitzer et al. 1995). This type of experiment has been very effective, as evidenced by over 28,000 publications (listed in PubMed, as of December, 2013) utilizing task-based fMRI. fMRI detects changes in the blood oxygen level–dependent (BOLD) signal that reflect the neurovascular response to neural activity. Thus, BOLD fMRI is able to identify regions in the brain associated with a given task.
Since the earliest days of fMRI, it has been recognized that the BOLD signal exhibits spontaneous fluctuations (Purdon and Weisskoff 1998). These fluctuations were initially regarded as noise to be averaged out over many trials or task blocks (Triantafyllou et al. 2005). More recent studies have shown that these spontaneous fluctuations reflect the brain’s functional organization. The human brain is a disproportionate consumer of metabolic energy relative to its weight: 20 % of the total energy utilization but only 2 % of body weight (Clarke and Sokoloff 1999). This energy appears to be largely used for signaling (Shulman et al. 2004; Attwell and Laughlin 2001; Ames et al. 1992; Lennie 2003; Raichle and Mintun 2006). Task performance only minimally increases energy consumption in the brain (Raichle and Mintun 2006). Therefore, task-based experiments ignore the overwhelming preponderance of the brain’s activity. That intrinsic brain activity could be utilized for functional localization was first suggested by Biswal and colleagues who demonstrated that BOLD fluctuations observed in the resting state are correlated within the somatomotor system (Biswal et al. 1995). Correlated intrinsic activity currently is referred to as functional connectivity MRI or resting-state fMRI (rsfMRI). The development of these methods has opened up many exciting possibilities for future neurocognitive research as well as clinical applications, including presurgical planning, which is the subject of this chapter. A historical review is given in (Snyder and Raichle 2012).
1.2 Resting-State Networks
The topographies of functionally connected regions across the brain are known as resting-state networks (RSNs; equivalently intrinsic connectivity networks (Seeley et al. 2007). The resting-state fMRI scans are generally acquired while the subject is in a state of quiet wakefulness (Fox and Raichle 2007). The importance of RSNs lies in the fact that their topography closely corresponds to responses elicited by a wide variety of sensory, motor, and cognitive tasks (Smith et al. 2009). Intrinsic activity persists, albeit in somewhat modified form, during sleep (Samann et al. 2010; Larson-Prior et al. 2009) or even under sedation (Mhuircheartaigh et al. 2010). The persistence of the spontaneous fluctuations during states of reduced awareness suggests that intrinsic neuronal activity plays a role in the maintenance of the brain’s functional integrity (Pizoli et al. 2011). Spontaneous BOLD activity has been detected in all mammalian species investigated thus far (Hutchison et al. 2012; Schwarz et al. 2013; Nasrallah et al. 2013), which reinforces the notion that this phenomenon is physiologically important. However, the precise physiological functions of intrinsic activity remain to be elucidated.
Perhaps the most fundamental RSN is the default mode network (DMN) (Fig. 1a), first identified by a meta-analysis of task-based functional neuroimaging experiments performed with positron emission tomography (PET) (Shulman et al. 1997; Gusnard and Raichle 2001). The defining property of the DMN is that it is more active at rest than during performance of goal-directed tasks. The DMN was first identified using rsfMRI by Greicius et al. (2003). This finding has since been replicated many times, using a variety of analysis methods (Smith et al. 2009; Beckmann et al. 2005; De Luca et al. 2006; Power et al. 2011; Yeo et al. 2011; Damoiseaux et al. 2006; van den Heuvel et al. 2008; Lee et al. 2012a). Some investigators have hypothesized that there are two large anti-correlated systems in the brain (Fox et al. 2005; Golland et al. 2008), one anchored by the DMN and the other comprised of systems controlling executive and attentional mechanisms. This dichotomy has been variously referred to as “task-positive” vs. “task-negative” (Power et al. 2011; Lee et al. 2012a; Fox et al. 2005; Chai et al. 2012; Zhang et al. 2011a) and “intrinsic” vs. “extrinsic” (Golland et al. 2008; Doucet et al. 2011). Although the nomenclature associated with the DMN remains controversial (Jack et al. 2012; Spreng 2012), the topography of the DMN is remarkably consistent across diverse analysis strategies.
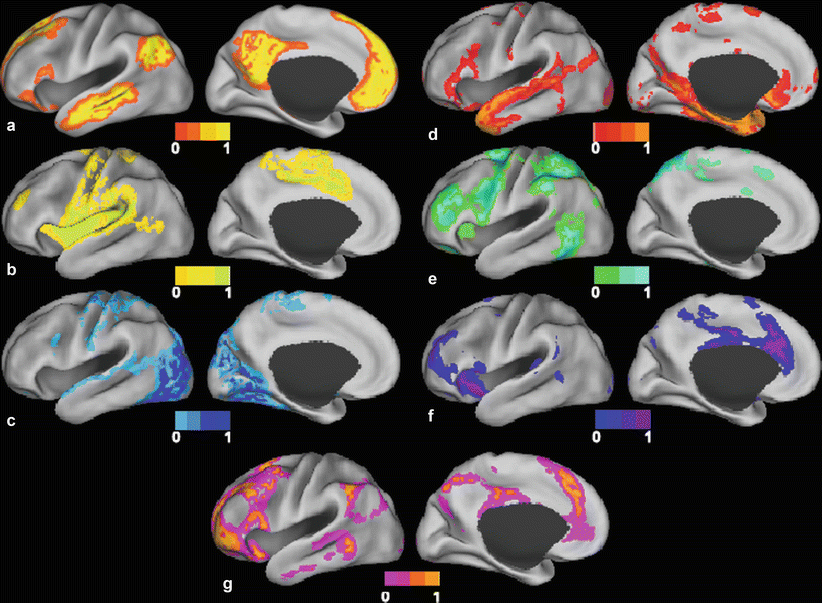
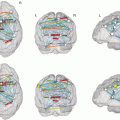
Fig. 1
Surface plots of resting-state networks as derived from fuzzy c-means algorithm (Lee et al. 2012a) (a) Default mode network. (b) Somatomotor network. (c) Visual network. (d) Language network. (e) Dorsal attention network. (f) Ventral attention network. (g) Frontoparietal control network
Primary sensory and motor RSNs include the somatomotor network (SMN), first identified by Biswal and colleagues (Biswal et al. 1995), which encompasses primary and higher order motor and sensory areas (Fig. 1b). The visual (VIS) network spans much of the occipital cortex (Fig. 1c) (Smith et al. 2009; Beckmann et al. 2005; De Luca et al. 2006; Power et al. 2011; Yeo et al. 2011). The auditory network includes Heschl’s gyrus, the superior temporal gyrus, and the posterior insula (Smith et al. 2009). The language network (LAN) includes Broca’s and Wernicke’s areas but also extends to prefrontal, temporal, parietal, and subcortical regions (Fig. 1d) (Tomasi and Volkow 2012; Lee et al. 2012b; Hacker et al. 2013).
RSNs involved in attentional and cognitive control include the dorsal attention network (DAN) and the ventral attention network (VAN) (Seeley et al. 2007; Power et al. 2011; Yeo et al. 2011; Corbetta and Shulman 2002; Fox et al. 2006a). The DAN (Fig. 1e) includes the intraparietal sulcus and the frontal eye field and is recruited by tasks requiring control of spatial attention. The VAN (Fig. 1f), which includes the temporal-parietal junction and ventral frontal cortex, is involved in the detection of environmentally salient events (Corbetta and Shulman 2002; Fox et al. 2006a; Astafiev et al. 2006). The frontoparietal control network (FPC) (Fig. 1g), which includes the lateral prefrontal cortex and the inferior parietal lobule, is associated with working memory and control of goal-directed behavior (Vincent et al. 2008; Power and Petersen 2013). Finally, the cingulo-opercular network (CON), also known as the salience network (Seeley et al. 2007) or the core control network (Dosenbach et al. 2006), includes the medial superior frontal cortex, anterior insula, and anterior prefrontal cortex. The CON is thought to enable the performance of tasks requiring executive control (Power et al. 2011; Power and Petersen 2013; Dosenbach et al. 2006).
2 Methods
2.1 Overview of Processing Methods
Resting-state fMRI methodology is currently dominated by two complementary strategies, spatial independent components analysis (SICA) (Beckmann et al. 2005) and seed-based correlation mapping (Biswal et al. 1995). Both strategies depend on the fact that spontaneous neural activity is correlated (coherent) within widely distributed regions of the brain. Both strategies yield highly reproducible results at group level (Damoiseaux et al. 2006; Shehzad et al. 2009). SICA decomposes rsfMRI data into a sum of single components, each component corresponding to a spatial topography and a time course. In contrast, seed-based correlation mapping is computed by voxelwise evaluation of the Pearson correlation between the time courses in a targeted region of interest and all other voxels in the brain (Fox et al. 2009). The principal advantage of SICA is that it provides a direct means of separating artifact from BOLD signals of neural origin, although this separation typically requires observer expertise. The results obtained using SICA may vary substantially depending on processing parameters (e.g., number of requested components). Thus, SICA can be difficult to use in the investigation of targeted RSNs, especially in single subjects. In contrast, targeting of selected RSNs is intrinsic to seed-based correlation mapping. However, the principal difficulty in using seed-based correlation mapping is the exclusion of non-neural artifacts, which is typically accomplished using regression techniques (Fox et al. 2009; Jo et al. 2010; Vincent et al. 2006).
SICA and seed-based correlation mapping both represent strategies for assigning RSN identities to brain voxels. Since SICA makes no a priori assumptions regarding the topography of the obtained components, this method exemplifies unsupervised classification. In contrast, seed-based correlation mapping depends on prior knowledge and so exemplifies supervised classification. For additional discussion of the distinction between supervised vs. unsupervised methodologies, see (Hacker et al. 2013). Below, we present results obtained by two unsupervised methods, SICA and c-means clustering, and two supervised methods, conventional seed-based correlation mapping and RSN mapping using a trained multilayer perception (MLP) classifier.
2.2 General Preprocessing
Preprocessing of fMRI data varies across laboratories. The following describes the procedures used in our laboratory (Shulman et al. 2010). Briefly, these include compensation for slice-dependent time shifts, elimination of systematic odd-even slice intensity differences due to interleaved acquisition, and rigid body correction for head movement within and across runs. The fMRI data are intensity scaled (one multiplicative factor applied to all voxels of all frames within each run) to obtain a mode value of 1,000 (Ojemann et al. 1997). This scaling facilitates assessment of voxelwise variance for purposes of quality assessment but does not affect computed correlations. Atlas transformation is achieved by composition of affine transforms connecting the fMRI volumes with the T1- and T2-weighed structural images. Head movement correction is included in a single resampling to generate a volumetric time series in 3 mm3 atlas space.
2.3 Preprocessing in Preparation for Seed-Based Correlation Mapping
Additional preprocessing in preparation for seed-based correlation mapping includes the following: (1) spatial smoothing (6 mm full-width half- maximum Gaussian blur in each direction), (2) voxelwise removal of linear trends over each run, (3) temporal low-pass filtering to retain frequencies <0.1 Hz, and (4) reduction of spurious variance by regression of nuisance waveforms derived from head motion correction and extraction of the time series from regions of noninterest in white matter and cerebrospinal fluid. In our lab, this step includes regression of the global signal averaged over the whole brain (Fox et al. 2009; Buckner et al. 2005). A consequence of global signal regression (GSR) is that all subsequently computed correlations are effectively partial correlations of first-order controlling for widely shared variance. As global signal regression currently is a contentious maneuver, this topic is considered further in the next section.
2.4 Global Signal Regression
Global signal regression (GSR) prior to correlation mapping is a highly effective means of reducing widely shared variance and thereby improving the spatial specificity of computed maps (Fox et al. 2009; Aguirre et al. 1998; Macey et al. 2004). Some part of the global signal undoubtedly is of neural origin (Scholvinck et al. 2010). However, much (typically most) of the global signal represents non-neural artifact attributable to physical effects of head motion (Friston et al. 1996; Yan et al. 2013; Power et al. 2012; Satterthwaite et al. 2012) and variations in the partial pressure of arterial carbon dioxide (Wise et al. 2004). In the absence of GSR, all parts of the brain appear to be strongly positively correlated (Chai et al. 2012; Fox et al. 2006a; Lowe et al. 1998; Joel et al. 2011). GSR causes all subsequently computed correlation maps to be approximately zero-centered; in other words, positive and negative values are approximately balanced over the whole brain (Fox et al. 2009). Thus, GSR unambiguously does negatively bias all computed correlations, although iso-correlation contours, i.e., map topographies, remain unchanged. This negative bias has caused some experts in the field research to criticize GSR on the grounds that it induces artifactual anti-correlations (Anderson et al. 2011; Murphy et al. 2009). This objection to GSR has largely been dissipated following the demonstration that some parts of the brain appear to be truly anticorrelated in the resting state, as demonstrated using SICA (Liao et al. 2010; Zuo et al. 2010). More recent objections to GSR focus on the possibility that it can distort quantitative functional connectivity differences across diagnostic groups (Saad et al. 2012). This objection to GSR, however, is irrelevant in the context of using rsfMRI for purposes of RSN mapping in individuals.
2.5 Seed-Based Correlation Mapping
Seed-based correlation mapping is one of the most widely adopted techniques for studying co-fluctuations in intrinsic neuronal activity, or functional connectivity (Shehzad et al. 2009; Cordes et al. 2000). The high adoption rate of the seed-based approach is partly attributable to the simplicity of its implementation and to the ease with which the results can be interpreted. Biswal et al. used this method to first demonstrate the feasibility of using fMRI to detect spatially distributed networks (Biswal et al. 1995).
Pearson product-moment correlation is the most widely used measure of functional connectivity (Biswal et al. 1995; Greicius et al. 2003; Fox et al. 2005; Lowe et al. 1998; Cordes et al. 2000; Xiong et al. 1999). Seed-based analyses require prior knowledge of the locations of regions of interest, and these can be obtained from previously determined atlas coordinates or from task-based fMRI data. For instance, a simple motor paradigm may be used to generate data involving the motor network. The activation data is then analyzed, and the voxel that is associated with the strongest activation is used as a “seed” region to study the resting-state data. Once the coordinates of the seed region have been identified, the resting-state time courses from the rest of the brain are compared with this region, and a correlation map is generated. An example of multiple RSNs using the seed-based approach is presented in Fig. 2 (Zhang and Raichle 2010).
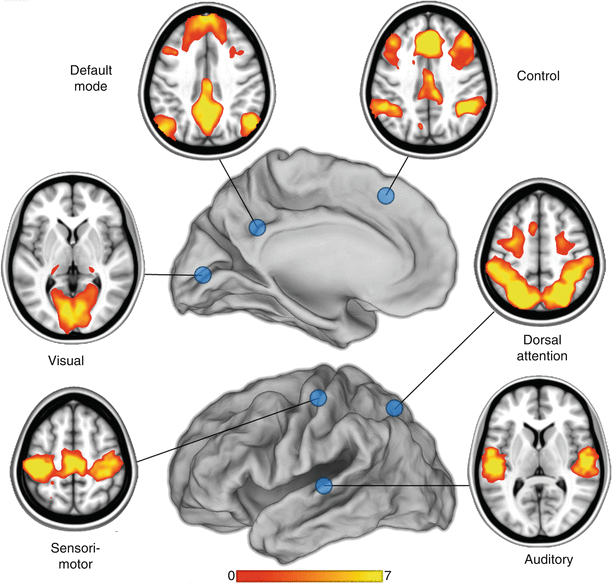
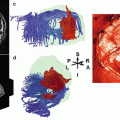
Fig. 2
Examples of multiple resting-state networks generated using a seed-based approach (blue circles in the figure) (Zhang and Raichle 2010). Six of the major networks are illustrated: visual, sensorimotor, auditory, default mode, dorsal attention, and frontoparietal executive control. The scale numbered 0–7 indicates the relative correlation strength
2.6 Independent Component Analysis
Unsupervised data-driven approaches are of interest to researchers looking to analyze resting-state data without a priori assumptions. SICA is the most widely used data-driven approach to analyze resting-state data (Goldman et al. 2003; Beckmann and Smith 2004; Greicius et al. 2004). SICA decomposes resting-state fMRI data (time×space) into spatial components that are maximally independent. Each spatial component is associated with a particular time course. The components are useful for differentiating noise data from physiological data as well as identifying statistically independent systems. Comparison studies between seed-based correlation maps and spatial patterns determined by SICA have found similar spatial patterns (Beckmann et al. 2005; Rosazza et al. 2012).
Although the SICA approach eliminates the need for a priori seed identification, the user is required to choose the initial number of components as well as to select which components represent noise and which represent functional networks. Some studies have aimed to automate this process and use SICA as a method for identifying and eliminate noise within the BOLD signal (Starck et al. 2010; Thomas et al. 2002; Tohka et al. 2008).
2.7 Clustering Algorithms
Another method used to analyze rsfMRI data makes use of clustering algorithms. Clustering algorithms attempt to group items that are alike on the basis of a set of relevant characteristics to the problem of interest. Voxels can be grouped on the basis of similarity of their BOLD time courses by using some distance metric, such as a Pearson correlation. One example of a clustering algorithm is hierarchical clustering (Salvador et al. 2005; Cordes et al. 2002), which builds a dendrogram (a treelike structure) of all members. Other examples of clustering algorithms are the K-means (Golland et al. 2008) and Fuzzy c-means (Lee et al. 2012a) clustering algorithms. In these algorithms, all voxels are assigned membership to one or more of several clusters on the basis of their distances from the cluster centers, which, in turn, are calculated from an average of their members. Clustering algorithms iteratively update memberships and cluster centers until convergence is achieved (Lee et al. 2012a) (Fig. 1). Other variations on clustering algorithms include spectral-based clustering (Bellec et al. 2010) and graph-based clustering (van den Heuvel et al. 2008).
2.8 RSN Mapping Using a Trained Multilayer Perceptron (MLP)
One technique for mapping the topography of known RSNs in individuals uses a Multilayer perceptron (MLP) (Hacker et al. 2013). Perceptrons are machine learning algorithms that can be trained to associate arbitrary input patterns with discrete output labels (Rumelhart et al. 1986). For example, perceptrons can be trained to read handwritten digits, e.g., zip codes on addressed letters (LeCun et al. 1989). Here, an MLP was trained to associate seed-based correlation maps with particular RSNs. Running the trained MLP on correlation maps corresponding to all voxels in the brain generates voxel-wise RSN membership estimates. Thus, RSN mapping using a trained MLP exemplifies supervised classification. An example of the RSN produced by the MLP algorithm in three subjects is presented in Fig. 3. It is critical to note that our MLP assigns RSN membership to rsfMRI correlation maps. This application of machine learning must not be confused with other methodologies in which classifiers have been trained to assign diagnostic labels to patients on the basis of their resting-state functional connectivity patterns (Abdulkadir et al. 2011). Our implementation of MLP-based RSN mapping utilizes the same preprocessing steps described above in connection with seed-based correlation mapping and fuzzy c-means clustering (Sects. 2.2, 2.3, and 2.4).
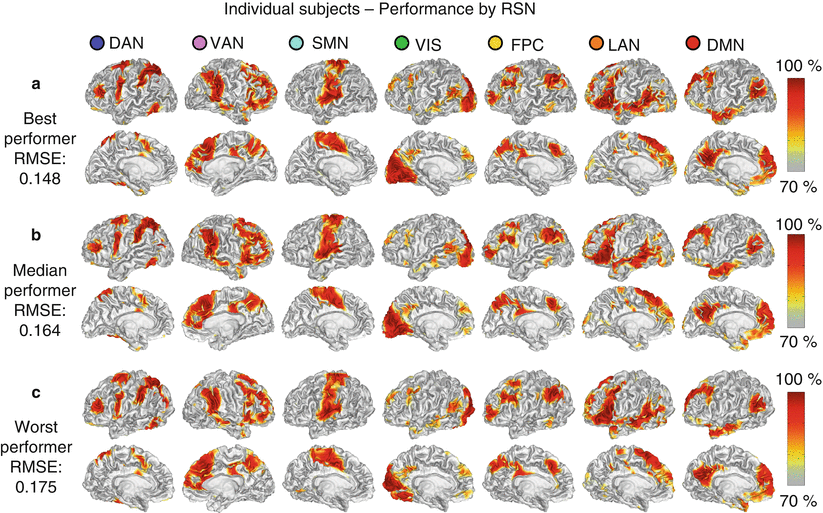
Fig. 3
Single subject, voxel estimation of resting-state networks using trained multilayer perceptron (MLP) in three subjects. The results are from best (a), median (b), and worst (c) performers as determined by RMS error and demonstrate high quality results in individual subjects even in the worst case. MLP output was converted to a percentile scale and sampled onto each subject’s cortical surface (Hacker et al. 2013)
Figure 4 demonstrates the degree to which the MLP captures individual variability, by showing that, in each subject, the location of the central sulcus in the cortical surface segmented using FreeSurfer (Fischl 2012) is highly correlated with the location of the SMN centroid calculated by the MLP. Detailed quantitative evaluation of the MLP performance is given in (Hacker et al. 2013). MLP performance was also compared to alternative RSN estimation schemes such as dual regression and linear discriminant analysis and was found to provide improved “area under the curve estimation” with better orthogonal estimates of RSN membership.
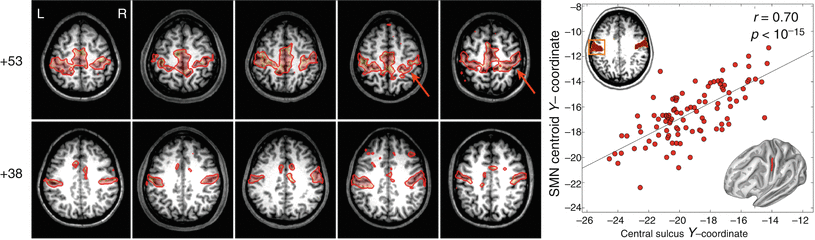
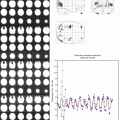
Fig. 4
Multilayer perceptron (MLP) somatomotor network (SMN) validation results derived from five individuals selected to represent the correspondence between SMN variability and anatomical variability in the central sulcus. The plot shows the correlation between the Talairach y-coordinate of the centroid of the MLP SMN and the y-coordinate centroid of the central sulcus traced over the anatomy (as determined by the FreeSurfer program) in a large validation dataset (Hacker et al. 2013)
In summary, the MLP accurately generates RSN topography estimates in individuals consistent with previous studies, even in brain regions not represented in the training data, and can be used for generating individual RSN maps. These findings are important to future applications because they demonstrate that this approach can reliably and effectively map multiple RSNs across individual subjects.
3 Application to Presurgical Planning
3.1 Introduction
Multiple studies have demonstrated that maximal resection of a brain tumor while sparing nearby eloquent cortex leads to improved outcomes, with minimal morbidity (Keles et al. 2001, 2006; Lacroix et al. 2001; McGirt et al. 2009; Sanai et al. 2008). Historically, neurosurgeons have been concerned with the localization of the motor and language system on the assumption that these parts of the brain (“eloquent” cortex) instantiate critical functionality. However, a broader understanding of brain function suggests that all parts of the brain contribute to important functionality (Yeo et al. 2011; Lee et al. 2012a; Golland et al. 2008; Hacker et al. 2013). Thus, improved functional mapping of multiple RSN beyond motor and language could lead to further improvements in patient outcomes.
Multiple prior publications have explored the use of rsfMRI in presurgical planning. An early case report example of this technique was used to localize the motor cortex in a patient with a brain tumor (Shimony et al. 2009). Kokkonen et al. (2009) similarly compared motor task data to resting-state data and showed that the motor functional network could be localized on the basis of resting-state data in 8 tumor patients, as well as 10 healthy control subjects.
Resting-state fMRI may also be used for presurgical planning in patients with epilepsy. The higher spatial resolution offered by rsfMRI over electroencephalography could provide a distinct advantage in mapping epileptic foci or networks. Seed-based methods were used by Liu et al. (2009) to successfully locate sensorimotor areas by using rsfMRI in patients with tumors or epileptic foci close to sensorimotor areas. They found agreement between rsfMRI, task-based fMRI, and intraoperative cortical stimulation data. In another study from the same laboratory, Stufflebeam and colleagues (Stufflebeam et al. 2011) were able to localize areas of increased functional connectivity in five of six patients that overlapped with epileptogenic areas identified by invasive encephalography. Zhang et al. (2011b) used graph methods and a pattern classifier applied to rsfMRI data to identify subjects as either having medial temporal lobe epilepsy or as normal controls. Using data from 16 patients with intractable medial temporal lobe epilepsy and 52 normal controls, they achieved an average sensitivity of 77.2 % and a specificity of 83.86 % in classification. Bettus et al. (2010) reported that increases in basal functional connectivity were a specific marker of the location of the epileptogenic zone in 22 patients with mesial temporal lobe epilepsy. Weaver et al. (Weaver et al. 2013) studied four patients with focal epilepsy along with 16 control subjects to determine whether the seizure focus could be found using the functional patterns near the epileptogenic zone. By averaging voxel homogeneity across regions of interest in comparison to other regions, they were able to accurately identify the epileptic focus. Tie et al. (2013) employed ICA data evaluation on a training group of 14 healthy subjects to identify the language network from rsfMRI data. The result of that analysis was then used to identify the language network in a second group of 18 healthy subjects on an individual level. The authors further propose an automated system for determining the language network in individual patients using SICA. A more detailed presentation of our experience using rsfMRI for presurgical mapping with both seed-based and MLP approaches is given in the next sections.
Related posts:


Stay updated, free articles. Join our Telegram channel

Full access? Get Clinical Tree


