Introduction
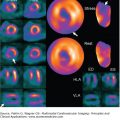
The evaluation of right ventricular (RV) size and function in normal and pathologic conditions is challenging due to its complex shape and nonsymmetrical contraction. Unlike the left ventricle (LV), the RV is crescent shaped and truncated, with separate inflow and outflow portions. The normal RV is triangular (curved) when viewed sagittally, crescent shaped when viewed axially, and similar to a teapot when viewed coronally (Fig. 19–1). It is thin walled, highly trabeculated, and devoid of the LV’s extensive circumferential myofibrillar architecture. The RV apex may be dominated by the shape and function of the LV apex or may be entirely separate and independent (“butterfly” apex) (Fig. 19–2).1 The RV is strongly influenced by the normally concave interventricular septum, and its shape is influenced by acute and chronic pathologic pressure and volume changes. Whereas the normal LV has the shape of a prolate ellipse (and becomes a sphere in many disease states), there is no convenient model that accurately approximates normal or pathologic RV geometry.
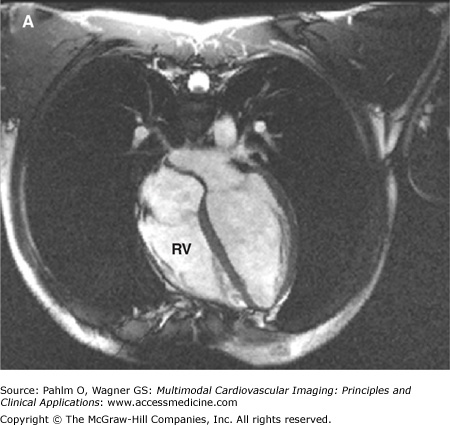
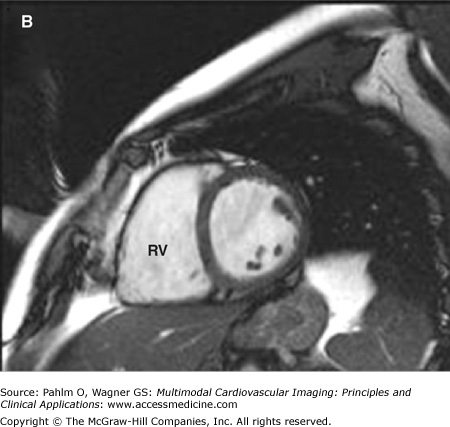
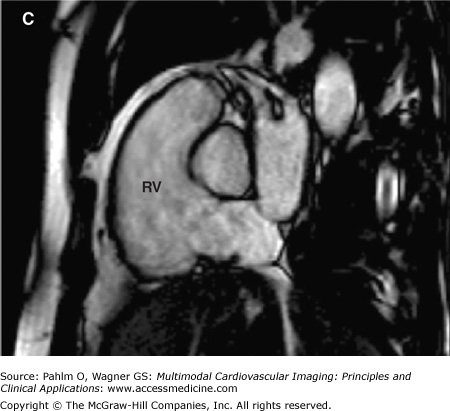
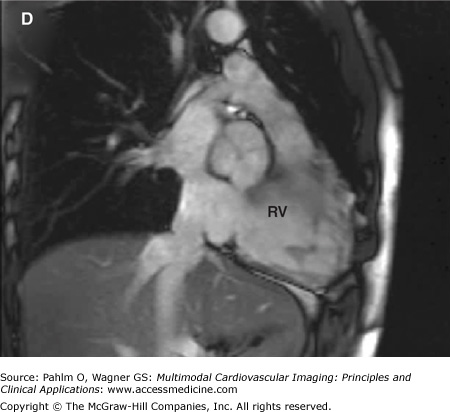
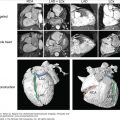
Figure 19–2.
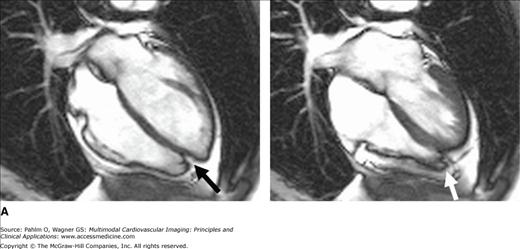
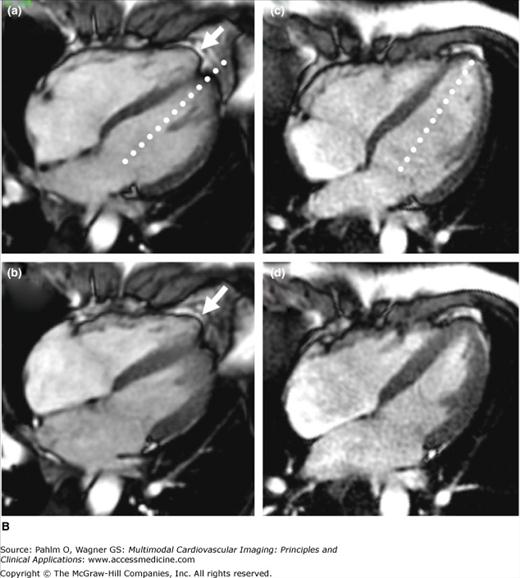
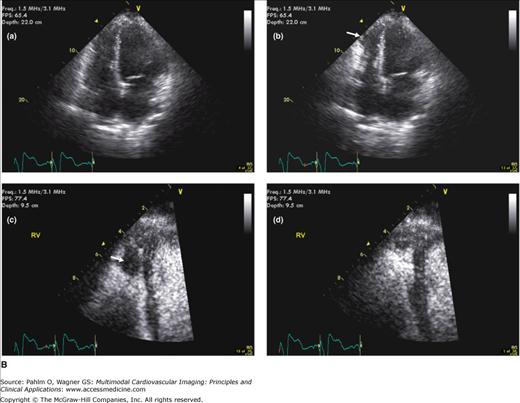
A. Cardiac magnetic resonance imaging white blood (steady-state free precession) cine image. The right ventricular (RV) apex is entirely separate and independent from the left ventricular (LV) apex (“butterfly” apex; black arrow). Left. Diastole. Right. Systole. Note the thin hypokinetic RV apex in this normal patient (white arrow). B. Importance of foreshortening. This is a normal volunteer without heart disease. Note the left panel images (a = diastole; b = systole) that were obtained within minutes of the right panel images (c = diastole; d = systole). The image on the left was obtained with a slightly inferior angulation relative to the truly aligned four-chamber view on the right creating a foreshortened LV long axis diameter (dotted lines equal length). Due to the pyramidal RV shape, this inferior angulation creates an elongated RV cavity relative to the LV. This creates a falsely dilated RV cavity and also accentuates the RV apex, which appears separated from the LV (“butterfly”) and hypokinetic (arrows). See Moving Image 19–2B.
General Concepts of RV Anatomy and Physiology
The RV is notable for its distinctive shape, heavy trabeculation, prominent moderator band, and lack of fibrous continuity between the tricuspid and pulmonic valves. The RV can be considered to be composed of three components: the inflow (or inlet), the outflow (outlet, conus, or infundibulum), and the apex. The RV inflow tract and outflow tract are separated by the thick crista supraventricularis band of muscle fibers. The apex is virtually immobile and usually tethered to the LV apex. These three parts develop separately, are independently subjected to congenital malformations, and have unique responses to pathology and pharmacologic interventions. The RV myocardium is usually 2- to 3-mm thick with subepicardial myofibers arranged in a circumferential network parallel to the atrioventricular groove, encircling the RV outflow tract (RVOT), and then becoming more spirally orientated near the RV apex.2,3 The inflow is mainly composed of circumferential fibers in the subepicardium and longitudinal fibers in the subendocardium. At the outflow tract, both subendocardial and subepicardial fibers run longitudinally. The majority of the RV myocardium is devoid of the middle circumferential myofiber array that is dominant in the LV and is much more dependent on longitudinal shortening for ejection than the LV.4 During systole, at the inflow tract, there is longitudinal shortening from base to apex and circumferential motion toward the common septum. Thus, simple global measures of RV function are difficult due to the two portions contracting perpendicular to each other.
The global RV performance is determined by the following regional contraction patterns: (1) movement of the basal free wall toward the apex (the “bellows effect”); (2) the contraction of the RVOT; (3) the contribution of the LV (tethering) at the interventricular insertion sites; and (4) the influence of the ventricular septum (interventricular dependence). Interventricular dependence is illustrated by impairment of RV function due to the adjacent diseased LV, but not necessarily due to a myopathic process itself.5 This should be considered when assessing RV performance. The evaluation of regional RV wall motion must take into consideration the variable contraction patterns near the moderator, parietal, and septomarginal bands because the muscle bundles may alter the symmetric contraction of the RV free wall (Table 19–1).
| Findings n = 29 (100%) | Axial n (%) | SAX n (%) | LAX n (%) |
|---|---|---|---|
| Segment affected | |||
| Apicolateral | 23 (79.3) | – | 10 (34.5) |
| Mediolateral | 10 (34.5) | – | 5 (17.2) |
| Basolateral | – | – | – |
| Inferolateral | – | 4 (13.8) | – |
| Wall motion abnormality | 25 (86.2) | 4 (13.8) | 12 (41.4) |
| Dyskinesia | 19 (79.3) | – | 9 (31.0) |
| Hypokinesia | 9 (31.0) | – | 3 (10.3) |
| Bulging | 2 (6.9) | 4 (13.8) | 3 (10.3) |
| Relation to insertion MB | |||
| To right | 14 (48.3) | – | 4 (13.8) |
| To left | 6 (20.7) | 2 (6.9) | 3 (10.3) |
These features of RV contraction are important in understanding and estimating RV function. Because the predominant RV fractional shortening is significantly greater longitudinally than circumferentially, an evaluation of longitudinal shortening provides a relatively simple and reliable estimate of global RV function. RV function is also influenced by volume shifts that occur with normal respiration. During inspiration, venous return increases, causing an increased RV preload, with a slight but detectable increase in RV stroke volume. Therefore, when carefully measuring RV performance, one should consider whether data were acquired during inspiration, expiration, or apnea (preferred). Lastly, a regional difference in response to inotropic stimulation has been observed, with the RVOT being more reactive than the RV inflow tract.6 This may be important when evaluating response to treatment with inotropic drugs.
The LV and RV have the same stroke volume, but the upper limit of normal RV volume is greater than the LV. This explains why the normal RV ejection fraction (EF) is lower than the LVEF (example: RV in diastole, 100 mL; RV in systole, 55 mL; RV stroke volume, 45 mL; RVEF = 45/100 = 45%; LV in diastole, 90 mL; LV in systole, 45 mL; LV stroke volume, 45 mL; LVEF = 45/90 = 50%).
The pulmonary circulation normally has a low vascular resistance, and consequently, the RV has short isovolumic contraction time (ICT) and isovolumic relaxation time (IRT). The superficial circumferential fibers contract during the ICT, but during the ejection period, the deeper longitudinal fibers contract and are responsible for the longitudinal shortening. During the phase of isovolumic contraction, the longitudinal shortening of the RV occurs mainly during the ejection phase of the cardiac cycle controlled by the subendocardial fibers. Onset of RV ejection at the outflow tract is delayed approximately 25 to 50 ms after the onset of contraction of the inflow tract. These anatomic considerations provide the potential for specific regional markers of RV contractility.
Selected Noninvasive RV Imaging Techniques
Echocardiography is and will likely remain a first-line diagnostic imaging modality for evaluating the RV structure and function because of its availability and because it is a noninvasive, rapid, portable, and comprehensive approach to assess patients with suspected right heart disease. Accurate evaluation of RV morphology and function requires integration of multiple echocardiographic views, including parasternal long and short axis, RV inflow, apical four-chamber, and subcostal views.7 Although multiple quantitative methods for RV assessment are listed, assessment of RV structure and function remains mostly qualitative in clinical practice. Methods commonly used to calculate the LV volume may be used to calculate RV volumes but are less accurate due to the complex geometry. Due to these inherent limitations, a number of geometry-independent parameters have been proposed.
The commonly reported RV internal diameter obtained with M-mode in the parasternal long axis view is an unreliable marker of RV dilation because the anterior RV wall is often poorly seen. The irregular RV shape may result in the M-mode cursor transecting either the wider central plane or a narrower peripheral site because the cursor may transect the RV in an oblique manner.
The total tricuspid annular descent or tricuspid annular plane systolic excursion (TAPSE) is an important marker of RV global systolic function (normal, 20 mm). The TAPSE can be derived from M-mode analysis of the lateral tricuspid annular ring or Doppler tissue imaging (DTI) color display (Fig. 19–3). Interestingly, for such a simple marker of RV function, the correlation between TAPSE and RVEF by cardiac magnetic resonance (CMR) was superior to radionuclide techniques and three-dimensional estimates of RVEF.8
Figure 19–3.
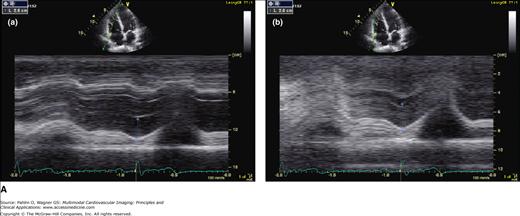
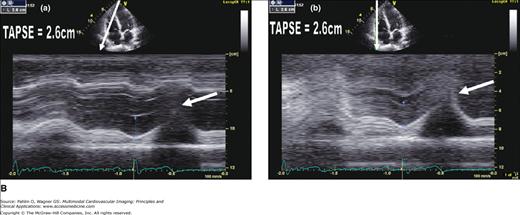
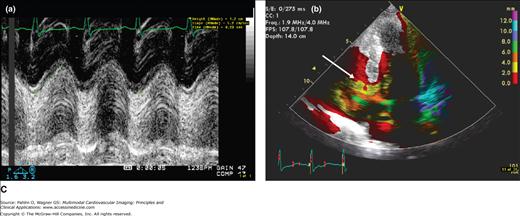
A. Normal TAPSE (26 mm) as determined by conventional M-mode (a) versus anatomic (vertically aligned) M-mode (b). Although both methods provide reproducible values, the conventional M-mode that includes the RV cavity is easier to measure with higher signal-to-noise ratio at end-systole (arrows). B. The TAPSE can be derived from M-mode analysis (a) of the lateral tricuspid annular ring or Doppler tissue imaging color display (b). This patient has normal global RV function with TAPSE >20 mm and “purple” basal RV (white arrow). C. Markedly reduced global RV systolic function and a TAPSE of 12 mm. Note the red and yellow color at the base of the RV instead of the normal purple display (white arrow).
Normally, the LV appears larger than the RV in the parasternal long and short axis and the apical four-chamber view. To use this evaluation of RV size, care must be taken not to foreshorten the LV and overestimate the relative RV size (see Fig. 19–2B). For volume calculations, additional problems are encountered. During RV dilation, the already complex geometry undergoes significant and variable shape changes. Therefore, geometric formulas used for normal RV shapes are not likely to be valid in pathologic conditions. Despite attempts to obtain orthogonal RV images necessary for volume calculations, most commonly using the apical four-chamber and subcostal views, it remains difficult to validate that they are orthogonal.9
Because the RVOT is composed of a preponderance of circumferential myofibers, this region is an estimate of global RV function. The RVOT fractional shortening can be calculated as the percentage of the RVOT diastolic diameter minus the systolic diameter divided by the diastolic diameter. Either two-dimensional (2D) or M-mode echocardiography of the basal parasternal short axis view at the level of the aortic root can be used to measure this value, and this value has been shown to correlate with TAPSE. Importantly, it closely correlates with other physiologic events, such as the shortened pulmonary acceleration time recorded at the cusp level in patients with pulmonary hypertension.10
The RVEF can be determined using the area-length method applied to the apical four-chamber view or an adequate subcostal view.11 Similar to its proven value in the assessment of LV diseases, contrast echocardiography has recently been shown to be of value in evaluating the presence of RV pathology.12 Occasionally, agitated saline contrast alone may improve the visualization of the RV borders. If ineffective, a contrast agent (activated perflutren) can be administered to improve the echocardiographic assessment of the RV size and global and regional function (Fig. 19–4). When image quality is suboptimal, contrast should be administered and has been demonstrated to be safe and cost effective.13
Figure 19–4.
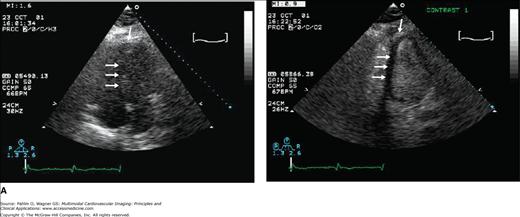
A. Contrast echocardiography. A second-generation contrast agent (activated Perflutren) can be administered to improve the echocardiographic assessment of the right ventricular (RV) size and global and regional function. Left (unenhanced image). RV apex and septal border (arrows) cannot be seen. Right (contrast enhanced). Both the RV endocardial border and the RV apex are seen (arrows). The RV apex occupies the cardiac apex, which is abnormal and consistent with RV dilation. B. Contrast echocardiography. Unenhanced apical 4-chamber view in diastole (a) and systole (b). A wall motion abnormality is suggested at end-systole (arrow). Contrast-enhanced images in diastole (c) and systole (d) reveal a large filling defect consistent with a thrombus not previously suspected (arrow). A large filling defect (arrow) is seen in the RV apex of this patient with a dilated cardiomyopathy (normal coronary arteries). See Moving Image 19–4B.
Global, systolic RV function can be assessed quantitatively using 2D echocardiography analysis as percentage of change in the RV cavity area from end-diastole to end-systole in the apical four-chamber view. End-diastole is identified by the onset of the R wave, whereas end-systole is regarded as the smallest RV cavity size just before the tricuspid valve opening. Endocardial borders of the RV free wall and septum are traced from base to apex, and the RV fractional area change (RV FAC) is defined using the following formula: (end-diastolic area – end-systolic area)/(end-diastolic area) × 100 (Fig. 19–5). Heavy RV trabeculation makes endocardial tracing difficult and requires an adequate quality image for accuracy of this parameter. This technique incorporates the RV inflow tract and the apex but excludes the RVOT and may overestimate RV function if focal regional dysfunction exists in this region. The percentage of RV FAC is a relatively simple parameter that is a surrogate marker of the RVEF and correlates well with CMR-derived RVEF (r = 0.80).14
Figure 19–5.
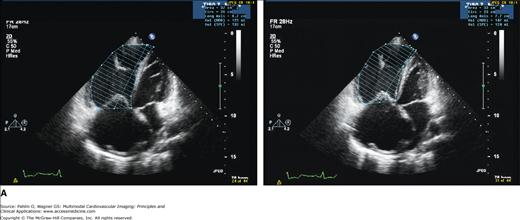
A. B. Transthoracic 2D echocardiographic images in diastole (left) and systole (right). Endocardial borders of the right ventricular free wall and septum are traced from base to apex, and the RV FAC% is defined using the following formula: (end-diastolic area – end-systolic area)/(end-diastolic area) × 100 (%). In this patient, there is severely reduced RV systolic function. See Moving Image 19–5B.
Transthoracic 2D echocardiographic images in diastole and systole.
Play Video
Pulsed wave Doppler tricuspid flow velocity helps evaluate RV filling and, indirectly, RV diastolic function. Peak flow velocity in early diastole (E wave), peak velocity at atrial contraction (A wave), tricuspid deceleration time, and tricuspid A wave duration are variables that can be compared with their mitral counterparts to assess for unilateral or bilateral heart disease. The hepatic vein and superior vena caval flow velocities can be obtained with pulsed wave Doppler and analyzed during apnea or in response to volume changes that occur with normal respiration. Increased flow reversals in the hepatic vein (>20%) or superior vena cava (>10%) during apnea suggest increased right-sided heart filling pressures. Increased flow reversals in response to inspiration or expiration can be seen in patients with restrictive or constrictive cardiomyopathies, respectively.15-17
Because tricuspid regurgitation (TR) is common, the rate of RV pressure increase can be obtained from the continuous-wave spectral Doppler TR signal. The time interval (dt) necessary to increase the TR velocity from 0 to 2 m/s is measured (Fig. 19–6). This represents a pressure change (dP) of 16 mm Hg. The dP/dt value is considered normal if it is greater than 400 mm Hg/s.18 The accuracy of this method is directly dependent on the quality of the TR Doppler envelope. Because dP/dt is influenced by preload, adding the maximal TR velocity (Pmax) into the equation as dP/dt/Pmax compensates for changes in preload.19 In patients with dominant RV failure, TR-derived dP/dt/Pmax, but not dP/dt alone, has been identified as a clinically useful index of RV contractility.
Figure 19–6.
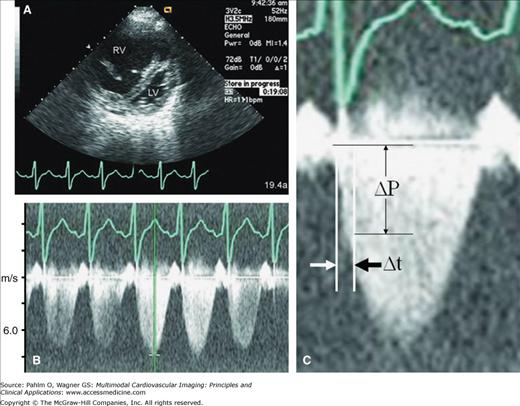
Two-dimensional (2D) and Doppler echocardiography. Calculation of time derivative of pressure (dP/dt; ΔP/Δt) from the tricuspid regurgitation (TR) spectral Doppler envelope. A. 2D echocardiography demonstrating dilated right ventricle (RV) with “compressed” left ventricle (LV) from severe pulmonary hypertension. B. Estimated pulmonary artery systolic pressure >5 m/s (>100 mm Hg). C. Zoom TR spectral Doppler image. The time interval (Δt) necessary to increase the TR velocity from 0 to 2 m/s (or from 1 to 3 m/s if marked pulmonary hypertension is present, as in this case example) is measured. ΔP, change in pressure.
The RV index of myocardial performance (RIMP; or Tei index) is defined as the sum of the ICT and IRT divided by the ejection time and is increased in either systolic or diastolic RV dysfunction (Fig. 19–7).20 An elevated RIMP has been shown to be an early sign of RV dysfunction in cardiac amyloidosis.21 Patients with hypertrophic cardiomyopathy and exertional dyspnea have an increased global RIMP compared to those without dyspnea.22 A value ≥0.40 has a sensitivity of 81% and a specificity of 85% to diagnose RVEF <35%. A value <0.25 has a sensitivity of 70% and a specificity of 89% to identify patients with RVEF ≥0.50.23 Doppler-derived RIMP measurement correlates with the CMR-derived RVEF and is a simple and reliable method for the evaluation of RV function in adults with repaired tetralogy of Fallot. This index is a marker of prognosis in patients with heart failure and primary pulmonary hypertension and has been used for risk stratification.24,25
Figure 19–7.
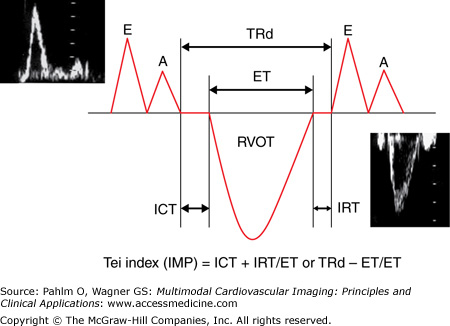
The Tei index (of myocardial performance) is measured using conventional pulsed wave Doppler. The tricuspid inflow (E and A waves) and the right ventricular outflow tract (RVOT) spectral Doppler analysis is all that is required. Because this requires two different ultrasound windows (and different cardiac cycles), care must be given to minimize time lag between image acquisition (and thereby minimize changes in HR). To obtain the Tei index from one ultrasound window and reduce chance for HR difference errors, the duration of the tricuspid regurgitation (TRd) can be used if tricuspid regurgitation is present. A, tricuspid inflow late (atrial) wave; E, tricuspid inflow early wave; ET, ejection time; IMP, index of myocardial performance; IVCT, isovolumic contraction time; IVRT, isovolumic relaxation time.
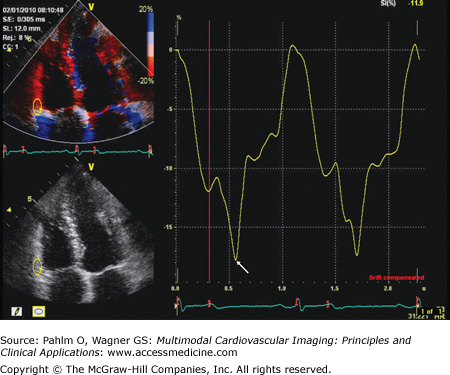
Tissue Doppler imaging of the RV is a useful and readily applicable adjunct to the comprehensive echocardiography Doppler assessment of the RV by transthoracic echocardiography. Tissue Doppler imaging permits analysis of the RV longitudinal myocardial velocity. Because the RV is composed of a network of clockwise and counter-clockwise endocardial and epicardial longitudinal myofibers, the RV myocardial velocity reflects RV systolic function. Similar to the LV, five major deflections are visualized on tissue Doppler imaging of the RV tricuspid annulus: ICT wave, systolic velocity, IRT wave, early diastolic velocity, and late diastolic velocity (Fig. 19–8). Timing of the RV events can be measured using a high frame rate, leading to an alternative calculation of RIMP (Fig. 19–9). Because short time measurements are analyzed to derive this value, it is imperative that high-quality tissue Doppler imaging tracings are obtained with satisfactory temporal resolution.
Figure 19–8.
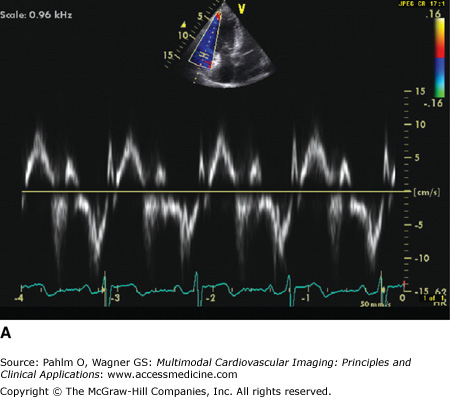
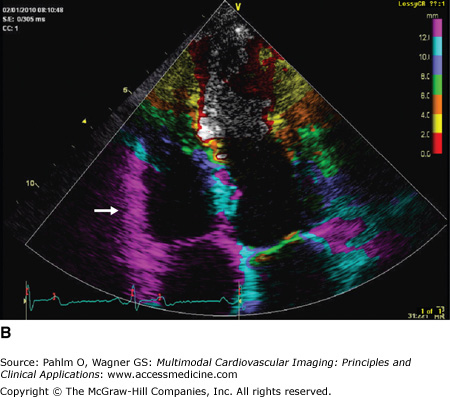
A. Five major deflections are visualized on tissue Doppler imaging of the right ventricular (RV) tricuspid annulus: the isovolumic contraction time wave (ICT), systolic velocity (Sa), isovolumic relaxation time wave (IRT), early diastolic velocity (Ea), and late diastolic velocity (Aa). B. Tissue Doppler evaluation of the RV myocardium allows for color coding of the derivative of tissue velocity (displacement). Note the normal visually estimated tricuspid annular plane systolic excursion (TAPSE) where the basal half of the RV myocardial wall moves >12 mm at end-systole (purple color of the basal RV; arrow).
Tissue Doppler can also be used to record the peak systolic velocity of the tricuspid annulus (s′). In healthy individuals, the lower normal limit at the basal RV lateral wall is ≥14 ± 2 cm/s for DTI spectral displays and ≥10 ± 2 cm/s for DTI color displays. This velocity has been shown to correlate more closely with CMR-derived RVEF than the fractional area change (FAC), DTI-derived tissue displacement, systolic strain, and strain rate.26 An s′ <9.5 cm/s identifies patients with an RVEF <40%.27 Thresholds of >12, 12 to 9, and <9 cm/s allow differentiation between normal (>55%), moderately reduced (30%-55%), and severely reduced (<30%) RVEF, respectively.28
Myocardial velocity of the RV free wall as measured by DTI during the ICT phase has also been used to estimate RV contractility. However, this parameter is more sensitive to loading conditions than the other listed markers. Myocardial acceleration during the earliest phase of ICT is a novel index for the assessment of RV contractile function that is less affected by preload and afterload changes.29 This index is calculated by dividing myocardial velocity during ICT by the time interval from the onset of this wave to the time at peak velocity (Fig. 19–9).
Figure 19–9.
The Tei index (of myocardial performance) may also be measured using myocardial tissue Doppler echocardiography (TDE) instead of conventional Doppler. The tricuspid annular TDE spectral analysis is all that is required. This method only uses one ultrasound window and reduces the chance for heart rate difference errors. The acceleration time (AT) of the isovolumic contraction time (ICT) may also be obtained (see text for details). Aa, tricuspid TDE annular late (atrial) wave; AT, acceleration time; Ea, tricuspid TDE annular early wave; IRT, isovolumic relaxation time; IVV, (isovolumic velocity); Sa, tricuspid TDE annular systolic wave.
Tissue Doppler measures are dependent on the Doppler cursor angle. This limitation is overcome with 2D strain measures (speckle tracking) and, being angle independent, allows the evaluation of regional function in all myocardial segments, including the ventricular apex (Fig. 19–10). Ultrasound “speckles” in the RV wall are tracked and allow the determination of the global and regional, frame-to-frame measure of myocardial velocities, 2D strain, and strain rate. Peak systolic strain and strain rate, particularly of the basal RV free wall, are significantly impaired in patients with pulmonary arterial hypertension and have been used as an index of RV function.30
Figure 19–10.
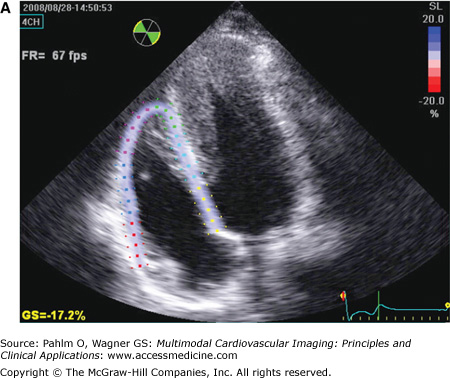
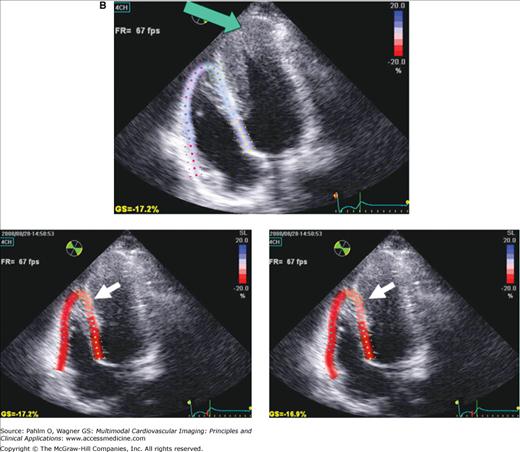
RV speckle tracking allows for color coding of normal two-dimensional strain that is not dependent on cursor angle limitations, which is a limitation of tissue Doppler echocardiography. A. End-diastole. B. End-systole. Images in B were acquired at different times demonstrating the reproducibility of results. Red = normal. Note the mildly abnormal distal septal and apical region on both data sets (pink; white arrow). Although this may be an artifact from using a technique designed for the left ventricle (LV), in this patient with an apical hypertrophic cardiomyopathy (note LV apex; green arrow), abnormal apical strain of the RV would be expected.
The quantification of regional myocardial function remains a challenge. One main limitation of conventional DTI is that an akinetic segment may still possess measurable myocardial velocities due to being tethered to a normal adjacent myocardial segment. Strain and strain rate are indices of myocardial deformation that largely overcome this limitation. Strain rate (velocity of deformation) can be calculated from the spatial gradient in velocities recorded between two neighboring points in the tissue (Fig. 19–11).31 The longitudinal RV strain and strain rate values are higher and more inhomogeneous than those in the LV. Mean values for longitudinal strain and strain rate are lowest in the basal RV segments and increase toward the apical segments. Strain rate imaging is independent of overall motion.
The quantification of regional RV function using either 2D or DTI strain values is feasible and reproducible.32 This technique has a potential role in the initial and serial assessment of patients with primary or secondary RV disease and correlates with invasive and CMR findings of RV performance.33
Three-dimensional (3D) echocardiographic analysis of the RV has recently been reported to eliminate the geometric intricacies of the RV. Due to the nongeometric 3D shape of the RV, the measurement of RV volume is challenging, resulting in numerous qualitative, but limited quantitative, measures. Recently, real-time 3D echocardiography (RT3DE) has become available and can provide reliable, reproducible measures of RV volumes independent of geometric assumptions.34 By manually tracing the endocardial borders during systole and diastole, the RV volumes are determined, and RVEF is calculated. Because an image of the entire RV is acquired in a single pyramidal data set, any acoustic window will increase the likelihood that adequate quality data are obtained (Fig. 19–12). For measuring RV volume and RVEF, RT3DE is more accurate and reproducible than 2D echocardiography and has less variation and higher correlation to CMR.35 Normal RT3DE values of the RV size and function are listed in Table 19–2.36
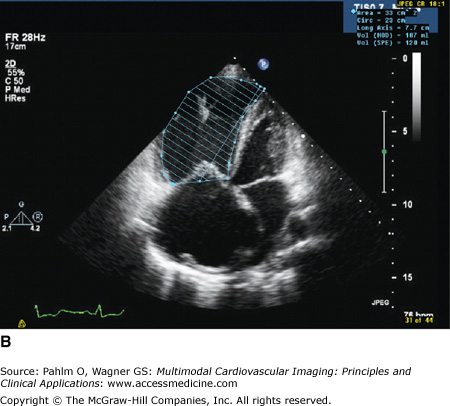
Figure 19–12.
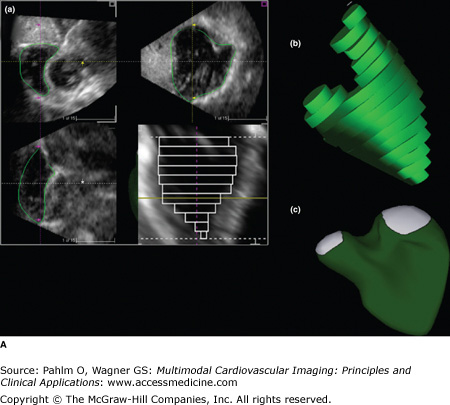
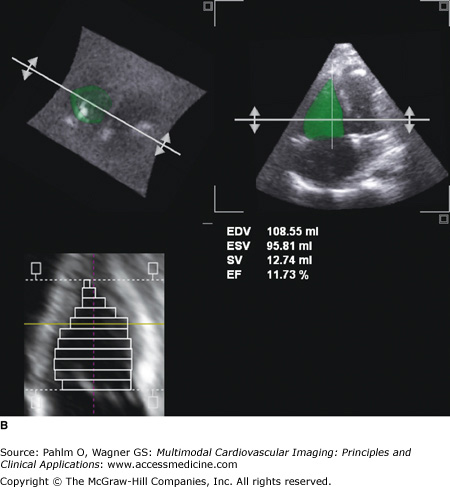
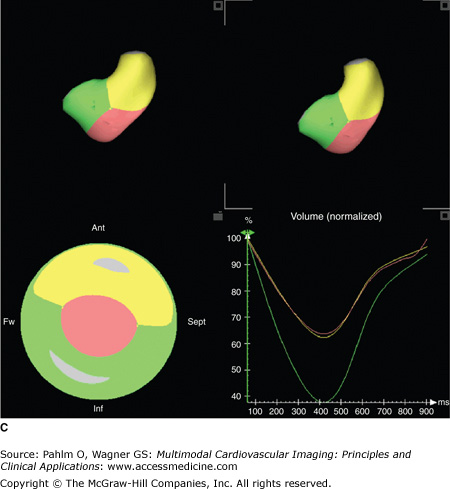
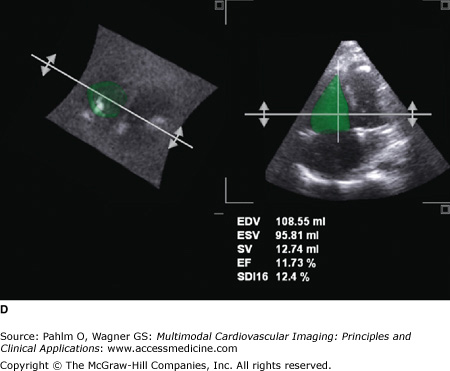
A. Three-dimensional (3D) echocardiography. a. Right ventricular (RV) triplane series with stacked right ventricular slices. Manual traced RV endocardial borders from the sagittal, coronal, and axial orientations provide a disk summation method (Simpson’s rule) of volume and ejection fraction (EF) (b) and creation of a dynamic, smoothed 3D surface model (c). This method incorporates the longitudinal motion (tricuspid annular plane systolic excursion), the RV outflow tract contraction (fractional area change), and the interventricular dependence (septal contour). B. 3D echocardiography. This patient has a markedly dilated RV and severely reduced RVEF (see normal values in Table 19–2). EDV, end-diastolic volume; ESV, end-systolic volume; SV, stroke volume. See Moving Image 19–12B. C. Color-coded, regional surface maps of the RV provide assessment of regional contraction patterns and segmental time-volume curves. Red = apex; green = RV inflow; yellow = RV outflow. D. 3D echocardiogram. Because the entire RV is acquired in a single pyramidal data set, any available acoustic window will increase the likelihood that adequate quality data are obtained. This is the same patient as in Fig. 19–5 (note the similarity of the calculated RVEF demonstrating severe global RV dysfunction).
| Volume | n | CMR (mL/m2) Mean (SD) | RT3DE (mL/m2) Mean (SD) |
|---|---|---|---|
| EDV | |||
| All | 71 | 71.3 (12.9) | 70.0 (12.9) |
| Men | 36 | 67.1 (12.1) | 65.4 (13.4) |
| Women | 35 | 75.6 (12.4) | 74.7 (13.0) |
| ESV | |||
| All | 33.5 (9.9) | 33.4 (10.3) | |
| Men | 28.6 (8.1) | 29.2 (10.7) | |
| Women | 38.4 (9.1) | 37.8 (7.4) | |
| FF | |||
| All | 53.3 (8.7) | 52.6 (9.9) | |
| Men | 57.5 (7.0) | 56.2 (9.1) | |
| Women | 49.0 (8.8) | 48.9 (9.5) | |
In a study of 200 patients, including normal controls and patients with valvular heart disease, pulmonary hypertension, and dilated cardiomyopathies, RT3DE results were compared with results from conventional 2D and RV Doppler flow and showed a positive correlation of 3D RVEF with TAPSE, FAC, and peak s′ tissue Doppler echocardiography (TDE) velocity and a negative correlation with pulmonary artery pressure.37 Adequate, good-quality 3D acquisition was obtained in nearly all patients with a mean time of 3 ± 1 minutes. The technique of RT3DE has been validated in phantoms, animals studies, adult patients with RV cardiomyopathies, and children with congenital heart diseases.38 Excellent correlation exists with magnetic resonance imaging (MRI) reference standards, although there is a common underestimation of RV volumes. Although additional data from RT3DE studies including a wider variety of RV pathologies are needed, this option appears to be the most cost-effective reference standard for quantitative RV volume and EF determination.
In patients with suboptimal transthoracic echocardiographic windows, transesophageal echocardiography (TEE) may be considered because the esophageal window is frequently adequate for cardiac assessment. There are few studies reported on the use of this method for assessment of the RV. Most reports are from intraoperative studies where inotropic medications and rapid fluid shifts limit the interpretation of reported findings. In a study of 25 children with atrial septal defects undergoing surgical correction, 90% had adequate 3D TEE studies.39 RV volumes had an excellent correlation with direct surgical measures (r2 = 0.99), obtained at the end of surgery by injecting saline solution through the tricuspid valve using a graduated syringe, but had a slight, consistent overestimation.
If tricuspid or pulmonic valve disease is suspected, this is a valuable complementary diagnostic tool. This approach is also useful for the assessment of the atrial septum for congenital defects or to determine whether RVOT obstruction is a cause of RV dilation or dysfunction. In general, TEE is reserved for patients in whom the transthoracic echocardiogram is suboptimal, despite the use of contrast, and when CMR is unavailable.
Radionuclide angiography (RNA) is the historical reference standard for RVEF and has been used to measure global and regional RV abnormalities.40 A significant advantage of this technique is its reliance on a count-based method that is independent of geometry. This technique relies on separation of the radioactivity within the RV from adjacent structures, especially the right atrium. The RVEF is calculated by tracing the RV cavity in an end-diastolic and end-systolic frame. The most accurate method to achieve this is a gated first-pass RNA. This ensures that the radioisotope remains within the RV cavity and allows acquisition of RV functional data prior to the isotope crossing the pulmonary vasculature and contaminating the field of interest with left atrial and LV radioactivity. Although nuclear scans are widely available, first-pass RNA studies are not commonly performed.
Multigated acquisition (MUGA) equilibrium scans are used for analysis of functional LV data but are not optimal for RV assessment and result in underestimation of the RVEF. We have found that first-pass RNA correlates better with CMR determined RVEF, as compared with gated equilibrium RNA.41
Myocardial perfusion imaging (MPI) using electrocardiogram (ECG)-gated single photon emission computed tomography (SPECT) is commonly performed for evaluation of myocardial ischemia. It is not used primarily to evaluate LV (or RV) function, but this information is obtained and is valuable when an ischemia assessment is performed. Its specific role in evaluating RV pathology is limited. Indirect evidence of RV dilation and RV hypertrophy may be seen as increased RV radiotracer uptake, but SPECT cannot clarify whether this is due to valvular or congenital heart disease, pulmonary arterial hypertension, or a primary RV cardiomyopathy.42 MPI is most valuable to assess LV myocardial ischemia or scar and may assist in the indirect assessment of the patient with RV cardiomyopathy.
Radiolabeled iodine 123–meta-iodobenzylguanidine (123
Related posts:
 Optical Mapping of Electrical Activity
 Phonocardiography
 Ischemic Heart Disease
 Development of the Heart, with Particular Reference to the Cardiac Conduction Tissues
 Myocardial Perfusion Single Photon Emission Computed Tomography and Positron Emission Tomography
 Cardiac Magnetic Resonance Imaging in Ischemic Heart Disease
Stay updated, free articles. Join our Telegram channel

Full access? Get Clinical Tree


